
|
|||||
|
 | |
| |
| |
| |
| |
| |
|
Gene: FAM65B |
Gene summary for FAM65B |
| Gene information | Species | Human | Gene symbol | FAM65B | Gene ID | 9750 |
| Gene name | RHO family interacting cell polarization regulator 2 | |
| Gene Alias | C6orf32 | |
| Cytomap | 6p22.3 | |
| Gene Type | protein-coding | GO ID | GO:0000768 | UniProtAcc | B7Z5J9 |
Top |
Malignant transformation analysis |
| Identification of the aberrant gene expression in precancerous and cancerous lesions by comparing the gene expression of stem-like cells in diseased tissues with normal stem cells |
| Entrez ID | Symbol | Replicates | Species | Organ | Tissue | Adj P-value | Log2FC | Malignancy |
| 9750 | FAM65B | HCC1 | Human | Liver | HCC | 2.38e-20 | 1.98e+00 | 0.5336 |
| 9750 | FAM65B | HCC2 | Human | Liver | HCC | 1.13e-38 | 3.10e+00 | 0.5341 |
| 9750 | FAM65B | HCC5 | Human | Liver | HCC | 1.76e-71 | 3.43e+00 | 0.4932 |
| 9750 | FAM65B | Dong_P1 | Human | Prostate | Tumor | 4.27e-02 | 5.06e-02 | 0.035 |
| 9750 | FAM65B | Dong_P3 | Human | Prostate | Tumor | 2.85e-07 | 1.28e-01 | 0.0278 |
| 9750 | FAM65B | P7 | Human | Prostate | Tumor | 1.67e-02 | 2.54e-01 | -0.1025 |
| 9750 | FAM65B | GSM5353216_PA_PB1A_Pool_1_3_S50_L002 | Human | Prostate | Tumor | 3.71e-02 | 5.52e-01 | 0.159 |
| 9750 | FAM65B | GSM5353221_PA_PB2A_Pool_1_3_S25_L001 | Human | Prostate | Tumor | 2.78e-04 | 2.86e-01 | 0.1633 |
| 9750 | FAM65B | GSM5353224_PA_PR5186_Pool_1_2_3_S27_L001 | Human | Prostate | Tumor | 4.96e-07 | 3.36e-01 | 0.1621 |
| 9750 | FAM65B | GSM5353225_PA_PR5196-1_Pool_1_2_3_S53_L002 | Human | Prostate | Tumor | 3.41e-03 | 4.31e-01 | 0.1619 |
| 9750 | FAM65B | GSM5353227_PA_PR5199-193K_Pool_1_2_3_S55_L002 | Human | Prostate | Tumor | 5.40e-10 | 5.31e-01 | 0.1602 |
| 9750 | FAM65B | GSM5353236_PA_PR5251_T1_S7_L001 | Human | Prostate | Tumor | 5.78e-05 | 4.28e-01 | 0.1608 |
| 9750 | FAM65B | GSM5353240_PA_PR5254_T1_S15_L001 | Human | Prostate | Tumor | 3.09e-16 | 5.97e-01 | 0.1575 |
| 9750 | FAM65B | GSM5353243_PA_PR5261_T1_S23_L002 | Human | Prostate | Tumor | 4.84e-16 | 6.19e-01 | 0.1545 |
| 9750 | FAM65B | GSM5353244_PA_PR5261_T2_S24_L002 | Human | Prostate | Tumor | 1.16e-18 | 7.45e-01 | 0.1569 |
| Page: 1 |
| Tissue | Expression Dynamics | Abbreviation |
| Liver |  | HCC: Hepatocellular carcinoma |
| NAFLD: Non-alcoholic fatty liver disease | ||
| Prostate | 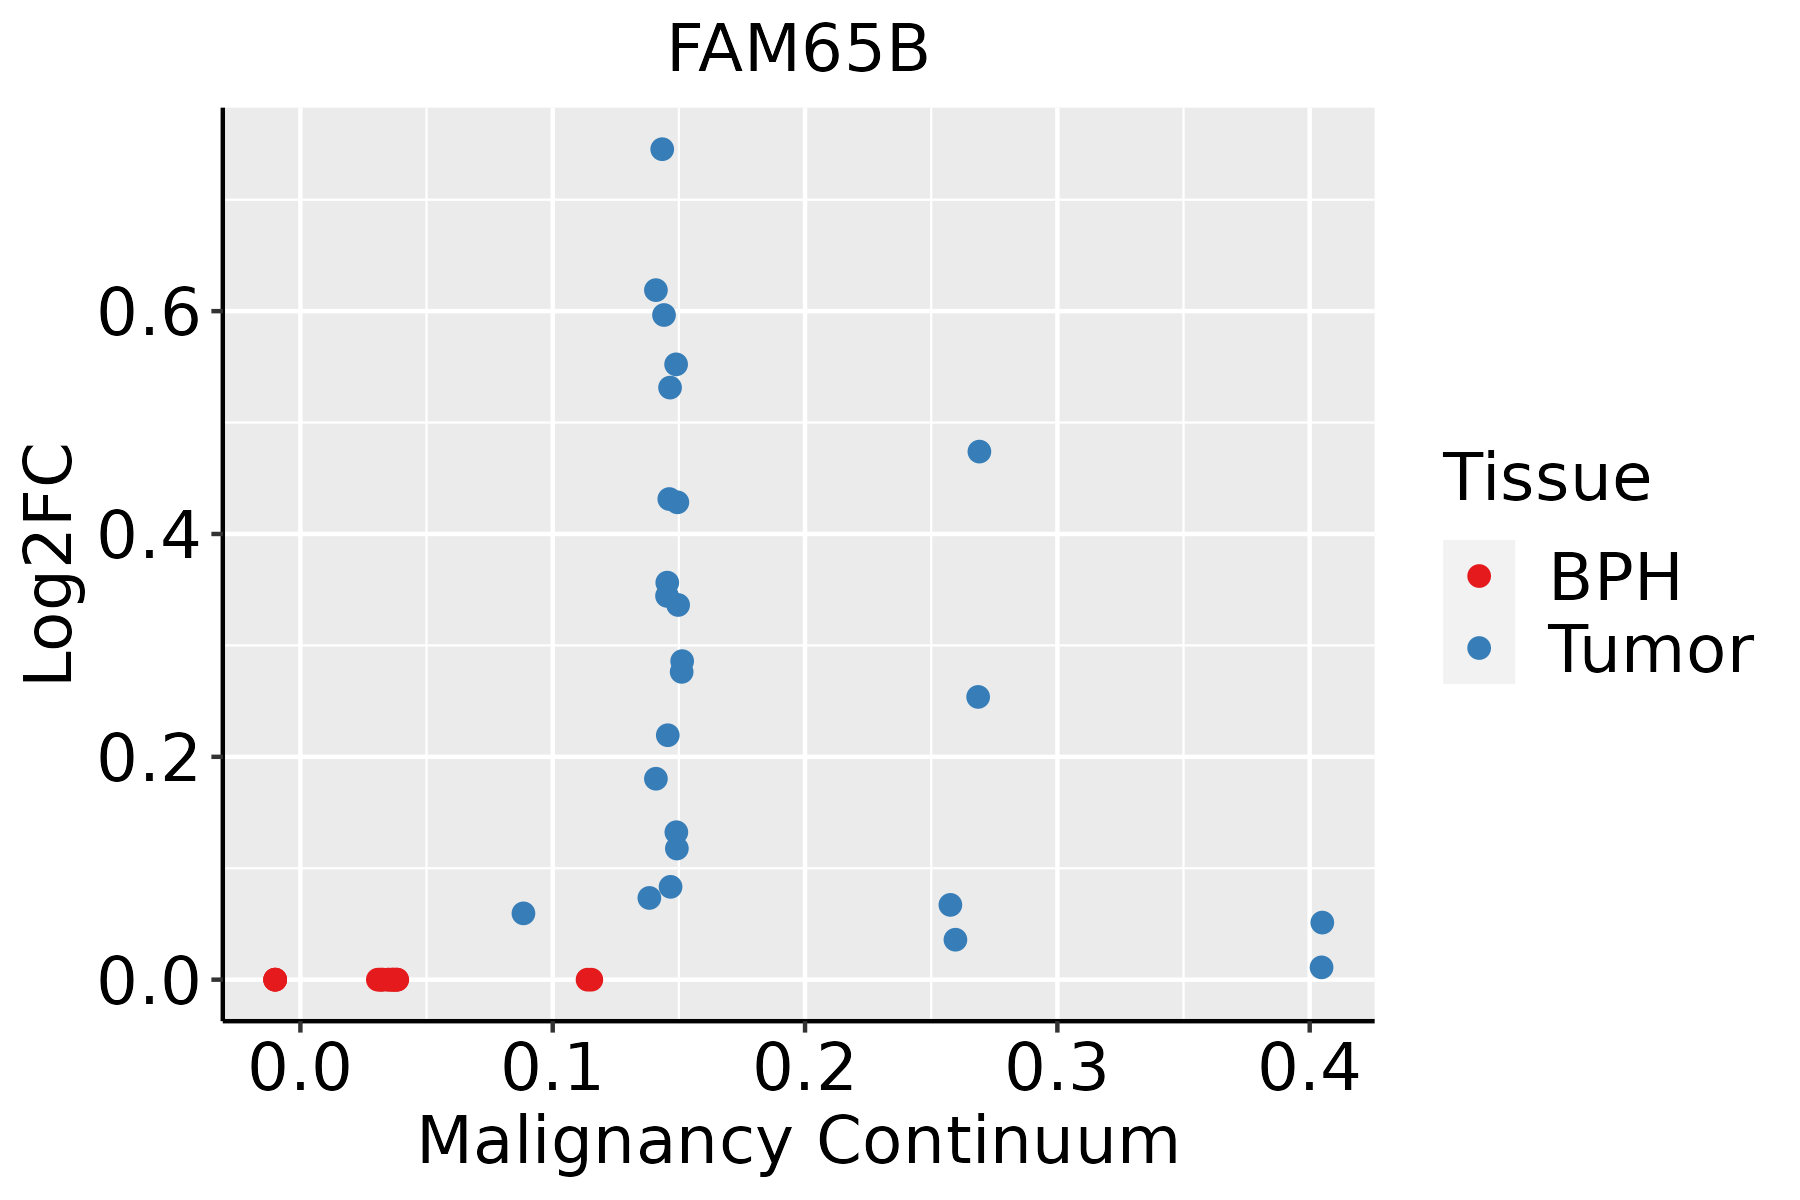 | BPH: Benign Prostatic Hyperplasia |
| ∗log2FC in expression of this searched gene in stem-like cells from each diseased tissue sample relative to stem-like cells in normal samples in each tissue plotted against the malignancy continuum. Samples are colored based on if they are from different disease stage. |
Top |
Malignant transformation related pathway analysis |
| Find out the enriched GO biological processes and KEGG pathways involved in transition from healthy to precancer to cancer |
| Tissue | Disease Stage | Enriched GO biological Processes |
| Colorectum | AD |  |
| Colorectum | SER |  |
| Colorectum | MSS |  |
| Colorectum | MSI-H |  |
| Colorectum | FAP |  |
| ∗Top 15 enriched GO BP terms are showed in the bar plot of each disease state in each tissue. Each row represents a significant GO biological process which is colored according to the -log10(p.adjust). |
| Page: 1 2 3 4 5 6 7 8 9 |
| GO ID | Tissue | Disease Stage | Description | Gene Ratio | Bg Ratio | pvalue | p.adjust | Count |
| Page: 1 |
| Pathway ID | Tissue | Disease Stage | Description | Gene Ratio | Bg Ratio | pvalue | p.adjust | qvalue | Count |
| Page: 1 |
Top |
Cell-cell communication analysis |
| Identification of potential cell-cell interactions between two cell types and their ligand-receptor pairs for different disease states |
| Ligand | Receptor | LRpair | Pathway | Tissue | Disease Stage |
| Page: 1 |
Top |
Single-cell gene regulatory network inference analysis |
| Find out the significant the regulons (TFs) and the target genes of each regulon across cell types for different disease states |
| TF | Cell Type | Tissue | Disease Stage | Target Gene | RSS | Regulon Activity |
| ∗The dot plots of a searched regulon are shown for all cell subpopulations in each disease state of each tissue based on the regulon specific score inferred using pySCENIC and by calculating the average expression. |
| Page: 1 |
Top |
Somatic mutation of malignant transformation related genes |
| Annotation of somatic variants for genes involved in malignant transformation |
| Hugo Symbol | Variant Class | Variant Classification | dbSNP RS | HGVSc | HGVSp | HGVSp Short | SWISSPROT | BIOTYPE | SIFT | PolyPhen | Tumor Sample Barcode | Tissue | Histology | Sex | Age | Stage | Therapy Types | Drugs | Outcome |
| FAM65B | SNV | Missense_Mutation | novel | c.1530N>C | p.Lys510Asn | p.K510N | Q9Y4F9 | protein_coding | tolerated(0.45) | benign(0.003) | TCGA-A2-A0T2-01 | Breast | breast invasive carcinoma | Female | >=65 | III/IV | Chemotherapy | xeloda | PD |
| FAM65B | SNV | Missense_Mutation | c.1559N>T | p.Arg520Leu | p.R520L | Q9Y4F9 | protein_coding | tolerated(0.27) | benign(0.003) | TCGA-A2-A3Y0-01 | Breast | breast invasive carcinoma | Female | <65 | I/II | Chemotherapy | adriamycin | CR | |
| FAM65B | SNV | Missense_Mutation | novel | c.2165G>A | p.Gly722Glu | p.G722E | Q9Y4F9 | protein_coding | deleterious(0) | possibly_damaging(0.73) | TCGA-AC-A3W5-01 | Breast | breast invasive carcinoma | Female | >=65 | I/II | Chemotherapy | docetaxel | CR |
| FAM65B | SNV | Missense_Mutation | novel | c.2928A>C | p.Glu976Asp | p.E976D | Q9Y4F9 | protein_coding | tolerated(0.1) | probably_damaging(0.99) | TCGA-AN-A046-01 | Breast | breast invasive carcinoma | Female | >=65 | I/II | Unknown | Unknown | SD |
| FAM65B | SNV | Missense_Mutation | novel | c.415G>A | p.Val139Ile | p.V139I | Q9Y4F9 | protein_coding | tolerated(0.23) | probably_damaging(0.995) | TCGA-AN-A046-01 | Breast | breast invasive carcinoma | Female | >=65 | I/II | Unknown | Unknown | SD |
| FAM65B | SNV | Missense_Mutation | rs775842188 | c.331C>T | p.Arg111Cys | p.R111C | Q9Y4F9 | protein_coding | deleterious(0.01) | probably_damaging(0.999) | TCGA-AN-A046-01 | Breast | breast invasive carcinoma | Female | >=65 | I/II | Unknown | Unknown | SD |
| FAM65B | SNV | Missense_Mutation | novel | c.1530N>C | p.Lys510Asn | p.K510N | Q9Y4F9 | protein_coding | tolerated(0.45) | benign(0.003) | TCGA-AO-A1KP-01 | Breast | breast invasive carcinoma | Female | >=65 | I/II | Chemotherapy | fluorouracil | SD |
| FAM65B | SNV | Missense_Mutation | c.913N>C | p.Gly305Arg | p.G305R | Q9Y4F9 | protein_coding | deleterious(0) | probably_damaging(1) | TCGA-C8-A12K-01 | Breast | breast invasive carcinoma | Female | >=65 | I/II | Unknown | Unknown | SD | |
| FAM65B | SNV | Missense_Mutation | novel | c.1530A>C | p.Lys510Asn | p.K510N | Q9Y4F9 | protein_coding | tolerated(0.45) | benign(0.003) | TCGA-C8-A12X-01 | Breast | breast invasive carcinoma | Female | <65 | I/II | Unknown | Unknown | SD |
| FAM65B | SNV | Missense_Mutation | c.1798N>G | p.Leu600Val | p.L600V | Q9Y4F9 | protein_coding | tolerated(0.41) | benign(0.199) | TCGA-D8-A27G-01 | Breast | breast invasive carcinoma | Female | >=65 | I/II | Unknown | Unknown | SD |
| Page: 1 2 3 4 5 6 7 8 9 10 11 12 13 14 |
Top |
Related drugs of malignant transformation related genes |
| Identification of chemicals and drugs interact with genes involved in malignant transfromation |
| (DGIdb 4.0) |
| Entrez ID | Symbol | Category | Interaction Types | Drug Claim Name | Drug Name | PMIDs |
| Page: 1 |

Copyright 2023-Present -The University of Texas Health Science Center at Houston |