
|
|||||
|
 | |
| |
| |
| |
| |
| |
|
Gene: FAM53C |
Gene summary for FAM53C |
| Gene information | Species | Human | Gene symbol | FAM53C | Gene ID | 51307 |
| Gene name | family with sequence similarity 53 member C | |
| Gene Alias | C5orf6 | |
| Cytomap | 5q31.2 | |
| Gene Type | protein-coding | GO ID | GO:0006606 | UniProtAcc | Q9NYF3 |
Top |
Malignant transformation analysis |
| Identification of the aberrant gene expression in precancerous and cancerous lesions by comparing the gene expression of stem-like cells in diseased tissues with normal stem cells |
| Entrez ID | Symbol | Replicates | Species | Organ | Tissue | Adj P-value | Log2FC | Malignancy |
| 51307 | FAM53C | LZE4T | Human | Esophagus | ESCC | 1.50e-06 | 2.46e-01 | 0.0811 |
| 51307 | FAM53C | LZE5T | Human | Esophagus | ESCC | 4.44e-02 | 4.52e-02 | 0.0514 |
| 51307 | FAM53C | LZE7T | Human | Esophagus | ESCC | 6.88e-08 | 4.82e-01 | 0.0667 |
| 51307 | FAM53C | LZE8T | Human | Esophagus | ESCC | 2.94e-09 | 3.30e-01 | 0.067 |
| 51307 | FAM53C | LZE20T | Human | Esophagus | ESCC | 9.97e-07 | 2.78e-01 | 0.0662 |
| 51307 | FAM53C | LZE24T | Human | Esophagus | ESCC | 3.69e-18 | 5.93e-01 | 0.0596 |
| 51307 | FAM53C | LZE21T | Human | Esophagus | ESCC | 1.22e-04 | 1.67e-01 | 0.0655 |
| 51307 | FAM53C | LZE6T | Human | Esophagus | ESCC | 2.85e-03 | 1.19e-01 | 0.0845 |
| 51307 | FAM53C | P1T-E | Human | Esophagus | ESCC | 2.31e-09 | 2.54e-01 | 0.0875 |
| 51307 | FAM53C | P2T-E | Human | Esophagus | ESCC | 3.80e-27 | 4.76e-01 | 0.1177 |
| 51307 | FAM53C | P4T-E | Human | Esophagus | ESCC | 4.79e-10 | 2.43e-01 | 0.1323 |
| 51307 | FAM53C | P5T-E | Human | Esophagus | ESCC | 1.16e-09 | 1.43e-01 | 0.1327 |
| 51307 | FAM53C | P8T-E | Human | Esophagus | ESCC | 1.40e-15 | 1.50e-01 | 0.0889 |
| 51307 | FAM53C | P9T-E | Human | Esophagus | ESCC | 1.43e-13 | 3.02e-01 | 0.1131 |
| 51307 | FAM53C | P10T-E | Human | Esophagus | ESCC | 1.51e-21 | 3.83e-01 | 0.116 |
| 51307 | FAM53C | P11T-E | Human | Esophagus | ESCC | 5.23e-18 | 1.07e+00 | 0.1426 |
| 51307 | FAM53C | P12T-E | Human | Esophagus | ESCC | 5.32e-35 | 7.07e-01 | 0.1122 |
| 51307 | FAM53C | P15T-E | Human | Esophagus | ESCC | 1.50e-22 | 5.05e-01 | 0.1149 |
| 51307 | FAM53C | P16T-E | Human | Esophagus | ESCC | 8.02e-13 | 3.58e-01 | 0.1153 |
| 51307 | FAM53C | P20T-E | Human | Esophagus | ESCC | 4.82e-49 | 1.25e+00 | 0.1124 |
| Page: 1 2 3 4 5 6 |
| Tissue | Expression Dynamics | Abbreviation |
| Esophagus | 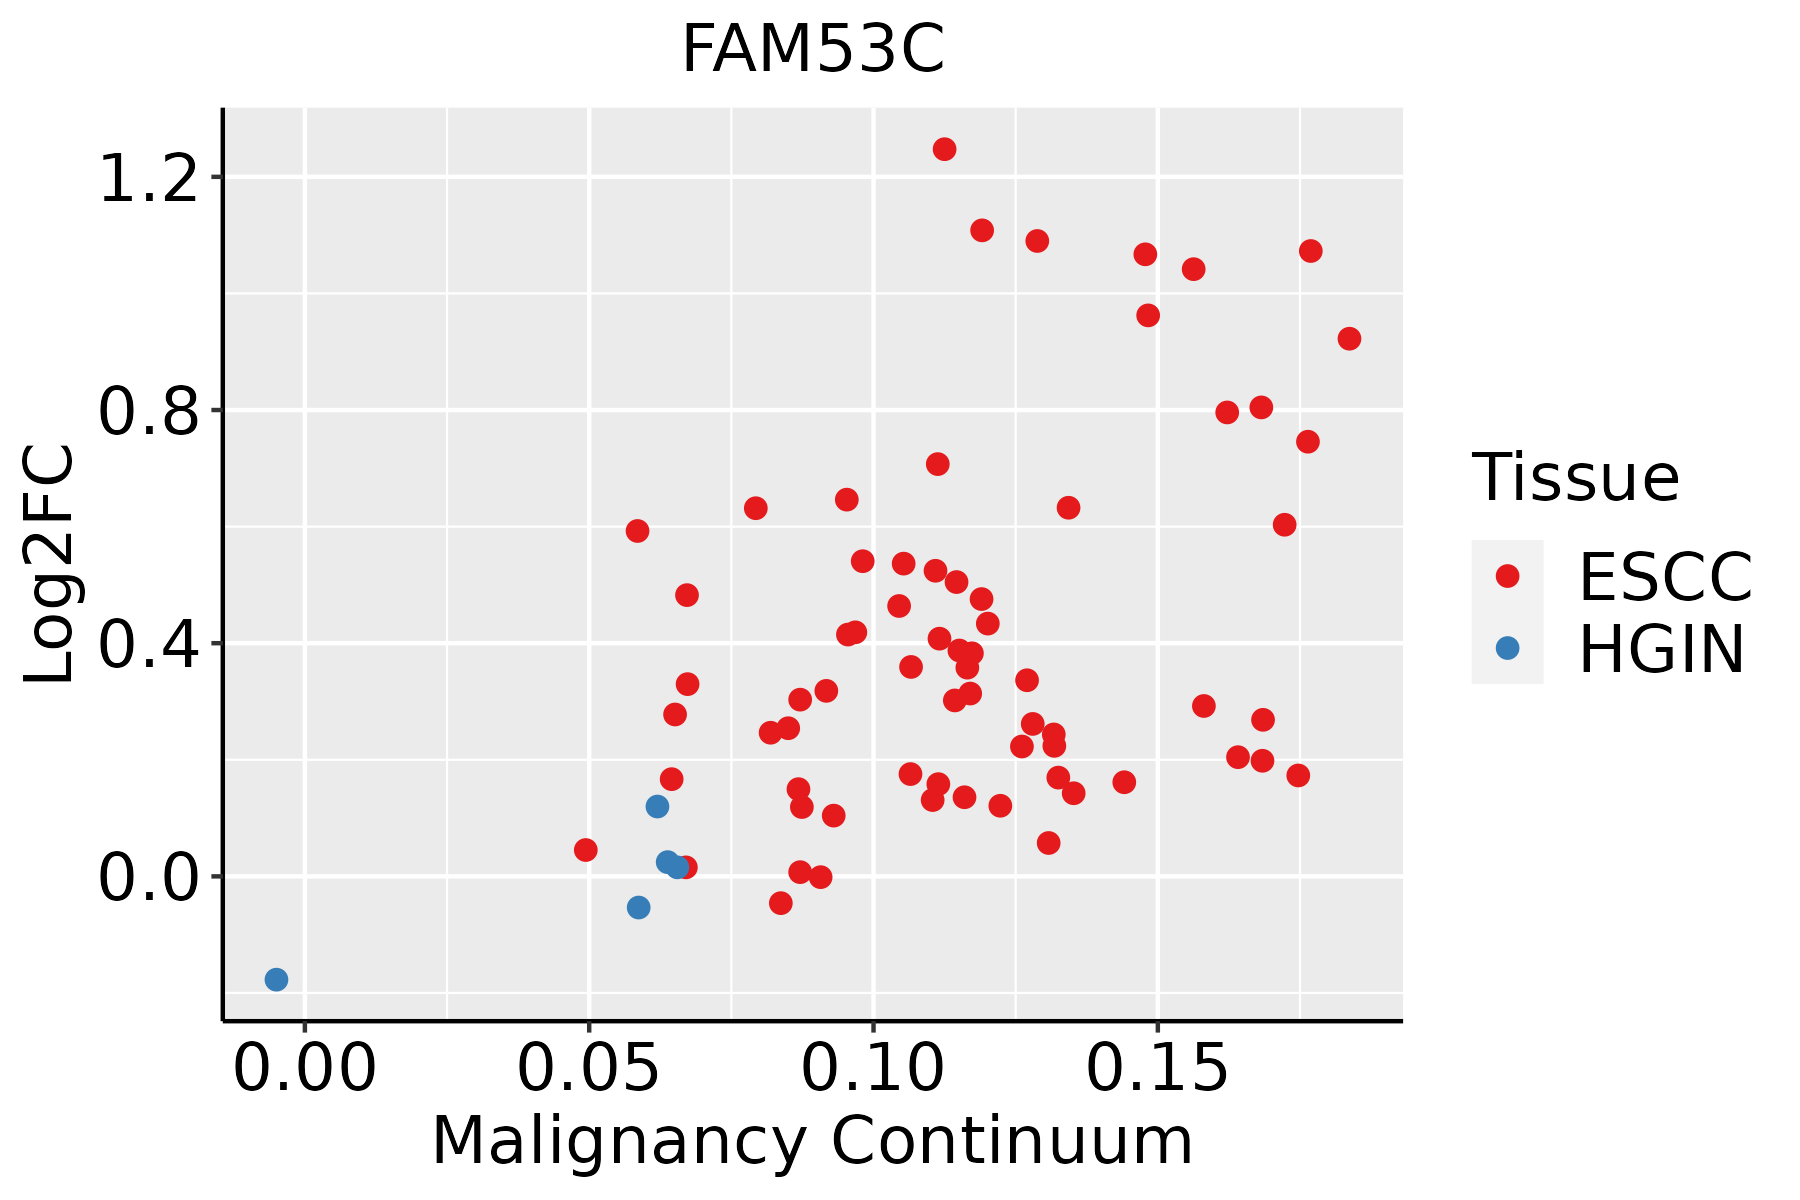 | ESCC: Esophageal squamous cell carcinoma |
| HGIN: High-grade intraepithelial neoplasias | ||
| LGIN: Low-grade intraepithelial neoplasias | ||
| Liver |  | HCC: Hepatocellular carcinoma |
| NAFLD: Non-alcoholic fatty liver disease | ||
| Oral Cavity | 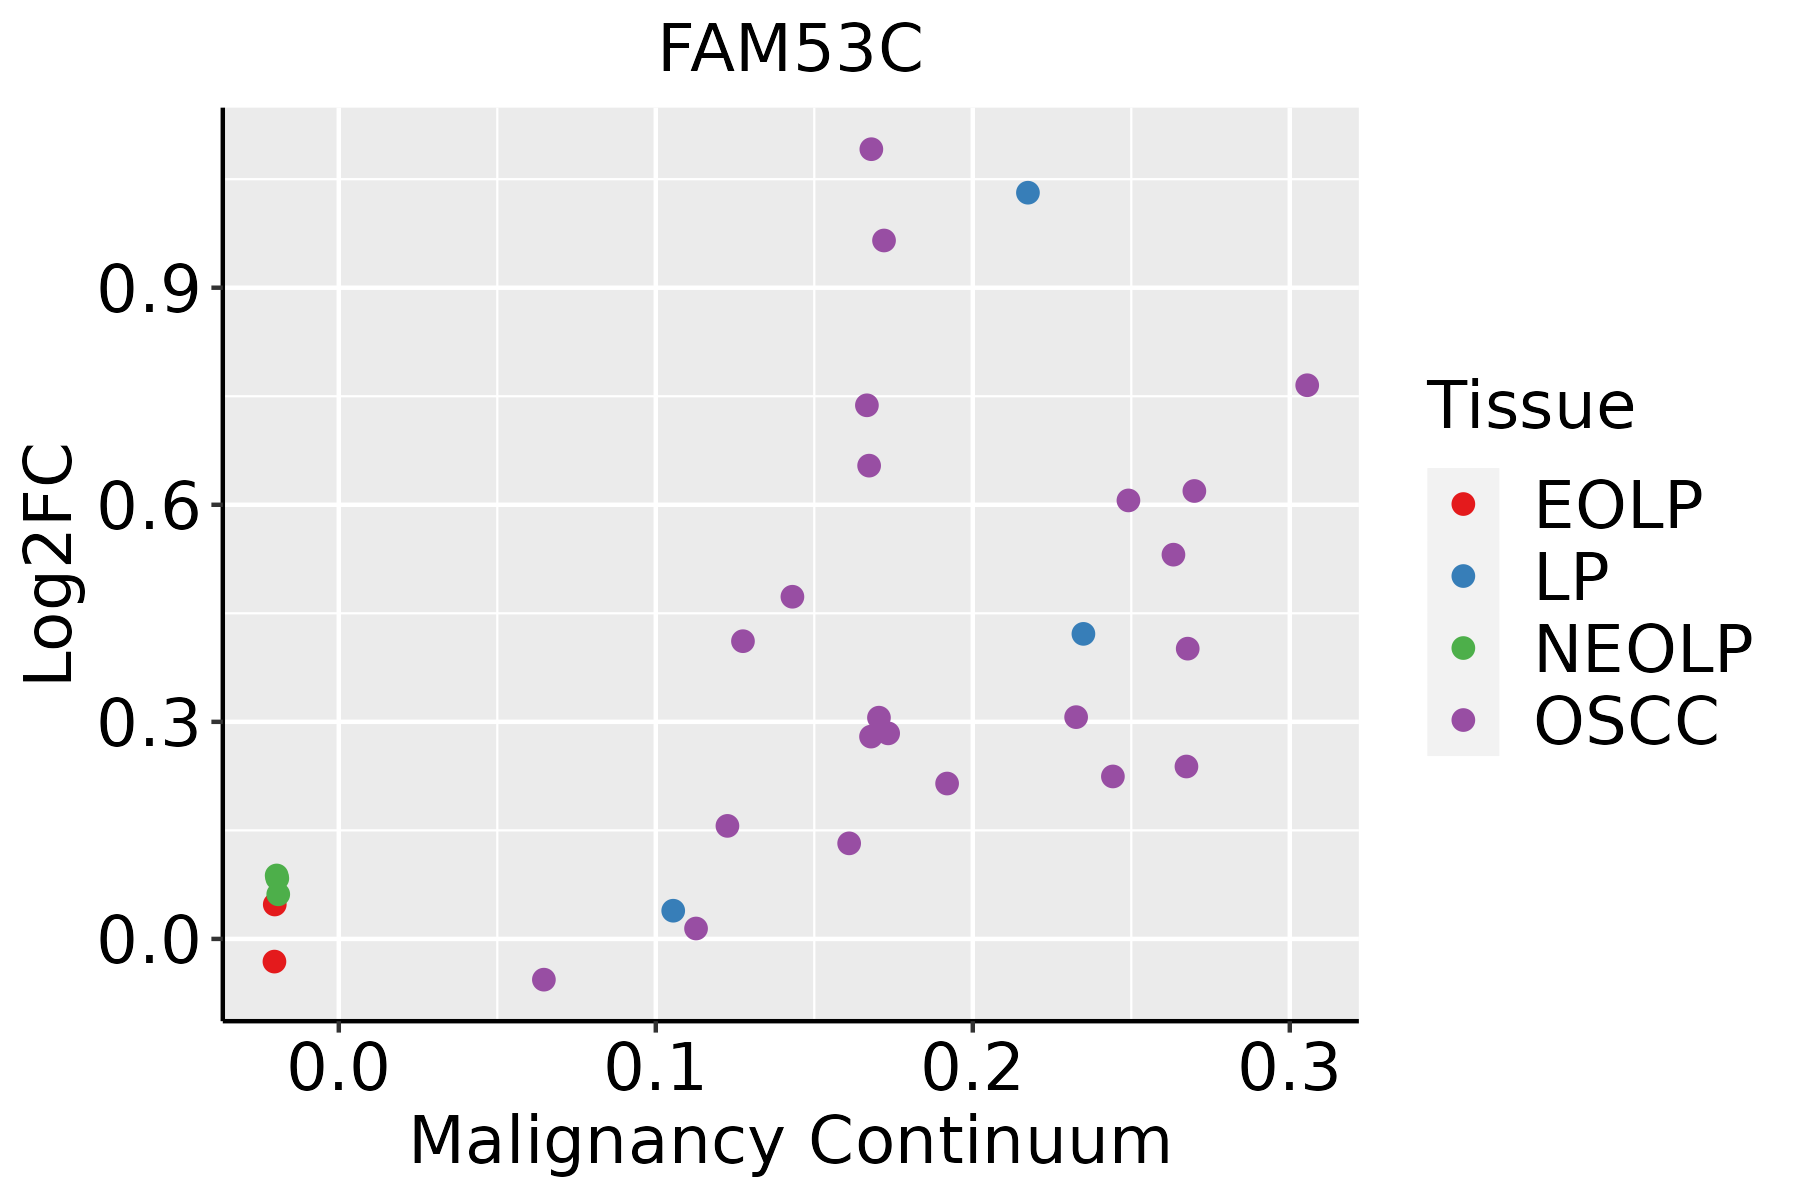 | EOLP: Erosive Oral lichen planus |
| LP: leukoplakia | ||
| NEOLP: Non-erosive oral lichen planus | ||
| OSCC: Oral squamous cell carcinoma | ||
| Prostate | 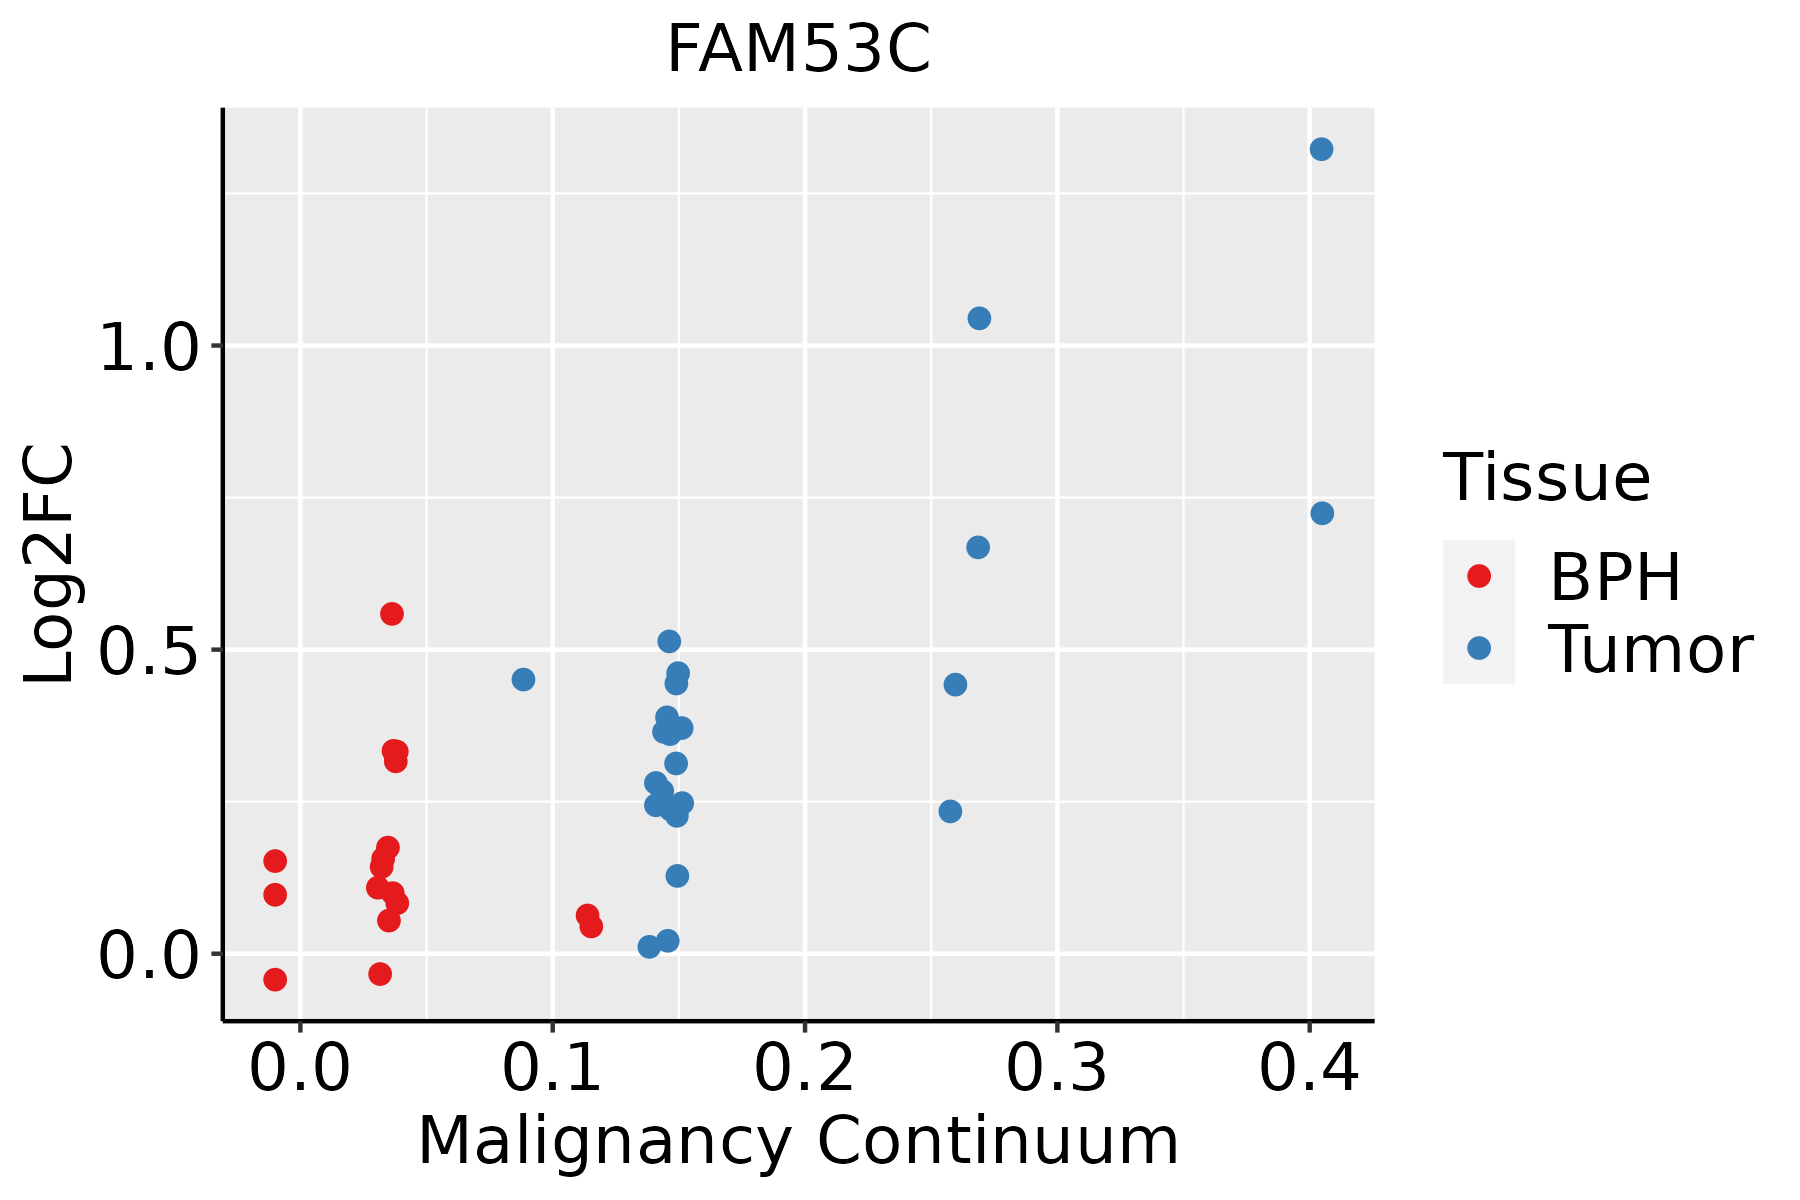 | BPH: Benign Prostatic Hyperplasia |
| Skin |  | AK: Actinic keratosis |
| cSCC: Cutaneous squamous cell carcinoma | ||
| SCCIS:squamous cell carcinoma in situ | ||
| Thyroid | 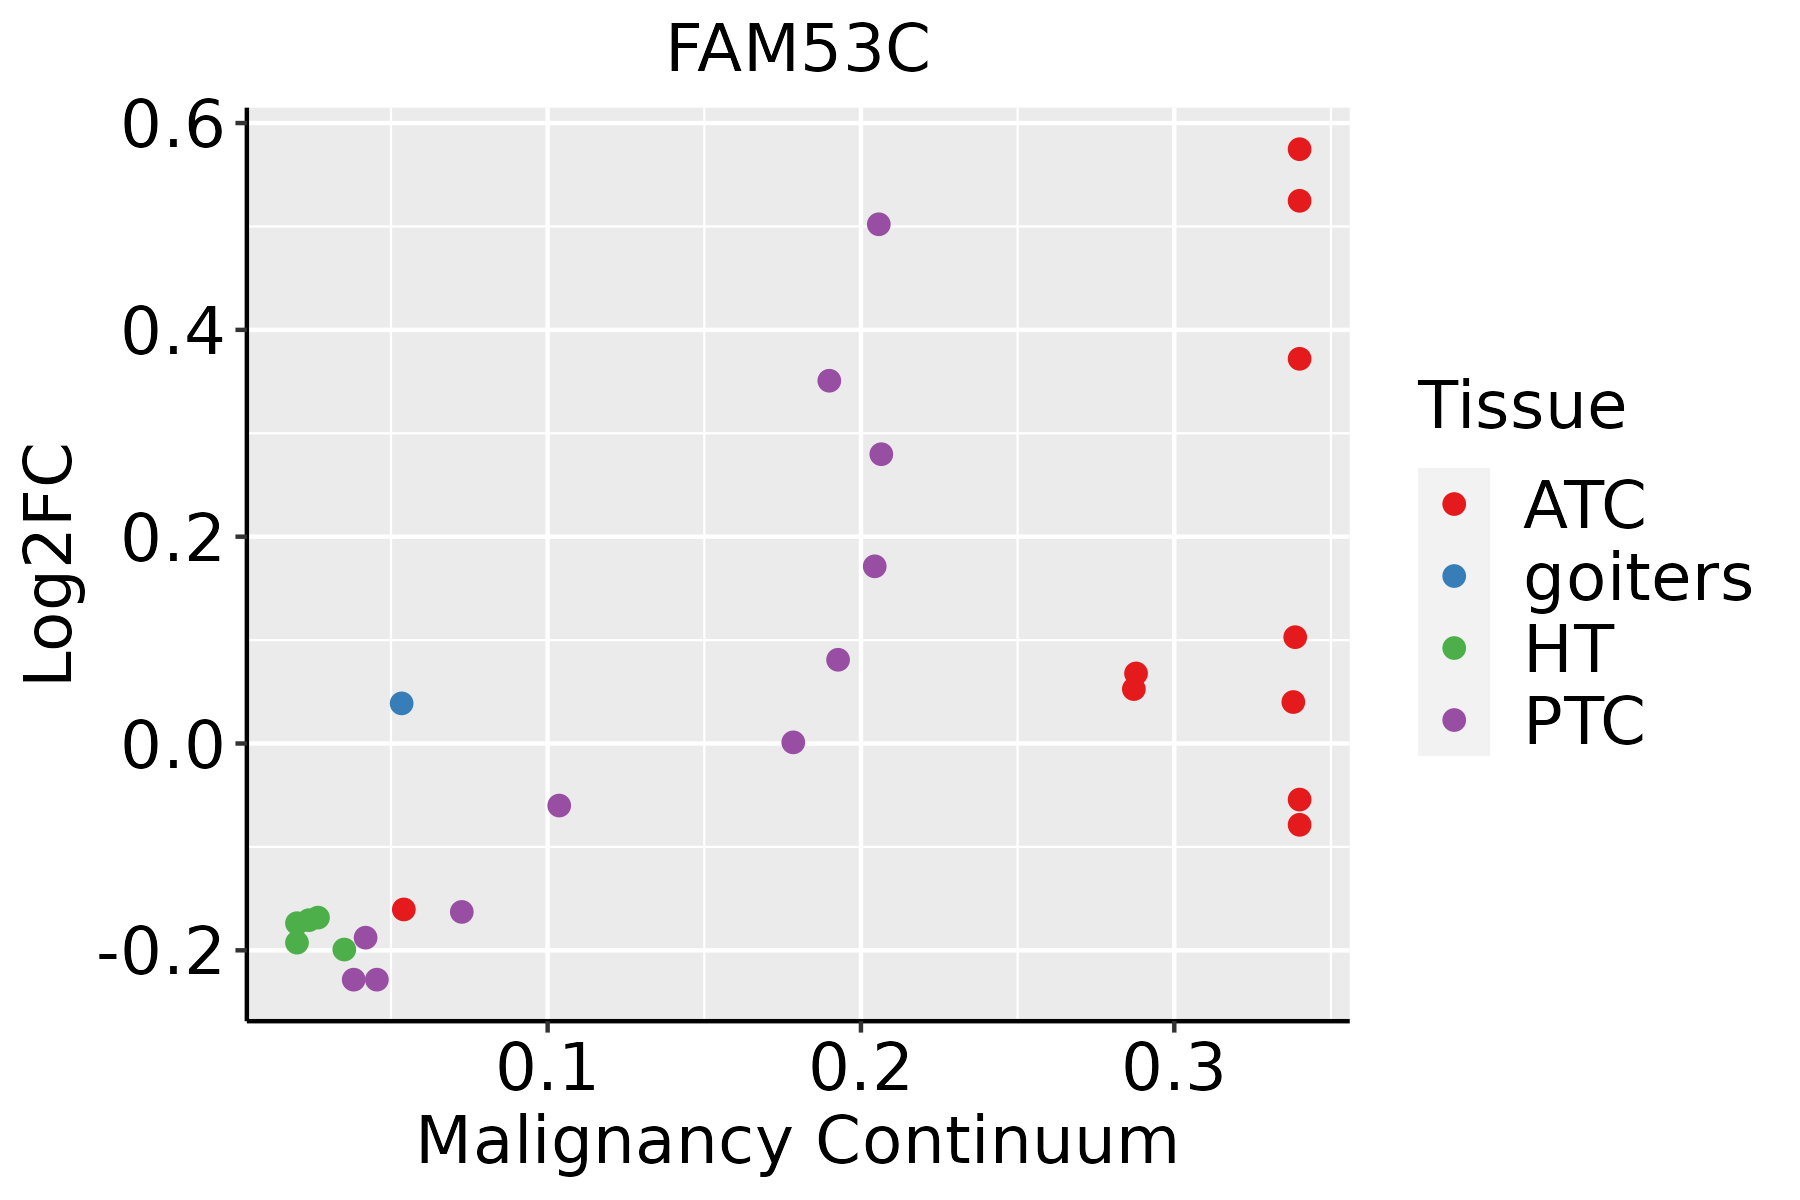 | ATC: Anaplastic thyroid cancer |
| HT: Hashimoto's thyroiditis | ||
| PTC: Papillary thyroid cancer |
| ∗log2FC in expression of this searched gene in stem-like cells from each diseased tissue sample relative to stem-like cells in normal samples in each tissue plotted against the malignancy continuum. Samples are colored based on if they are from different disease stage. |
Top |
Malignant transformation related pathway analysis |
| Find out the enriched GO biological processes and KEGG pathways involved in transition from healthy to precancer to cancer |
| Tissue | Disease Stage | Enriched GO biological Processes |
| Colorectum | AD |  |
| Colorectum | SER |  |
| Colorectum | MSS |  |
| Colorectum | MSI-H |  |
| Colorectum | FAP |  |
| ∗Top 15 enriched GO BP terms are showed in the bar plot of each disease state in each tissue. Each row represents a significant GO biological process which is colored according to the -log10(p.adjust). |
| Page: 1 2 3 4 5 6 7 8 9 |
| GO ID | Tissue | Disease Stage | Description | Gene Ratio | Bg Ratio | pvalue | p.adjust | Count |
| GO:0072594110 | Esophagus | ESCC | establishment of protein localization to organelle | 311/8552 | 422/18723 | 3.02e-32 | 2.13e-29 | 311 |
| GO:0006913110 | Esophagus | ESCC | nucleocytoplasmic transport | 230/8552 | 301/18723 | 6.04e-28 | 2.02e-25 | 230 |
| GO:0051169110 | Esophagus | ESCC | nuclear transport | 230/8552 | 301/18723 | 6.04e-28 | 2.02e-25 | 230 |
| GO:003450418 | Esophagus | ESCC | protein localization to nucleus | 211/8552 | 290/18723 | 4.06e-21 | 6.60e-19 | 211 |
| GO:001703818 | Esophagus | ESCC | protein import | 149/8552 | 206/18723 | 5.90e-15 | 3.31e-13 | 149 |
| GO:005117014 | Esophagus | ESCC | import into nucleus | 111/8552 | 159/18723 | 5.69e-10 | 1.44e-08 | 111 |
| GO:000660613 | Esophagus | ESCC | protein import into nucleus | 108/8552 | 155/18723 | 1.16e-09 | 2.77e-08 | 108 |
| GO:007259412 | Liver | Cirrhotic | establishment of protein localization to organelle | 189/4634 | 422/18723 | 1.01e-19 | 2.45e-17 | 189 |
| GO:000691312 | Liver | Cirrhotic | nucleocytoplasmic transport | 118/4634 | 301/18723 | 1.71e-08 | 6.27e-07 | 118 |
| GO:005116912 | Liver | Cirrhotic | nuclear transport | 118/4634 | 301/18723 | 1.71e-08 | 6.27e-07 | 118 |
| GO:003450411 | Liver | Cirrhotic | protein localization to nucleus | 113/4634 | 290/18723 | 5.00e-08 | 1.58e-06 | 113 |
| GO:00170387 | Liver | Cirrhotic | protein import | 77/4634 | 206/18723 | 3.56e-05 | 4.32e-04 | 77 |
| GO:00511706 | Liver | Cirrhotic | import into nucleus | 54/4634 | 159/18723 | 5.59e-03 | 2.83e-02 | 54 |
| GO:007259422 | Liver | HCC | establishment of protein localization to organelle | 299/7958 | 422/18723 | 1.06e-32 | 6.10e-30 | 299 |
| GO:000691322 | Liver | HCC | nucleocytoplasmic transport | 208/7958 | 301/18723 | 5.51e-21 | 8.12e-19 | 208 |
| GO:005116922 | Liver | HCC | nuclear transport | 208/7958 | 301/18723 | 5.51e-21 | 8.12e-19 | 208 |
| GO:003450421 | Liver | HCC | protein localization to nucleus | 194/7958 | 290/18723 | 2.84e-17 | 2.85e-15 | 194 |
| GO:001703811 | Liver | HCC | protein import | 140/7958 | 206/18723 | 1.12e-13 | 6.46e-12 | 140 |
| GO:005117011 | Liver | HCC | import into nucleus | 102/7958 | 159/18723 | 2.78e-08 | 6.39e-07 | 102 |
| GO:00066066 | Liver | HCC | protein import into nucleus | 99/7958 | 155/18723 | 6.12e-08 | 1.28e-06 | 99 |
| Page: 1 2 3 4 |
| Pathway ID | Tissue | Disease Stage | Description | Gene Ratio | Bg Ratio | pvalue | p.adjust | qvalue | Count |
| Page: 1 |
Top |
Cell-cell communication analysis |
| Identification of potential cell-cell interactions between two cell types and their ligand-receptor pairs for different disease states |
| Ligand | Receptor | LRpair | Pathway | Tissue | Disease Stage |
| Page: 1 |
Top |
Single-cell gene regulatory network inference analysis |
| Find out the significant the regulons (TFs) and the target genes of each regulon across cell types for different disease states |
| TF | Cell Type | Tissue | Disease Stage | Target Gene | RSS | Regulon Activity |
| ∗The dot plots of a searched regulon are shown for all cell subpopulations in each disease state of each tissue based on the regulon specific score inferred using pySCENIC and by calculating the average expression. |
| Page: 1 |
Top |
Somatic mutation of malignant transformation related genes |
| Annotation of somatic variants for genes involved in malignant transformation |
| Hugo Symbol | Variant Class | Variant Classification | dbSNP RS | HGVSc | HGVSp | HGVSp Short | SWISSPROT | BIOTYPE | SIFT | PolyPhen | Tumor Sample Barcode | Tissue | Histology | Sex | Age | Stage | Therapy Types | Drugs | Outcome |
| FAM53C | SNV | Missense_Mutation | c.264N>T | p.Lys88Asn | p.K88N | Q9NYF3 | protein_coding | tolerated(0.49) | benign(0) | TCGA-E9-A229-01 | Breast | breast invasive carcinoma | Female | <65 | I/II | Chemotherapy | 5-fluorouracil | SD | |
| FAM53C | SNV | Missense_Mutation | rs771002511 | c.107N>G | p.Asn36Ser | p.N36S | Q9NYF3 | protein_coding | tolerated(0.6) | benign(0) | TCGA-E9-A6HE-01 | Breast | breast invasive carcinoma | Female | <65 | III/IV | Chemotherapy | adriamycin | CR |
| FAM53C | SNV | Missense_Mutation | c.829N>A | p.Asp277Asn | p.D277N | Q9NYF3 | protein_coding | tolerated(0.47) | probably_damaging(0.996) | TCGA-GM-A2D9-01 | Breast | breast invasive carcinoma | Female | >=65 | I/II | Hormone Therapy | arimidex | SD | |
| FAM53C | insertion | In_Frame_Ins | novel | c.705_706insTTTGGTCTTTTG | p.Pro235_Ser236insPheGlyLeuLeu | p.P235_S236insFGLL | Q9NYF3 | protein_coding | TCGA-BH-A0BD-01 | Breast | breast invasive carcinoma | Female | <65 | I/II | Chemotherapy | doxorubicin | SD | ||
| FAM53C | SNV | Missense_Mutation | rs777338677 | c.1093N>T | p.Arg365Trp | p.R365W | Q9NYF3 | protein_coding | deleterious(0) | possibly_damaging(0.898) | TCGA-A6-5665-01 | Colorectum | colon adenocarcinoma | Female | >=65 | I/II | Unknown | Unknown | PD |
| FAM53C | SNV | Missense_Mutation | c.915G>A | p.Met305Ile | p.M305I | Q9NYF3 | protein_coding | deleterious(0) | probably_damaging(0.969) | TCGA-CK-4951-01 | Colorectum | colon adenocarcinoma | Female | >=65 | I/II | Unknown | Unknown | PD | |
| FAM53C | SNV | Missense_Mutation | rs750874638 | c.841C>T | p.Arg281Cys | p.R281C | Q9NYF3 | protein_coding | deleterious(0) | probably_damaging(0.976) | TCGA-G4-6322-01 | Colorectum | colon adenocarcinoma | Male | >=65 | III/IV | Chemotherapy | oxaliplatin | PD |
| FAM53C | SNV | Missense_Mutation | c.146C>T | p.Ser49Phe | p.S49F | Q9NYF3 | protein_coding | deleterious(0.04) | benign(0.308) | TCGA-AG-A002-01 | Colorectum | rectum adenocarcinoma | Male | <65 | I/II | Unknown | Unknown | SD | |
| FAM53C | SNV | Missense_Mutation | c.921G>T | p.Gln307His | p.Q307H | Q9NYF3 | protein_coding | deleterious(0.01) | probably_damaging(0.996) | TCGA-AG-A002-01 | Colorectum | rectum adenocarcinoma | Male | <65 | I/II | Unknown | Unknown | SD | |
| FAM53C | insertion | Frame_Shift_Ins | novel | c.159_160insC | p.His55ProfsTer6 | p.H55Pfs*6 | Q9NYF3 | protein_coding | TCGA-A6-5665-01 | Colorectum | colon adenocarcinoma | Female | >=65 | I/II | Unknown | Unknown | PD |
| Page: 1 2 3 4 |
Top |
Related drugs of malignant transformation related genes |
| Identification of chemicals and drugs interact with genes involved in malignant transfromation |
| (DGIdb 4.0) |
| Entrez ID | Symbol | Category | Interaction Types | Drug Claim Name | Drug Name | PMIDs |
| Page: 1 |

Copyright 2023-Present -The University of Texas Health Science Center at Houston |