
|
|||||
|
 | |
| |
| |
| |
| |
| |
|
Gene: FAM50A |
Gene summary for FAM50A |
| Gene information | Species | Human | Gene symbol | FAM50A | Gene ID | 9130 |
| Gene name | family with sequence similarity 50 member A | |
| Gene Alias | 9F | |
| Cytomap | Xq28 | |
| Gene Type | protein-coding | GO ID | GO:0000003 | UniProtAcc | Q14320 |
Top |
Malignant transformation analysis |
| Identification of the aberrant gene expression in precancerous and cancerous lesions by comparing the gene expression of stem-like cells in diseased tissues with normal stem cells |
| Entrez ID | Symbol | Replicates | Species | Organ | Tissue | Adj P-value | Log2FC | Malignancy |
| 9130 | FAM50A | LZE5T | Human | Esophagus | ESCC | 3.17e-03 | 4.92e-01 | 0.0514 |
| 9130 | FAM50A | LZE7T | Human | Esophagus | ESCC | 5.49e-11 | 5.22e-01 | 0.0667 |
| 9130 | FAM50A | LZE20T | Human | Esophagus | ESCC | 2.72e-09 | 5.32e-01 | 0.0662 |
| 9130 | FAM50A | LZE22T | Human | Esophagus | ESCC | 1.35e-06 | 6.67e-01 | 0.068 |
| 9130 | FAM50A | LZE24T | Human | Esophagus | ESCC | 1.06e-28 | 9.50e-01 | 0.0596 |
| 9130 | FAM50A | LZE21T | Human | Esophagus | ESCC | 7.59e-04 | 5.70e-01 | 0.0655 |
| 9130 | FAM50A | P1T-E | Human | Esophagus | ESCC | 3.40e-30 | 1.47e+00 | 0.0875 |
| 9130 | FAM50A | P2T-E | Human | Esophagus | ESCC | 1.28e-27 | 4.60e-01 | 0.1177 |
| 9130 | FAM50A | P4T-E | Human | Esophagus | ESCC | 6.32e-29 | 7.46e-01 | 0.1323 |
| 9130 | FAM50A | P5T-E | Human | Esophagus | ESCC | 2.75e-47 | 9.30e-01 | 0.1327 |
| 9130 | FAM50A | P8T-E | Human | Esophagus | ESCC | 1.29e-42 | 8.15e-01 | 0.0889 |
| 9130 | FAM50A | P9T-E | Human | Esophagus | ESCC | 5.31e-35 | 8.01e-01 | 0.1131 |
| 9130 | FAM50A | P10T-E | Human | Esophagus | ESCC | 6.01e-45 | 8.37e-01 | 0.116 |
| 9130 | FAM50A | P11T-E | Human | Esophagus | ESCC | 6.22e-32 | 1.06e+00 | 0.1426 |
| 9130 | FAM50A | P12T-E | Human | Esophagus | ESCC | 7.96e-60 | 1.00e+00 | 0.1122 |
| 9130 | FAM50A | P15T-E | Human | Esophagus | ESCC | 5.76e-39 | 7.05e-01 | 0.1149 |
| 9130 | FAM50A | P16T-E | Human | Esophagus | ESCC | 4.55e-18 | 3.97e-01 | 0.1153 |
| 9130 | FAM50A | P17T-E | Human | Esophagus | ESCC | 6.77e-20 | 9.21e-01 | 0.1278 |
| 9130 | FAM50A | P19T-E | Human | Esophagus | ESCC | 2.91e-26 | 1.74e+00 | 0.1662 |
| 9130 | FAM50A | P20T-E | Human | Esophagus | ESCC | 1.48e-11 | 5.01e-01 | 0.1124 |
| Page: 1 2 3 4 5 6 |
| Tissue | Expression Dynamics | Abbreviation |
| Esophagus | 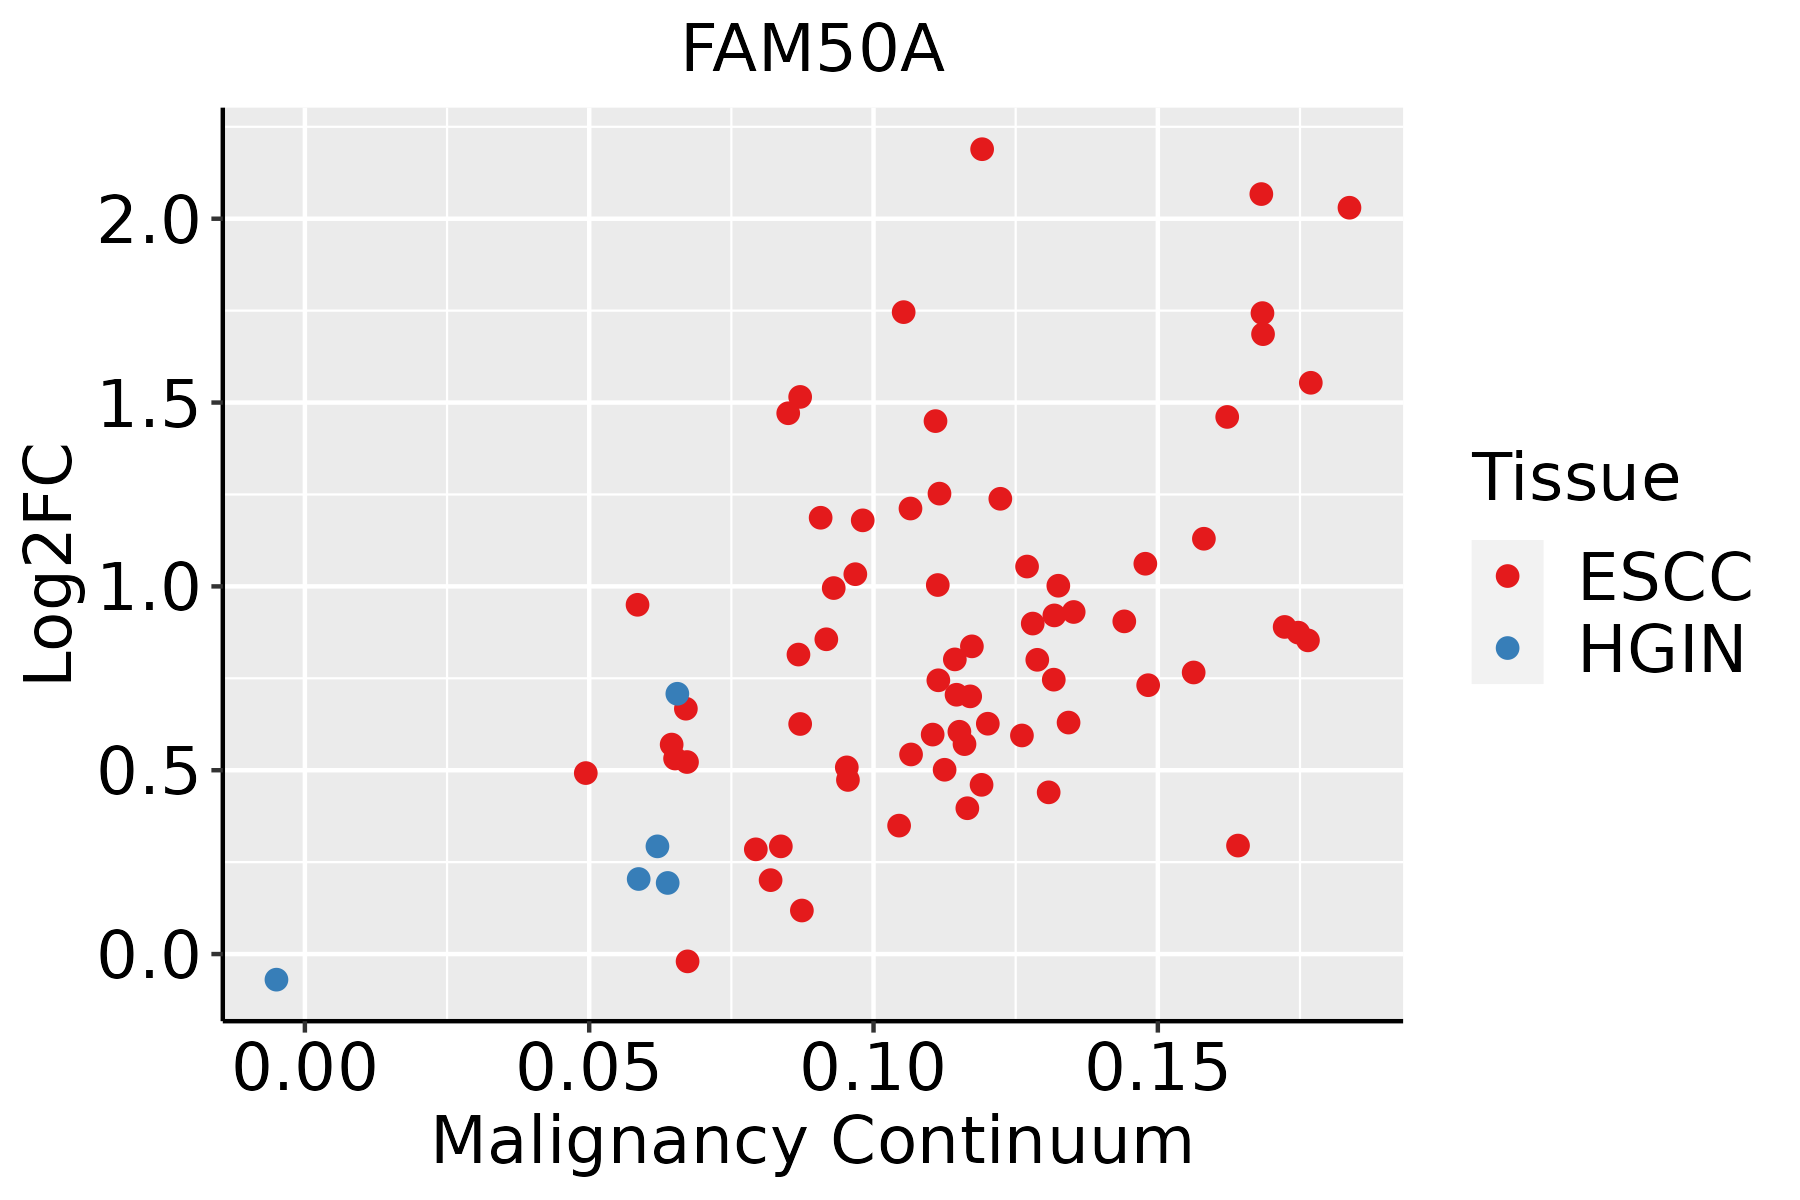 | ESCC: Esophageal squamous cell carcinoma |
| HGIN: High-grade intraepithelial neoplasias | ||
| LGIN: Low-grade intraepithelial neoplasias | ||
| Liver | 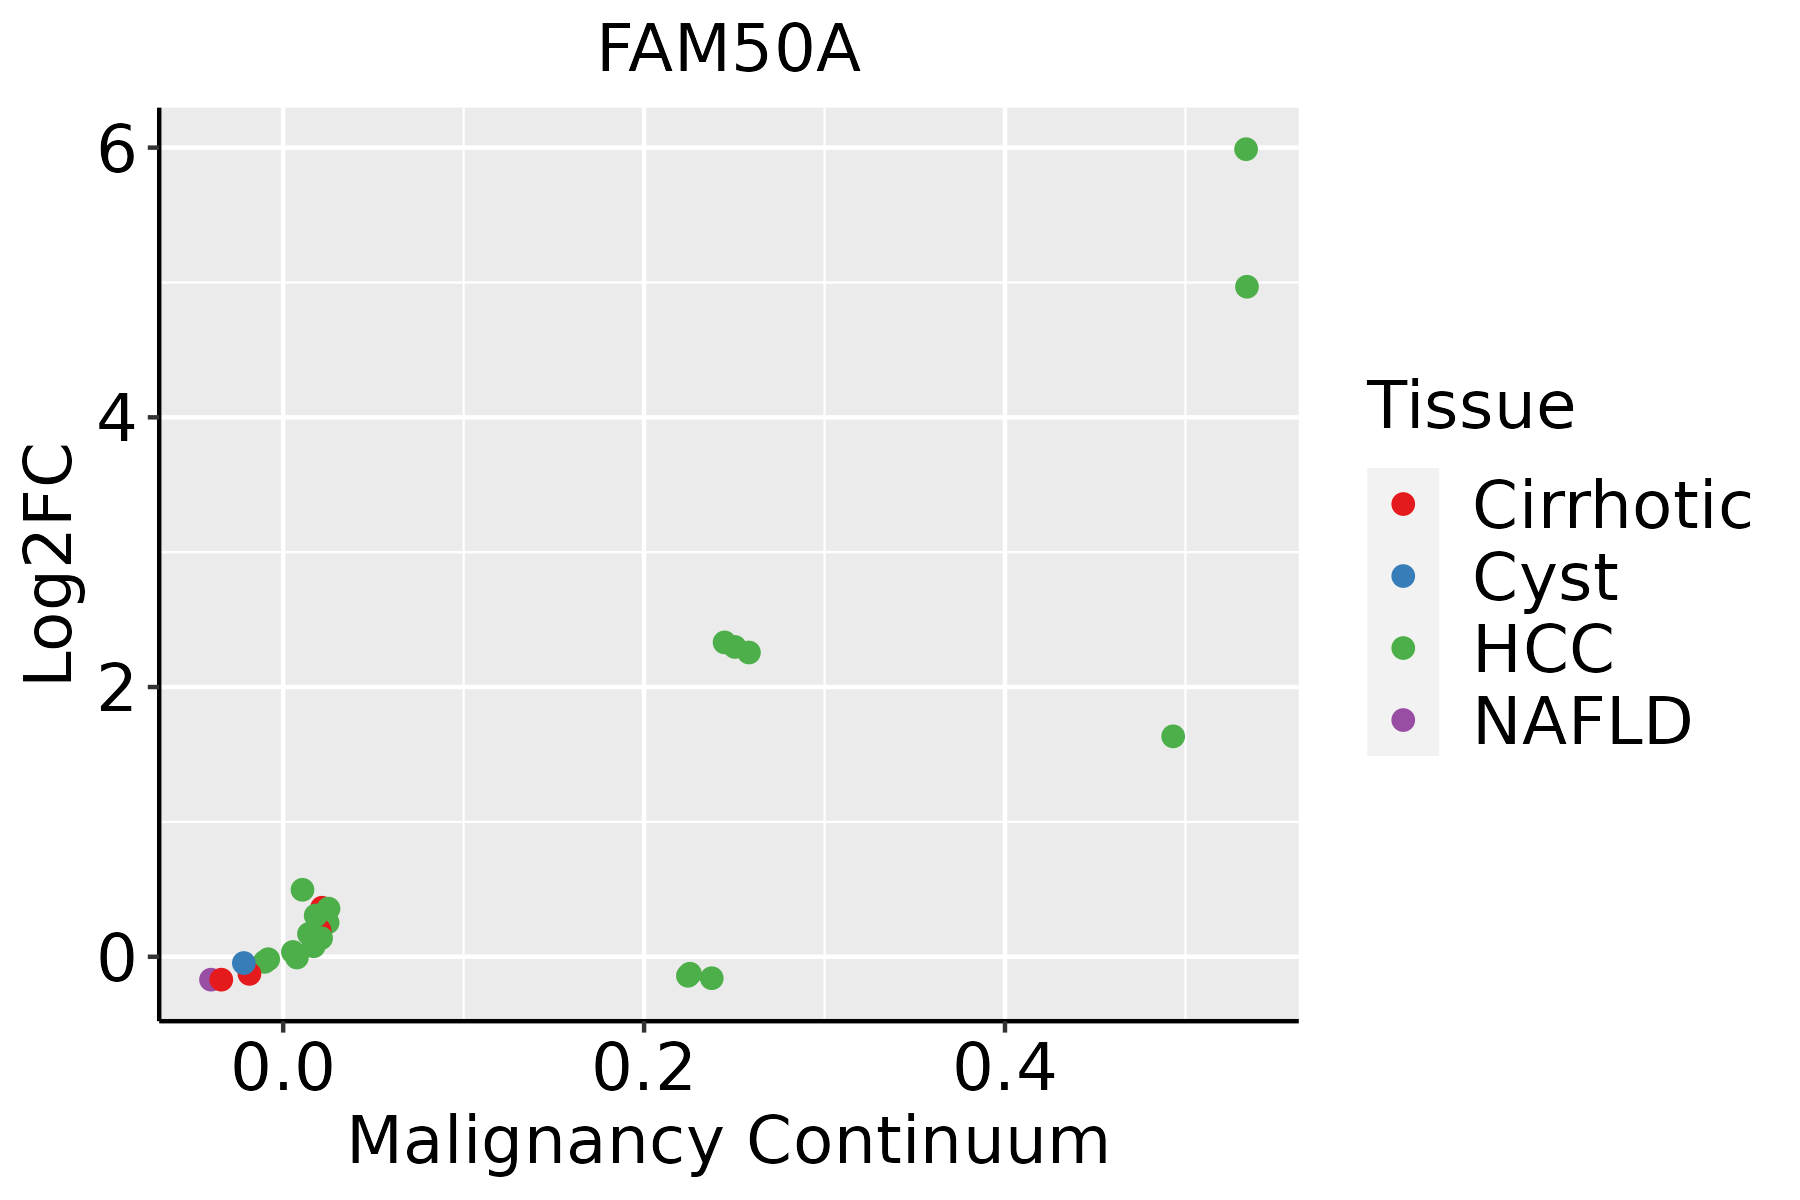 | HCC: Hepatocellular carcinoma |
| NAFLD: Non-alcoholic fatty liver disease | ||
| Oral Cavity |  | EOLP: Erosive Oral lichen planus |
| LP: leukoplakia | ||
| NEOLP: Non-erosive oral lichen planus | ||
| OSCC: Oral squamous cell carcinoma | ||
| Prostate | 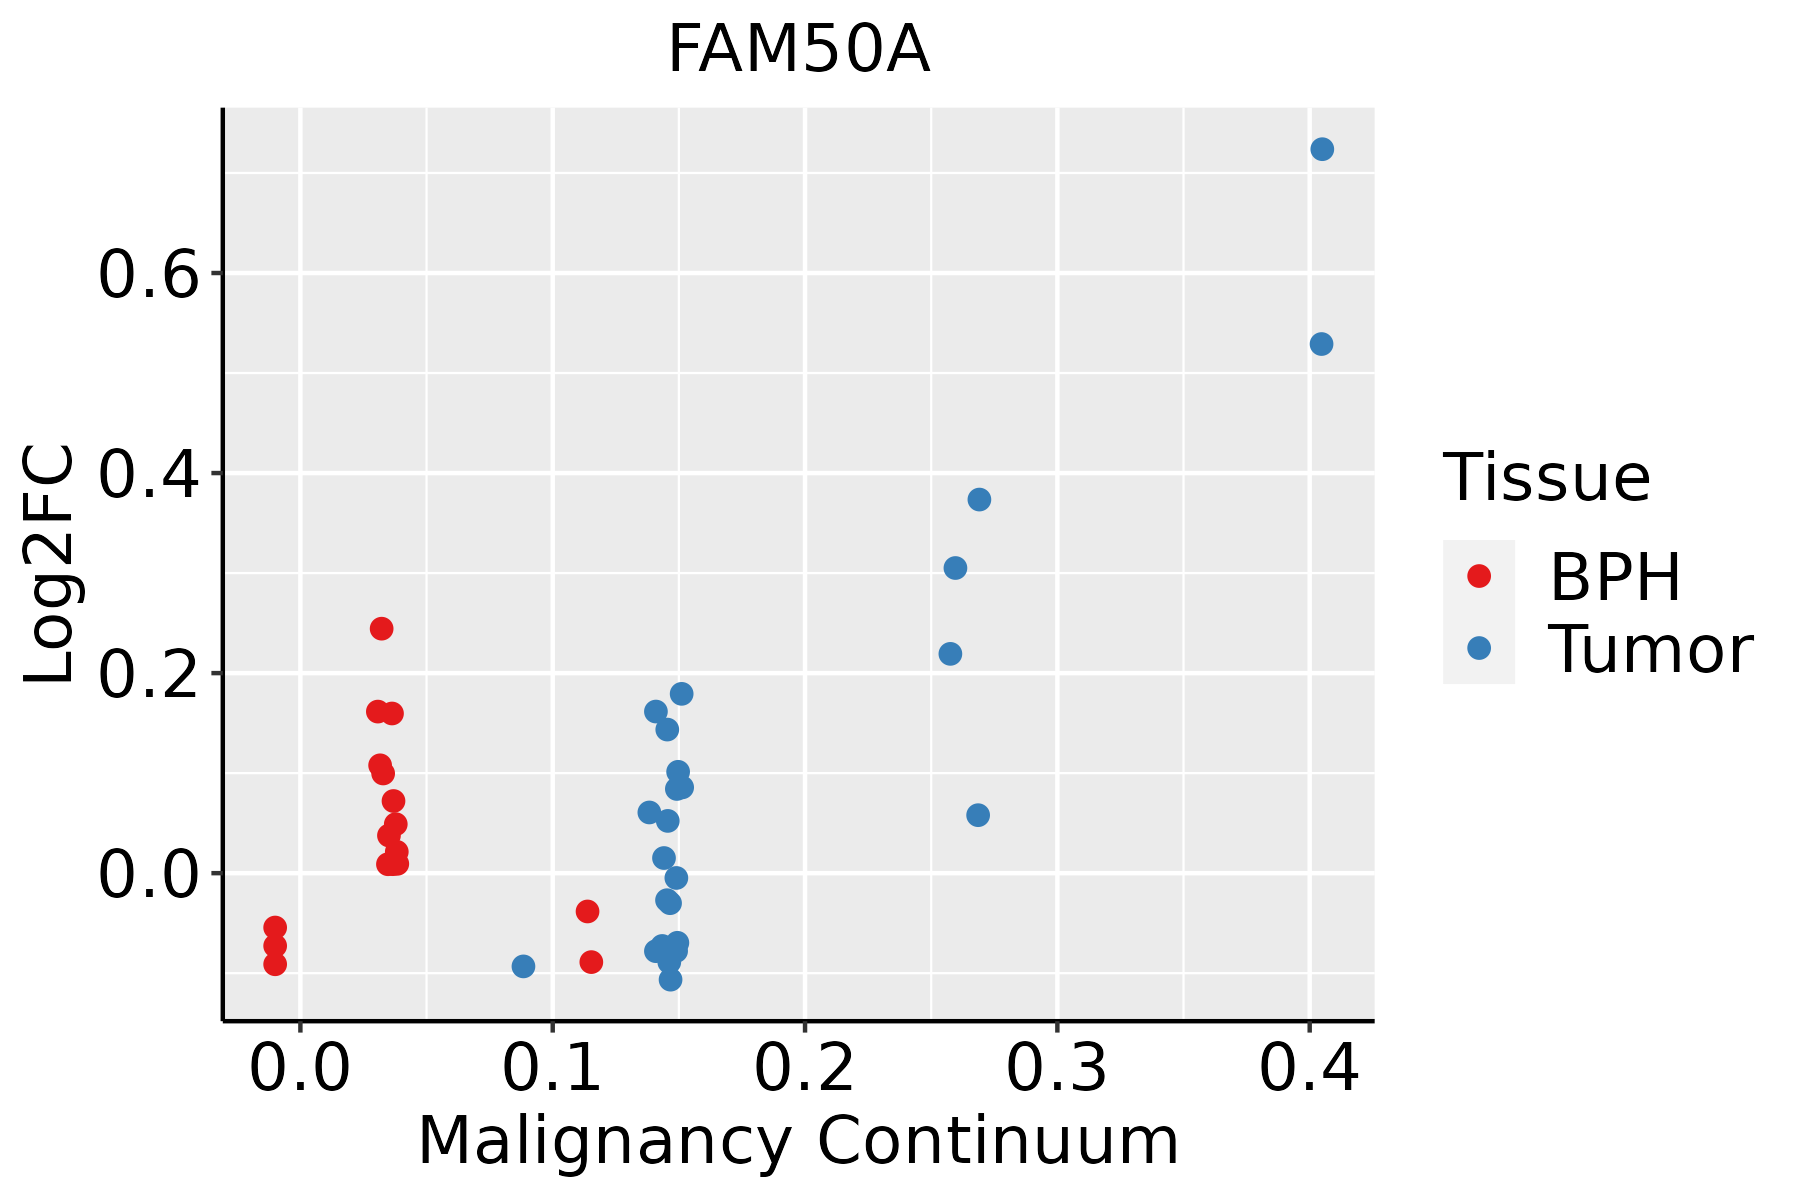 | BPH: Benign Prostatic Hyperplasia |
| Skin | 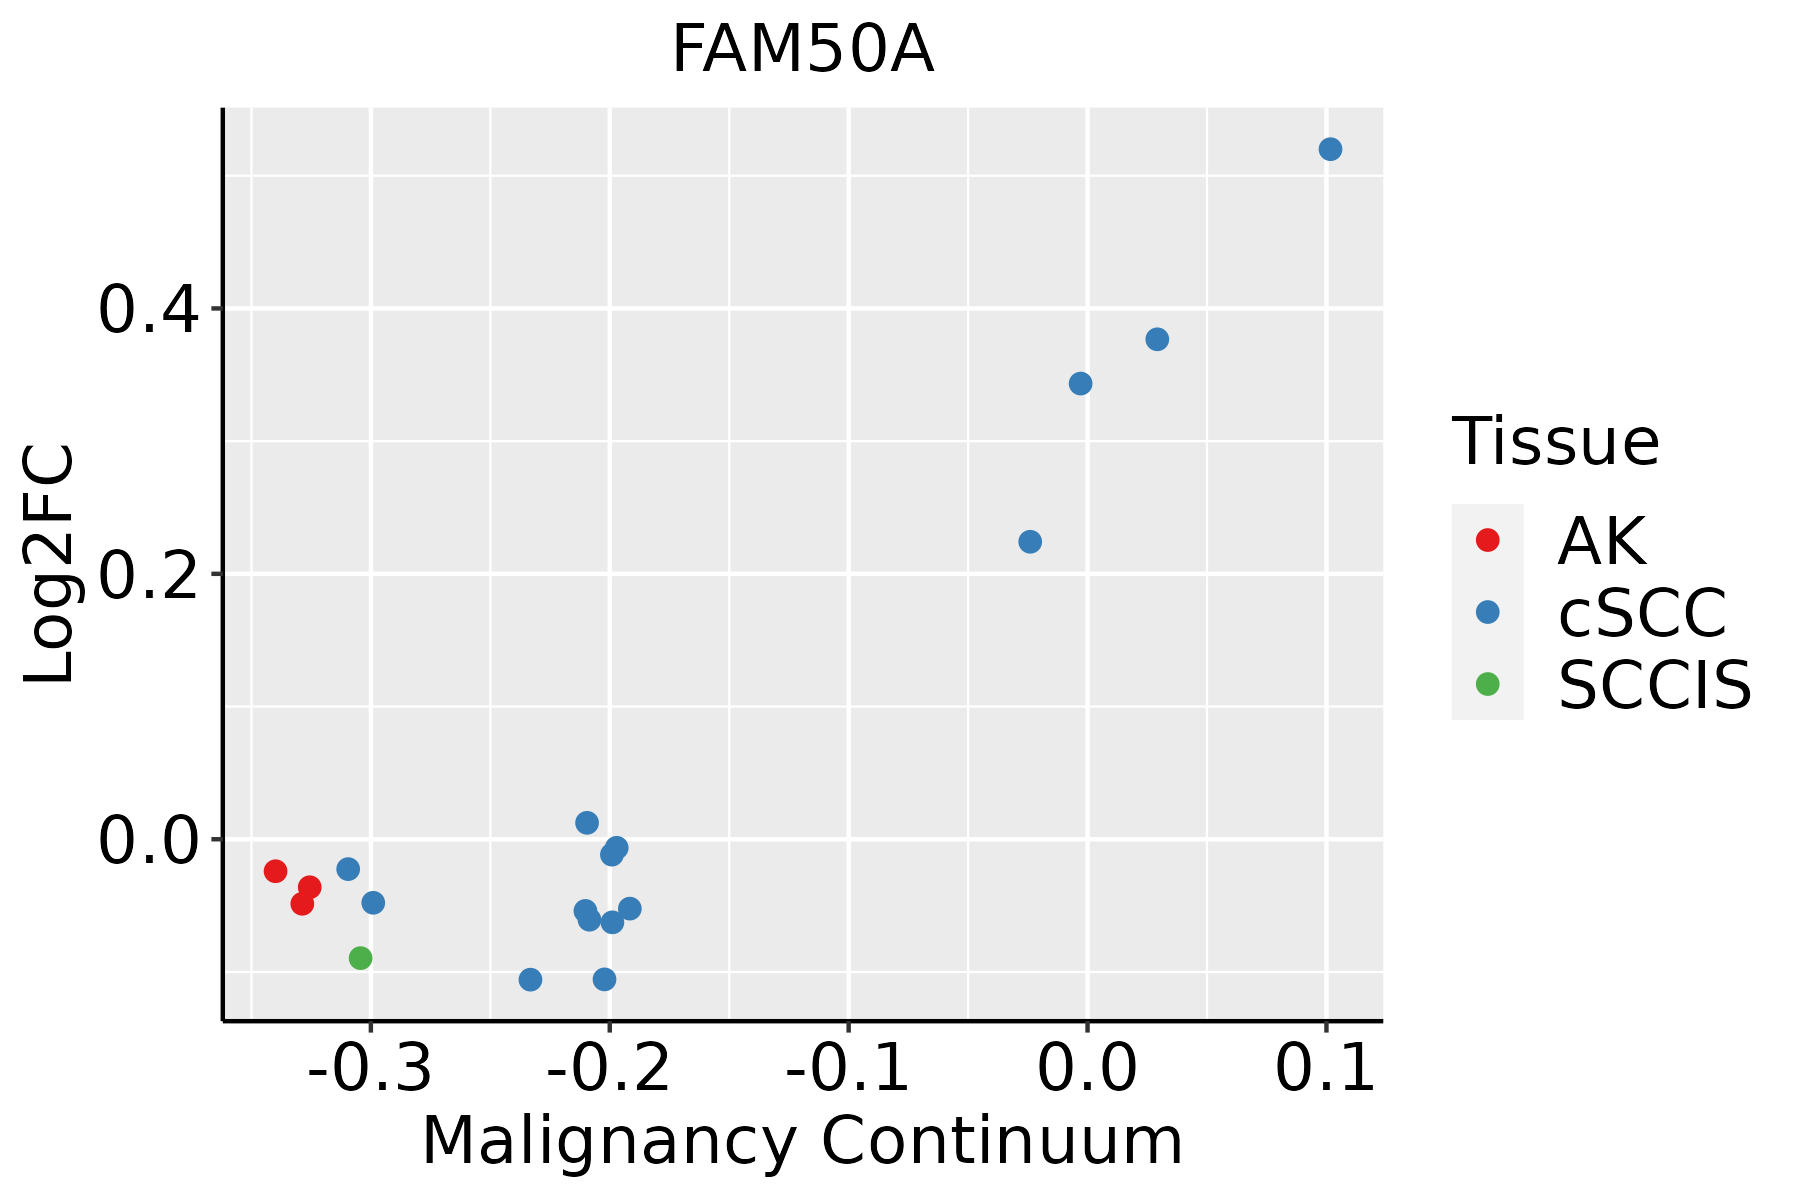 | AK: Actinic keratosis |
| cSCC: Cutaneous squamous cell carcinoma | ||
| SCCIS:squamous cell carcinoma in situ | ||
| Thyroid | 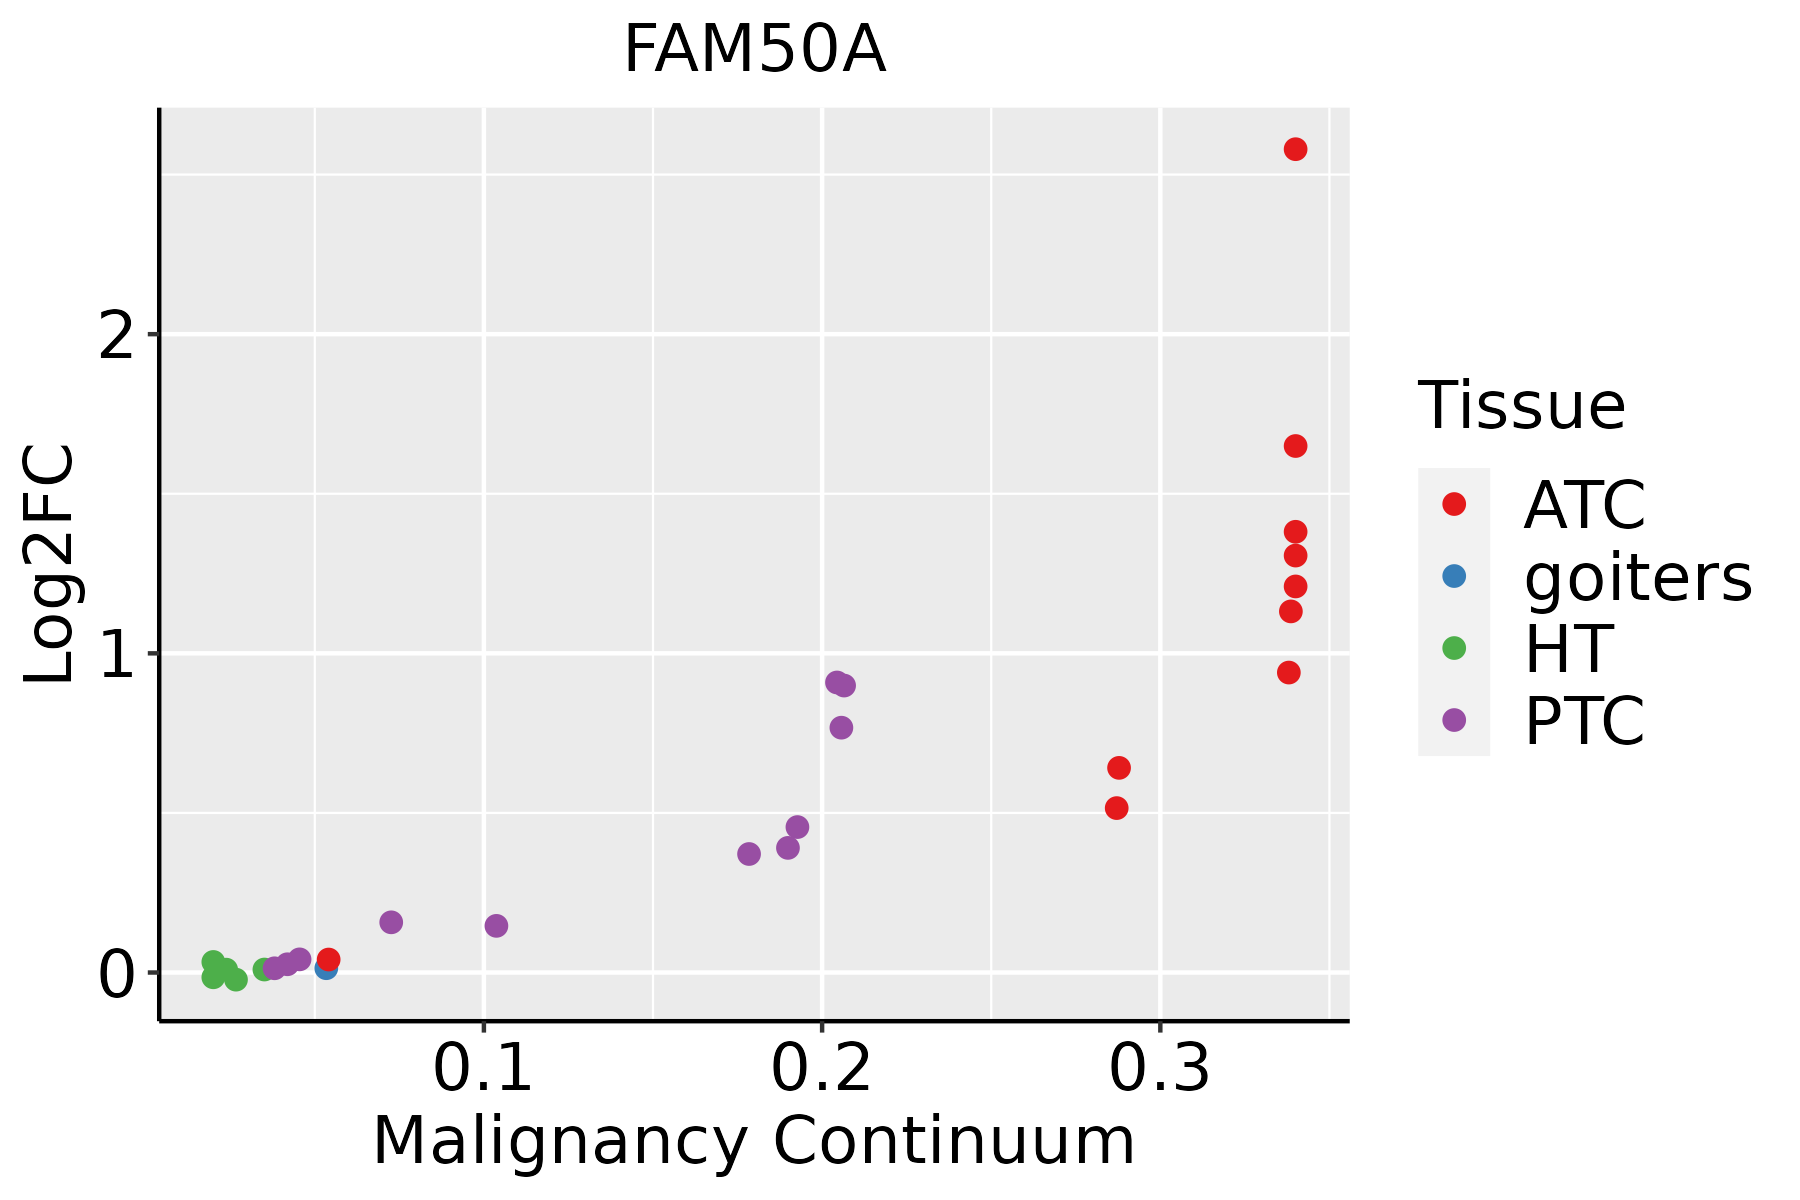 | ATC: Anaplastic thyroid cancer |
| HT: Hashimoto's thyroiditis | ||
| PTC: Papillary thyroid cancer |
| ∗log2FC in expression of this searched gene in stem-like cells from each diseased tissue sample relative to stem-like cells in normal samples in each tissue plotted against the malignancy continuum. Samples are colored based on if they are from different disease stage. |
Top |
Malignant transformation related pathway analysis |
| Find out the enriched GO biological processes and KEGG pathways involved in transition from healthy to precancer to cancer |
| Tissue | Disease Stage | Enriched GO biological Processes |
| Colorectum | AD |  |
| Colorectum | SER |  |
| Colorectum | MSS |  |
| Colorectum | MSI-H |  |
| Colorectum | FAP |  |
| ∗Top 15 enriched GO BP terms are showed in the bar plot of each disease state in each tissue. Each row represents a significant GO biological process which is colored according to the -log10(p.adjust). |
| Page: 1 2 3 4 5 6 7 8 9 |
| GO ID | Tissue | Disease Stage | Description | Gene Ratio | Bg Ratio | pvalue | p.adjust | Count |
| GO:0008380111 | Esophagus | ESCC | RNA splicing | 336/8552 | 434/18723 | 1.74e-42 | 3.67e-39 | 336 |
| GO:0043484111 | Esophagus | ESCC | regulation of RNA splicing | 116/8552 | 148/18723 | 3.18e-16 | 2.38e-14 | 116 |
| GO:000632517 | Esophagus | ESCC | chromatin organization | 240/8552 | 409/18723 | 6.52e-08 | 1.14e-06 | 240 |
| GO:000838012 | Liver | Cirrhotic | RNA splicing | 229/4634 | 434/18723 | 9.13e-37 | 2.86e-33 | 229 |
| GO:004348412 | Liver | Cirrhotic | regulation of RNA splicing | 85/4634 | 148/18723 | 2.03e-17 | 2.83e-15 | 85 |
| GO:000838022 | Liver | HCC | RNA splicing | 313/7958 | 434/18723 | 1.36e-36 | 1.73e-33 | 313 |
| GO:004348422 | Liver | HCC | regulation of RNA splicing | 113/7958 | 148/18723 | 4.32e-17 | 4.15e-15 | 113 |
| GO:000632511 | Liver | HCC | chromatin organization | 206/7958 | 409/18723 | 7.23e-04 | 4.41e-03 | 206 |
| GO:000838020 | Oral cavity | OSCC | RNA splicing | 308/7305 | 434/18723 | 2.43e-42 | 7.70e-39 | 308 |
| GO:004348420 | Oral cavity | OSCC | regulation of RNA splicing | 108/7305 | 148/18723 | 4.25e-17 | 3.69e-15 | 108 |
| GO:000632510 | Oral cavity | OSCC | chromatin organization | 190/7305 | 409/18723 | 1.17e-03 | 5.97e-03 | 190 |
| GO:000838018 | Prostate | BPH | RNA splicing | 147/3107 | 434/18723 | 5.17e-19 | 2.29e-16 | 147 |
| GO:004348418 | Prostate | BPH | regulation of RNA splicing | 71/3107 | 148/18723 | 6.14e-19 | 2.53e-16 | 71 |
| GO:00063259 | Prostate | BPH | chromatin organization | 101/3107 | 409/18723 | 1.52e-05 | 1.94e-04 | 101 |
| GO:000838019 | Prostate | Tumor | RNA splicing | 153/3246 | 434/18723 | 9.15e-20 | 5.79e-17 | 153 |
| GO:004348419 | Prostate | Tumor | regulation of RNA splicing | 70/3246 | 148/18723 | 3.22e-17 | 1.05e-14 | 70 |
| GO:000632514 | Prostate | Tumor | chromatin organization | 104/3246 | 409/18723 | 2.02e-05 | 2.62e-04 | 104 |
| GO:0008380112 | Skin | cSCC | RNA splicing | 263/4864 | 434/18723 | 2.45e-53 | 5.13e-50 | 263 |
| GO:004348429 | Skin | cSCC | regulation of RNA splicing | 97/4864 | 148/18723 | 4.66e-24 | 1.08e-21 | 97 |
| GO:000632519 | Skin | cSCC | chromatin organization | 147/4864 | 409/18723 | 4.41e-06 | 6.52e-05 | 147 |
| Page: 1 2 |
| Pathway ID | Tissue | Disease Stage | Description | Gene Ratio | Bg Ratio | pvalue | p.adjust | qvalue | Count |
| Page: 1 |
Top |
Cell-cell communication analysis |
| Identification of potential cell-cell interactions between two cell types and their ligand-receptor pairs for different disease states |
| Ligand | Receptor | LRpair | Pathway | Tissue | Disease Stage |
| Page: 1 |
Top |
Single-cell gene regulatory network inference analysis |
| Find out the significant the regulons (TFs) and the target genes of each regulon across cell types for different disease states |
| TF | Cell Type | Tissue | Disease Stage | Target Gene | RSS | Regulon Activity |
| ∗The dot plots of a searched regulon are shown for all cell subpopulations in each disease state of each tissue based on the regulon specific score inferred using pySCENIC and by calculating the average expression. |
| Page: 1 |
Top |
Somatic mutation of malignant transformation related genes |
| Annotation of somatic variants for genes involved in malignant transformation |
| Hugo Symbol | Variant Class | Variant Classification | dbSNP RS | HGVSc | HGVSp | HGVSp Short | SWISSPROT | BIOTYPE | SIFT | PolyPhen | Tumor Sample Barcode | Tissue | Histology | Sex | Age | Stage | Therapy Types | Drugs | Outcome |
| FAM50A | insertion | Frame_Shift_Ins | novel | c.129_130insCCAGCAGGAGACCTGAAGAGCCAGAGCAGCTCAGGGATGGA | p.Asn44ProfsTer39 | p.N44Pfs*39 | Q14320 | protein_coding | TCGA-A8-A08T-01 | Breast | breast invasive carcinoma | Female | <65 | III/IV | Unknown | Unknown | PD | ||
| FAM50A | SNV | Missense_Mutation | c.982G>A | p.Asp328Asn | p.D328N | Q14320 | protein_coding | deleterious(0.05) | benign(0.378) | TCGA-FU-A3HZ-01 | Cervix | cervical & endocervical cancer | Female | <65 | I/II | Chemotherapy | cisplatin | CR | |
| FAM50A | SNV | Missense_Mutation | rs782214551 | c.550N>T | p.Arg184Trp | p.R184W | Q14320 | protein_coding | deleterious(0) | probably_damaging(0.985) | TCGA-CM-6162-01 | Colorectum | colon adenocarcinoma | Female | <65 | III/IV | Chemotherapy | oxaliplatin | SD |
| FAM50A | SNV | Missense_Mutation | rs141522232 | c.509G>A | p.Arg170Gln | p.R170Q | Q14320 | protein_coding | deleterious(0.01) | benign(0.062) | TCGA-F4-6856-01 | Colorectum | colon adenocarcinoma | Male | <65 | I/II | Ancillary | leucovorin | CR |
| FAM50A | SNV | Missense_Mutation | c.818N>A | p.Arg273Gln | p.R273Q | Q14320 | protein_coding | deleterious(0.01) | possibly_damaging(0.81) | TCGA-A5-A0G2-01 | Endometrium | uterine corpus endometrioid carcinoma | Female | <65 | III/IV | Unknown | Unknown | SD | |
| FAM50A | SNV | Missense_Mutation | novel | c.533G>A | p.Arg178Gln | p.R178Q | Q14320 | protein_coding | tolerated(0.08) | possibly_damaging(0.533) | TCGA-A5-A1OF-01 | Endometrium | uterine corpus endometrioid carcinoma | Female | <65 | I/II | Unknown | Unknown | SD |
| FAM50A | SNV | Missense_Mutation | c.866N>A | p.Arg289Gln | p.R289Q | Q14320 | protein_coding | deleterious(0) | probably_damaging(0.999) | TCGA-A5-A7WJ-01 | Endometrium | uterine corpus endometrioid carcinoma | Female | <65 | I/II | Unknown | Unknown | SD | |
| FAM50A | SNV | Missense_Mutation | novel | c.250N>T | p.Arg84Trp | p.R84W | Q14320 | protein_coding | tolerated(0.06) | probably_damaging(0.999) | TCGA-AJ-A3OJ-01 | Endometrium | uterine corpus endometrioid carcinoma | Female | <65 | I/II | Chemotherapy | carboplatin | CR |
| FAM50A | SNV | Missense_Mutation | c.949N>T | p.His317Tyr | p.H317Y | Q14320 | protein_coding | deleterious(0) | probably_damaging(0.999) | TCGA-AP-A059-01 | Endometrium | uterine corpus endometrioid carcinoma | Female | >=65 | I/II | Unknown | Unknown | SD | |
| FAM50A | SNV | Missense_Mutation | rs375558781 | c.638N>A | p.Arg213Gln | p.R213Q | Q14320 | protein_coding | deleterious(0) | benign(0.132) | TCGA-AP-A0LM-01 | Endometrium | uterine corpus endometrioid carcinoma | Female | <65 | III/IV | Chemotherapy | cisplatin | SD |
| Page: 1 2 3 4 |
Top |
Related drugs of malignant transformation related genes |
| Identification of chemicals and drugs interact with genes involved in malignant transfromation |
| (DGIdb 4.0) |
| Entrez ID | Symbol | Category | Interaction Types | Drug Claim Name | Drug Name | PMIDs |
| Page: 1 |

Copyright 2023-Present -The University of Texas Health Science Center at Houston |