
|
|||||
|
 | |
| |
| |
| |
| |
| |
|
Gene: FAM46C |
Gene summary for FAM46C |
| Gene information | Species | Human | Gene symbol | FAM46C | Gene ID | 54855 |
| Gene name | terminal nucleotidyltransferase 5C | |
| Gene Alias | FAM46C | |
| Cytomap | 1p12 | |
| Gene Type | protein-coding | GO ID | GO:0001701 | UniProtAcc | Q5VWP2 |
Top |
Malignant transformation analysis |
| Identification of the aberrant gene expression in precancerous and cancerous lesions by comparing the gene expression of stem-like cells in diseased tissues with normal stem cells |
| Entrez ID | Symbol | Replicates | Species | Organ | Tissue | Adj P-value | Log2FC | Malignancy |
| 54855 | FAM46C | P1T-E | Human | Esophagus | ESCC | 1.59e-02 | 1.70e-01 | 0.0875 |
| 54855 | FAM46C | P2T-E | Human | Esophagus | ESCC | 5.58e-09 | 2.64e-01 | 0.1177 |
| 54855 | FAM46C | P4T-E | Human | Esophagus | ESCC | 7.85e-04 | 1.21e-01 | 0.1323 |
| 54855 | FAM46C | P5T-E | Human | Esophagus | ESCC | 2.90e-03 | -2.10e-02 | 0.1327 |
| 54855 | FAM46C | P8T-E | Human | Esophagus | ESCC | 2.16e-14 | 2.54e-01 | 0.0889 |
| 54855 | FAM46C | P10T-E | Human | Esophagus | ESCC | 2.17e-07 | 1.22e-02 | 0.116 |
| 54855 | FAM46C | P11T-E | Human | Esophagus | ESCC | 5.89e-09 | 5.98e-01 | 0.1426 |
| 54855 | FAM46C | P12T-E | Human | Esophagus | ESCC | 6.02e-07 | 9.88e-02 | 0.1122 |
| 54855 | FAM46C | P15T-E | Human | Esophagus | ESCC | 1.61e-04 | 9.52e-02 | 0.1149 |
| 54855 | FAM46C | P16T-E | Human | Esophagus | ESCC | 3.83e-06 | 2.33e-02 | 0.1153 |
| 54855 | FAM46C | P20T-E | Human | Esophagus | ESCC | 1.27e-04 | 1.60e-01 | 0.1124 |
| 54855 | FAM46C | P21T-E | Human | Esophagus | ESCC | 8.51e-07 | 4.83e-02 | 0.1617 |
| 54855 | FAM46C | P23T-E | Human | Esophagus | ESCC | 6.71e-05 | 1.41e-01 | 0.108 |
| 54855 | FAM46C | P24T-E | Human | Esophagus | ESCC | 2.99e-03 | -2.59e-02 | 0.1287 |
| 54855 | FAM46C | P26T-E | Human | Esophagus | ESCC | 1.13e-07 | 3.82e-02 | 0.1276 |
| 54855 | FAM46C | P27T-E | Human | Esophagus | ESCC | 2.19e-03 | 3.59e-02 | 0.1055 |
| 54855 | FAM46C | P28T-E | Human | Esophagus | ESCC | 2.43e-03 | -1.98e-02 | 0.1149 |
| 54855 | FAM46C | P31T-E | Human | Esophagus | ESCC | 1.72e-11 | 6.05e-02 | 0.1251 |
| 54855 | FAM46C | P32T-E | Human | Esophagus | ESCC | 4.90e-02 | -7.81e-02 | 0.1666 |
| 54855 | FAM46C | P39T-E | Human | Esophagus | ESCC | 4.82e-03 | -1.58e-02 | 0.0894 |
| Page: 1 2 3 4 5 |
| Tissue | Expression Dynamics | Abbreviation |
| Esophagus | 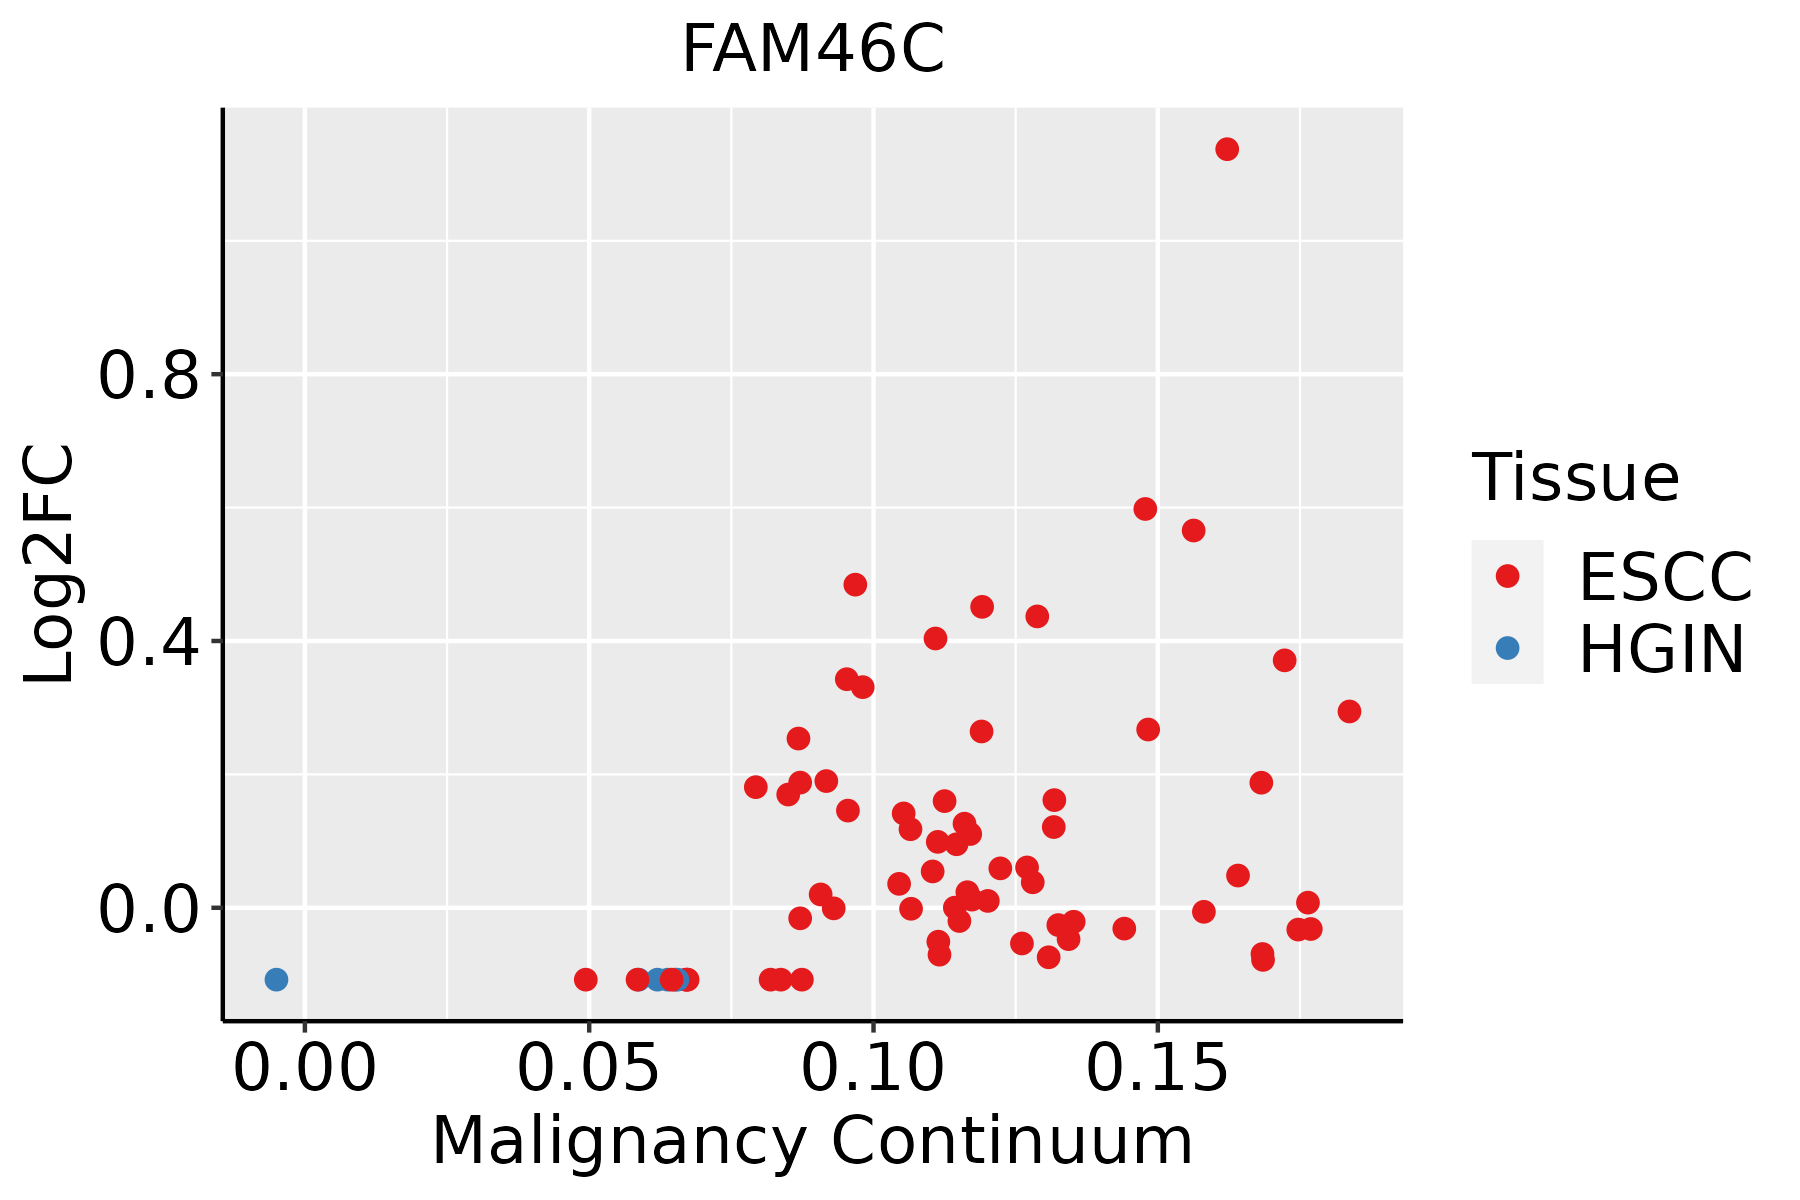 | ESCC: Esophageal squamous cell carcinoma |
| HGIN: High-grade intraepithelial neoplasias | ||
| LGIN: Low-grade intraepithelial neoplasias | ||
| Oral Cavity |  | EOLP: Erosive Oral lichen planus |
| LP: leukoplakia | ||
| NEOLP: Non-erosive oral lichen planus | ||
| OSCC: Oral squamous cell carcinoma | ||
| Prostate | 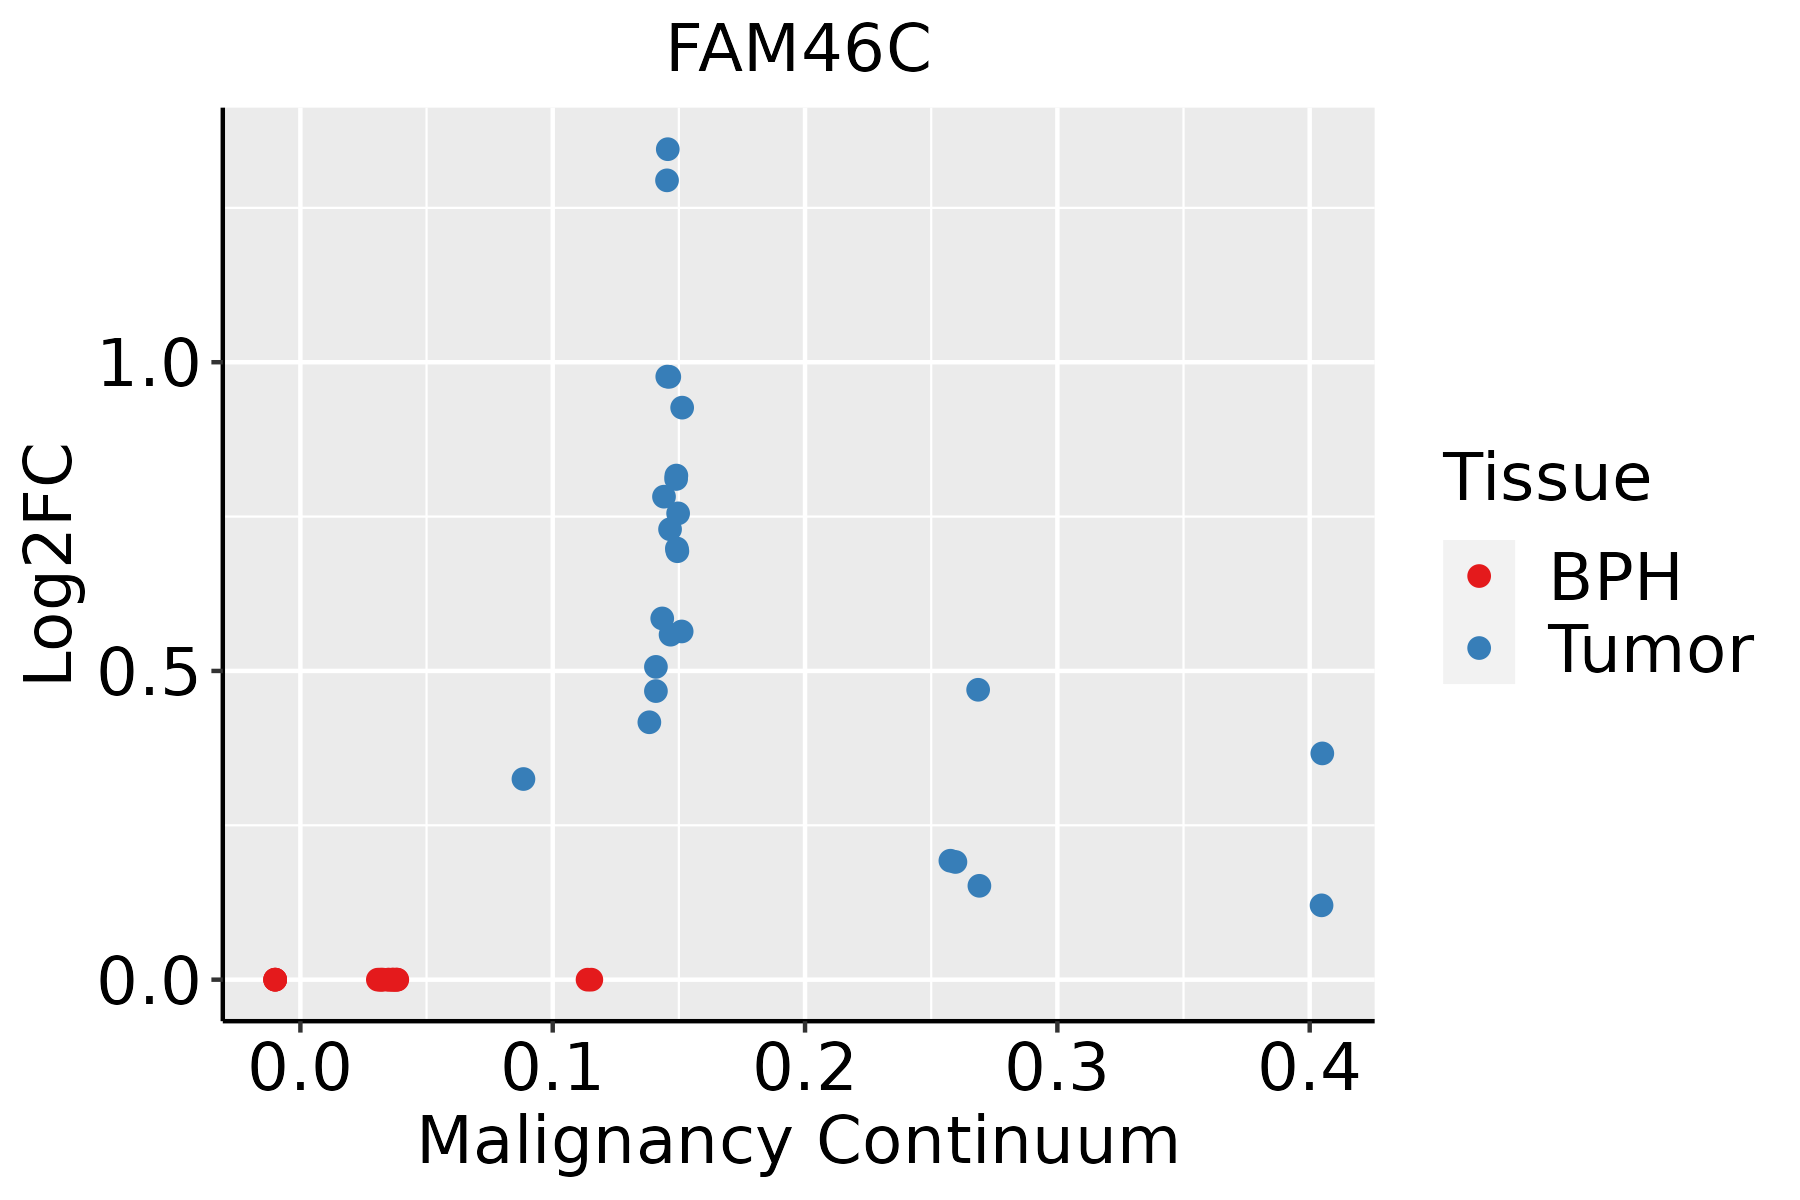 | BPH: Benign Prostatic Hyperplasia |
| Thyroid |  | ATC: Anaplastic thyroid cancer |
| HT: Hashimoto's thyroiditis | ||
| PTC: Papillary thyroid cancer |
| ∗log2FC in expression of this searched gene in stem-like cells from each diseased tissue sample relative to stem-like cells in normal samples in each tissue plotted against the malignancy continuum. Samples are colored based on if they are from different disease stage. |
Top |
Malignant transformation related pathway analysis |
| Find out the enriched GO biological processes and KEGG pathways involved in transition from healthy to precancer to cancer |
| Tissue | Disease Stage | Enriched GO biological Processes |
| Colorectum | AD |  |
| Colorectum | SER |  |
| Colorectum | MSS |  |
| Colorectum | MSI-H |  |
| Colorectum | FAP |  |
| ∗Top 15 enriched GO BP terms are showed in the bar plot of each disease state in each tissue. Each row represents a significant GO biological process which is colored according to the -log10(p.adjust). |
| Page: 1 2 3 4 5 6 7 8 9 |
| GO ID | Tissue | Disease Stage | Description | Gene Ratio | Bg Ratio | pvalue | p.adjust | Count |
| Page: 1 |
| Pathway ID | Tissue | Disease Stage | Description | Gene Ratio | Bg Ratio | pvalue | p.adjust | qvalue | Count |
| Page: 1 |
Top |
Cell-cell communication analysis |
| Identification of potential cell-cell interactions between two cell types and their ligand-receptor pairs for different disease states |
| Ligand | Receptor | LRpair | Pathway | Tissue | Disease Stage |
| Page: 1 |
Top |
Single-cell gene regulatory network inference analysis |
| Find out the significant the regulons (TFs) and the target genes of each regulon across cell types for different disease states |
| TF | Cell Type | Tissue | Disease Stage | Target Gene | RSS | Regulon Activity |
| ∗The dot plots of a searched regulon are shown for all cell subpopulations in each disease state of each tissue based on the regulon specific score inferred using pySCENIC and by calculating the average expression. |
| Page: 1 |
Top |
Somatic mutation of malignant transformation related genes |
| Annotation of somatic variants for genes involved in malignant transformation |
| Hugo Symbol | Variant Class | Variant Classification | dbSNP RS | HGVSc | HGVSp | HGVSp Short | SWISSPROT | BIOTYPE | SIFT | PolyPhen | Tumor Sample Barcode | Tissue | Histology | Sex | Age | Stage | Therapy Types | Drugs | Outcome |
| FAM46C | SNV | Missense_Mutation | rs775789017 | c.931C>T | p.Arg311Cys | p.R311C | Q5VWP2 | protein_coding | deleterious(0) | benign(0.003) | TCGA-A8-A09G-01 | Breast | breast invasive carcinoma | Female | >=65 | III/IV | Unknown | Unknown | SD |
| FAM46C | SNV | Missense_Mutation | c.582N>G | p.Phe194Leu | p.F194L | Q5VWP2 | protein_coding | tolerated(0.1) | benign(0.042) | TCGA-E2-A1LH-01 | Breast | breast invasive carcinoma | Female | <65 | I/II | Chemotherapy | adriamycin | SD | |
| FAM46C | insertion | Frame_Shift_Ins | novel | c.976_977insAAATCAGAGGCGGGGGACTTCTCAAGTACAGCAACCTTCTT | p.Arg326GlnfsTer19 | p.R326Qfs*19 | Q5VWP2 | protein_coding | TCGA-BH-A0AY-01 | Breast | breast invasive carcinoma | Female | <65 | I/II | Chemotherapy | SD | |||
| FAM46C | insertion | Nonsense_Mutation | novel | c.121_122insAATGAAACAC | p.Phe41Ter | p.F41* | Q5VWP2 | protein_coding | TCGA-BH-A0DP-01 | Breast | breast invasive carcinoma | Female | <65 | I/II | Hormone Therapy | arimidex | SD | ||
| FAM46C | SNV | Missense_Mutation | novel | c.787N>C | p.Ile263Leu | p.I263L | Q5VWP2 | protein_coding | tolerated(0.08) | benign(0.007) | TCGA-AA-3984-01 | Colorectum | colon adenocarcinoma | Female | <65 | I/II | Unknown | Unknown | SD |
| FAM46C | SNV | Missense_Mutation | rs779467652 | c.758N>A | p.Arg253Gln | p.R253Q | Q5VWP2 | protein_coding | deleterious(0.02) | probably_damaging(0.988) | TCGA-AZ-6603-01 | Colorectum | colon adenocarcinoma | Female | >=65 | I/II | Unknown | Unknown | SD |
| FAM46C | SNV | Missense_Mutation | rs764287568 | c.946G>A | p.Glu316Lys | p.E316K | Q5VWP2 | protein_coding | tolerated(0.05) | probably_damaging(0.989) | TCGA-DM-A28E-01 | Colorectum | colon adenocarcinoma | Female | >=65 | I/II | Unknown | Unknown | SD |
| FAM46C | SNV | Missense_Mutation | rs773285739 | c.1087G>A | p.Val363Ile | p.V363I | Q5VWP2 | protein_coding | tolerated(0.26) | possibly_damaging(0.685) | TCGA-AJ-A3BH-01 | Endometrium | uterine corpus endometrioid carcinoma | Female | Unknown | I/II | Unknown | Unknown | SD |
| FAM46C | SNV | Missense_Mutation | novel | c.337N>A | p.Leu113Met | p.L113M | Q5VWP2 | protein_coding | tolerated(0.05) | possibly_damaging(0.825) | TCGA-AJ-A3EL-01 | Endometrium | uterine corpus endometrioid carcinoma | Female | <65 | I/II | Unknown | Unknown | SD |
| FAM46C | SNV | Missense_Mutation | novel | c.1129N>T | p.Pro377Ser | p.P377S | Q5VWP2 | protein_coding | tolerated(0.39) | benign(0) | TCGA-AJ-A8CT-01 | Endometrium | uterine corpus endometrioid carcinoma | Female | <65 | I/II | Unknown | Unknown | SD |
| Page: 1 2 3 4 |
Top |
Related drugs of malignant transformation related genes |
| Identification of chemicals and drugs interact with genes involved in malignant transfromation |
| (DGIdb 4.0) |
| Entrez ID | Symbol | Category | Interaction Types | Drug Claim Name | Drug Name | PMIDs |
| Page: 1 |

Copyright 2023-Present -The University of Texas Health Science Center at Houston |