
|
|||||
|
 | |
| |
| |
| |
| |
| |
|
Gene: FAM46B |
Gene summary for FAM46B |
| Gene information | Species | Human | Gene symbol | FAM46B | Gene ID | 115572 |
| Gene name | terminal nucleotidyltransferase 5B | |
| Gene Alias | FAM46 | |
| Cytomap | 1p36.11 | |
| Gene Type | protein-coding | GO ID | GO:0006139 | UniProtAcc | Q96A09 |
Top |
Malignant transformation analysis |
| Identification of the aberrant gene expression in precancerous and cancerous lesions by comparing the gene expression of stem-like cells in diseased tissues with normal stem cells |
| Entrez ID | Symbol | Replicates | Species | Organ | Tissue | Adj P-value | Log2FC | Malignancy |
| 115572 | FAM46B | P1T-E | Human | Esophagus | ESCC | 1.26e-09 | 6.50e-01 | 0.0875 |
| 115572 | FAM46B | P2T-E | Human | Esophagus | ESCC | 1.72e-05 | 9.76e-02 | 0.1177 |
| 115572 | FAM46B | P4T-E | Human | Esophagus | ESCC | 9.13e-07 | 2.71e-01 | 0.1323 |
| 115572 | FAM46B | P5T-E | Human | Esophagus | ESCC | 7.08e-09 | 3.94e-01 | 0.1327 |
| 115572 | FAM46B | P8T-E | Human | Esophagus | ESCC | 2.12e-06 | -3.04e-03 | 0.0889 |
| 115572 | FAM46B | P10T-E | Human | Esophagus | ESCC | 9.19e-06 | -6.56e-02 | 0.116 |
| 115572 | FAM46B | P12T-E | Human | Esophagus | ESCC | 9.49e-05 | 9.70e-02 | 0.1122 |
| 115572 | FAM46B | P20T-E | Human | Esophagus | ESCC | 7.39e-05 | 3.04e-01 | 0.1124 |
| 115572 | FAM46B | P21T-E | Human | Esophagus | ESCC | 7.83e-07 | 1.16e-01 | 0.1617 |
| 115572 | FAM46B | P23T-E | Human | Esophagus | ESCC | 3.34e-05 | 3.53e-01 | 0.108 |
| 115572 | FAM46B | P26T-E | Human | Esophagus | ESCC | 1.37e-02 | -5.76e-02 | 0.1276 |
| 115572 | FAM46B | P31T-E | Human | Esophagus | ESCC | 2.45e-07 | 2.58e-01 | 0.1251 |
| 115572 | FAM46B | P32T-E | Human | Esophagus | ESCC | 1.35e-03 | -5.51e-02 | 0.1666 |
| 115572 | FAM46B | P37T-E | Human | Esophagus | ESCC | 1.58e-05 | 2.60e-02 | 0.1371 |
| 115572 | FAM46B | P47T-E | Human | Esophagus | ESCC | 2.07e-07 | 1.79e-01 | 0.1067 |
| 115572 | FAM46B | P48T-E | Human | Esophagus | ESCC | 5.82e-07 | -2.26e-02 | 0.0959 |
| 115572 | FAM46B | P52T-E | Human | Esophagus | ESCC | 9.00e-15 | 3.55e-01 | 0.1555 |
| 115572 | FAM46B | P54T-E | Human | Esophagus | ESCC | 7.00e-13 | 5.51e-01 | 0.0975 |
| 115572 | FAM46B | P57T-E | Human | Esophagus | ESCC | 1.11e-13 | 5.72e-01 | 0.0926 |
| 115572 | FAM46B | P62T-E | Human | Esophagus | ESCC | 1.49e-03 | 2.29e-01 | 0.1302 |
| Page: 1 2 3 |
| Tissue | Expression Dynamics | Abbreviation |
| Esophagus | 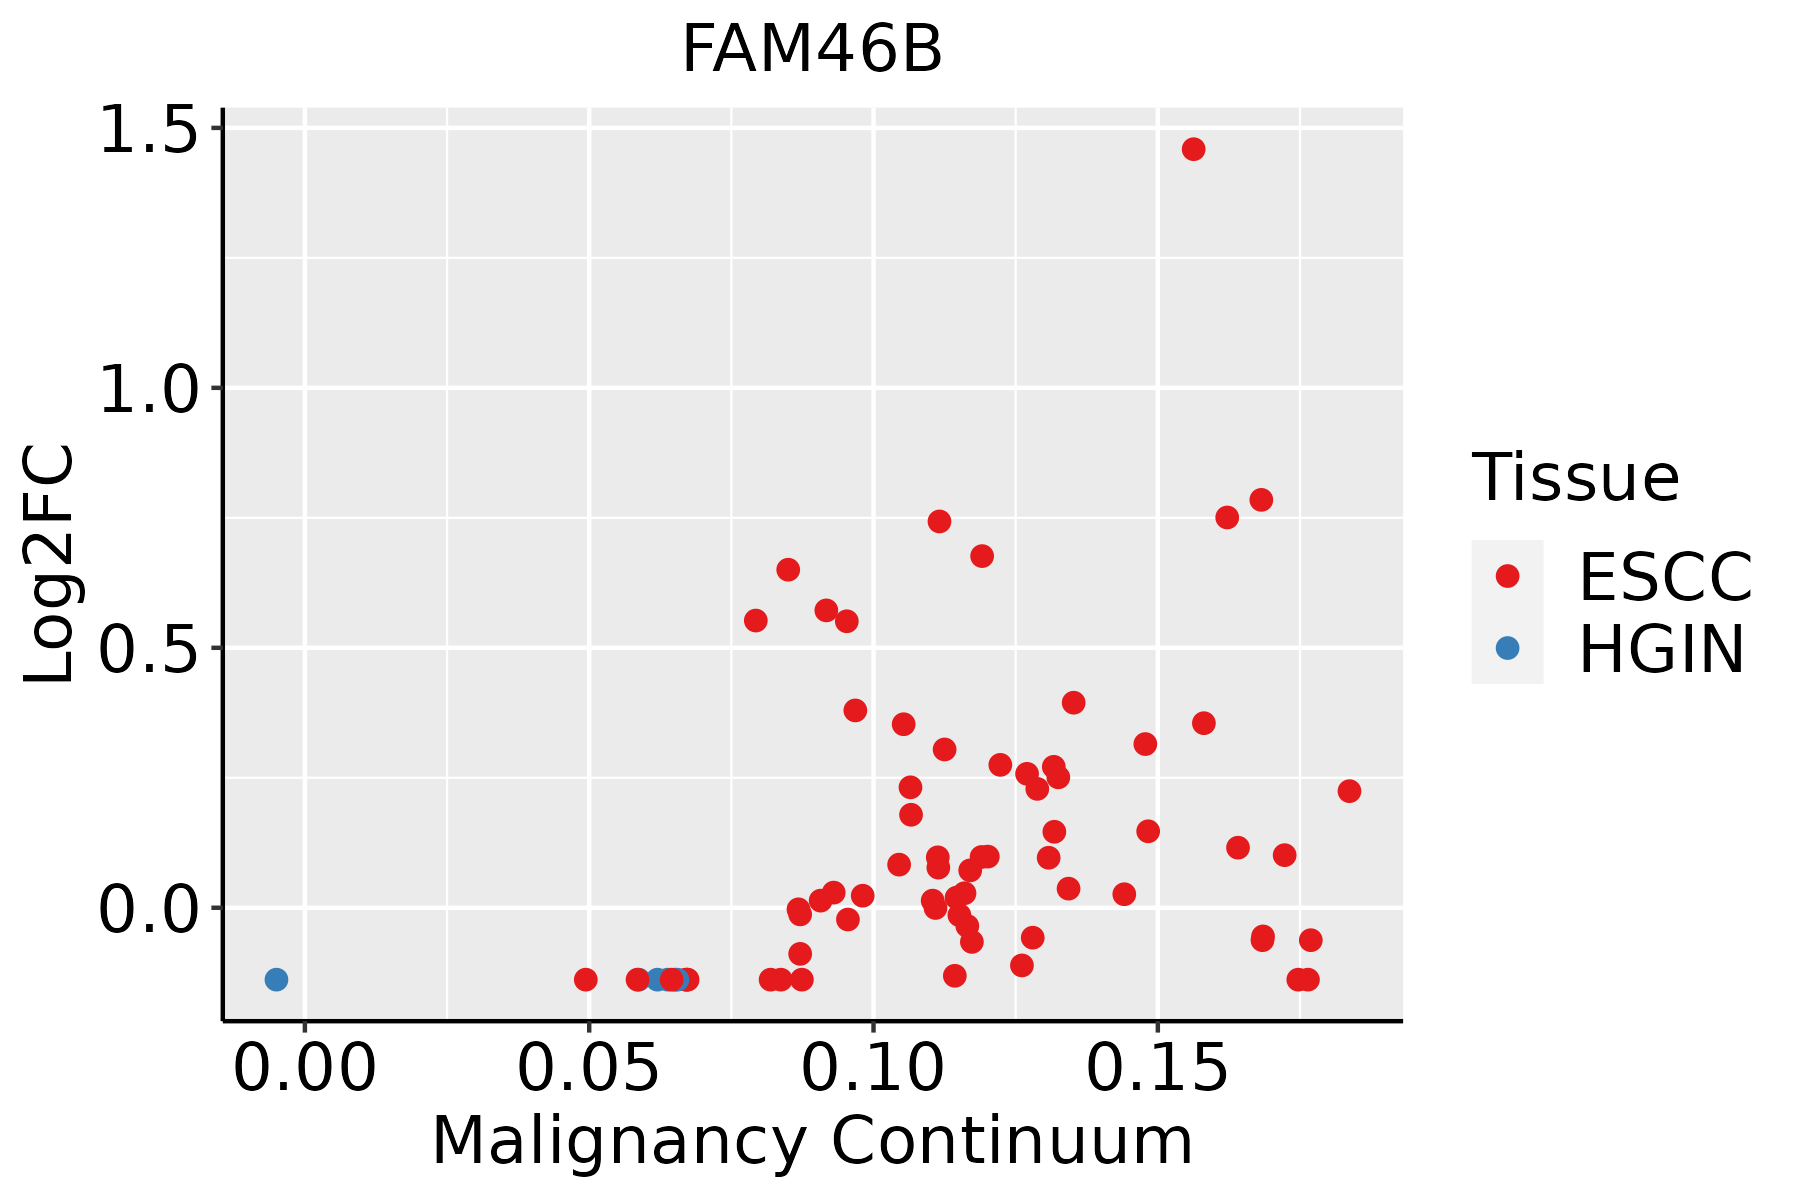 | ESCC: Esophageal squamous cell carcinoma |
| HGIN: High-grade intraepithelial neoplasias | ||
| LGIN: Low-grade intraepithelial neoplasias | ||
| Skin | 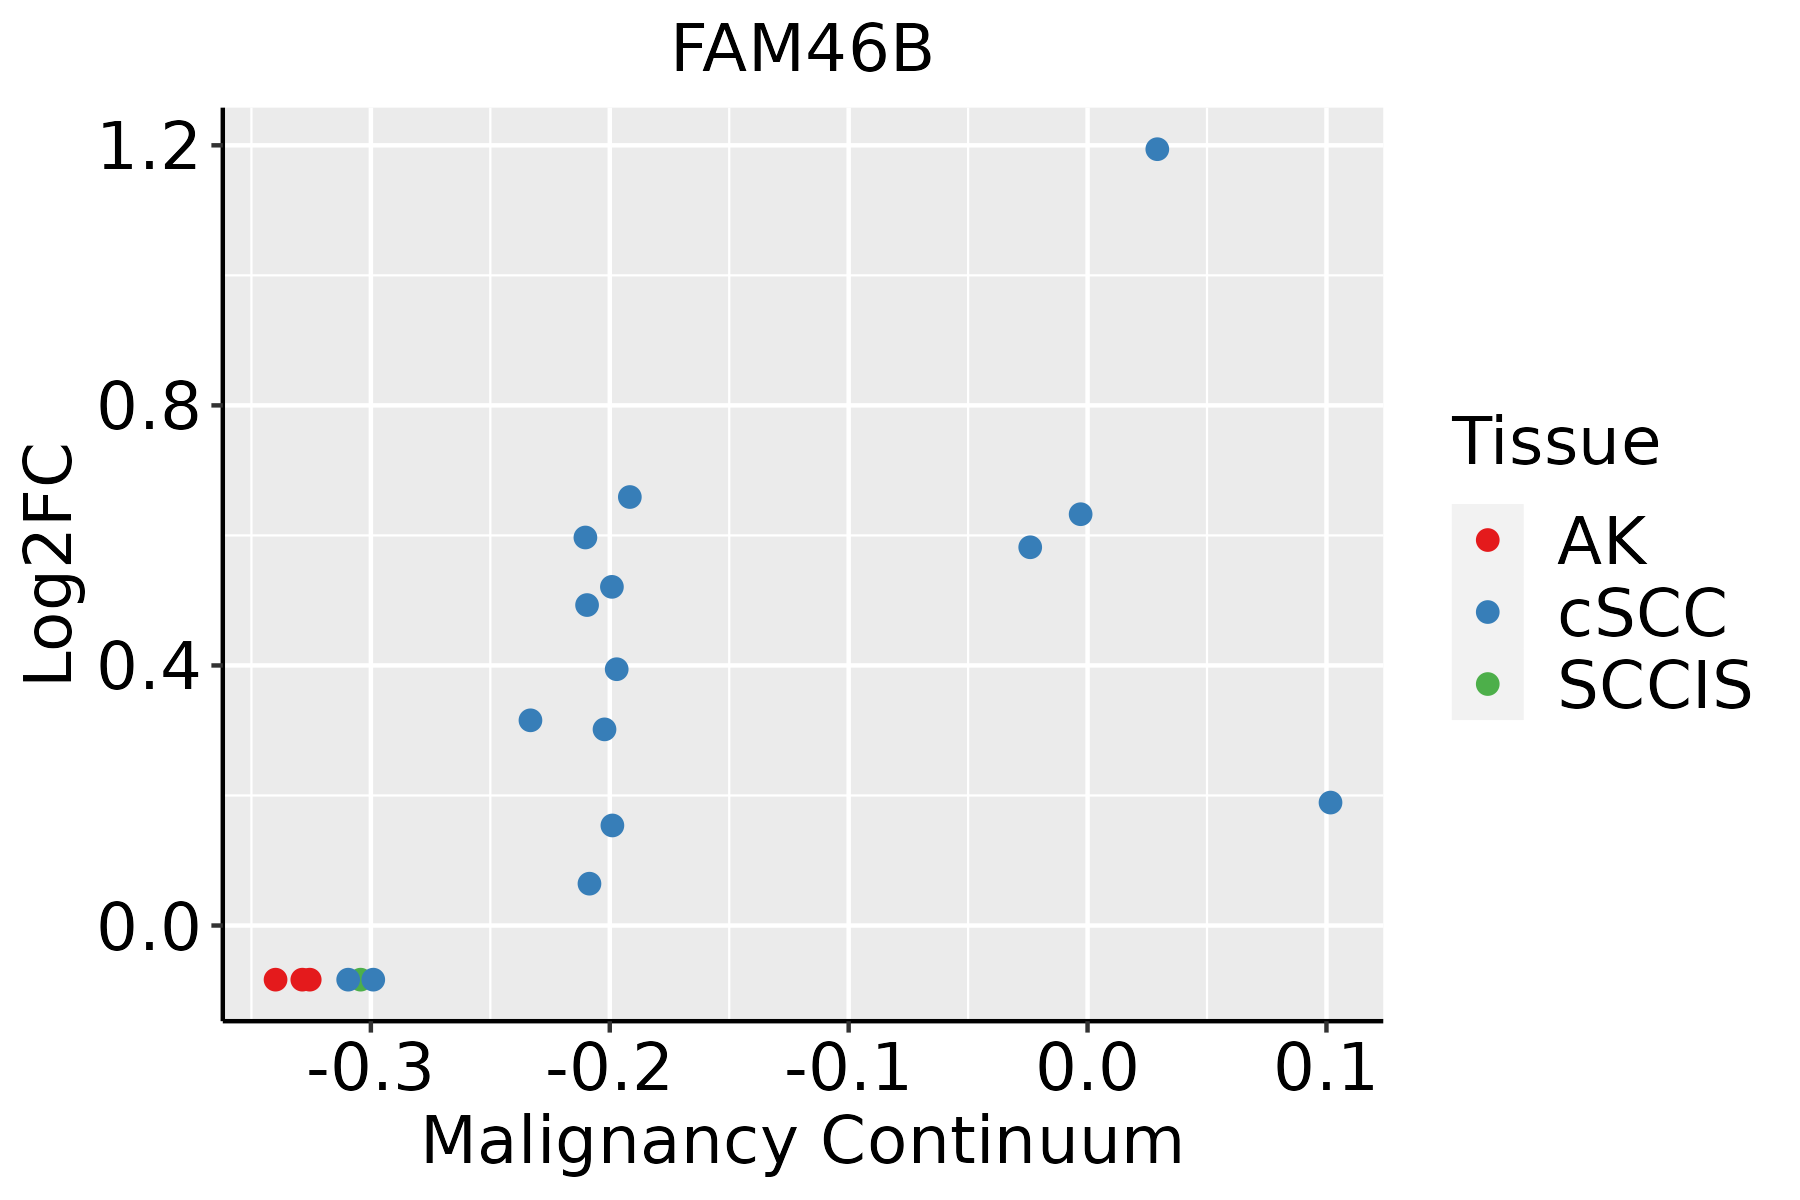 | AK: Actinic keratosis |
| cSCC: Cutaneous squamous cell carcinoma | ||
| SCCIS:squamous cell carcinoma in situ |
| ∗log2FC in expression of this searched gene in stem-like cells from each diseased tissue sample relative to stem-like cells in normal samples in each tissue plotted against the malignancy continuum. Samples are colored based on if they are from different disease stage. |
Top |
Malignant transformation related pathway analysis |
| Find out the enriched GO biological processes and KEGG pathways involved in transition from healthy to precancer to cancer |
| Tissue | Disease Stage | Enriched GO biological Processes |
| Colorectum | AD |  |
| Colorectum | SER |  |
| Colorectum | MSS |  |
| Colorectum | MSI-H |  |
| Colorectum | FAP |  |
| ∗Top 15 enriched GO BP terms are showed in the bar plot of each disease state in each tissue. Each row represents a significant GO biological process which is colored according to the -log10(p.adjust). |
| Page: 1 2 3 4 5 6 7 8 9 |
| GO ID | Tissue | Disease Stage | Description | Gene Ratio | Bg Ratio | pvalue | p.adjust | Count |
| Page: 1 |
| Pathway ID | Tissue | Disease Stage | Description | Gene Ratio | Bg Ratio | pvalue | p.adjust | qvalue | Count |
| Page: 1 |
Top |
Cell-cell communication analysis |
| Identification of potential cell-cell interactions between two cell types and their ligand-receptor pairs for different disease states |
| Ligand | Receptor | LRpair | Pathway | Tissue | Disease Stage |
| Page: 1 |
Top |
Single-cell gene regulatory network inference analysis |
| Find out the significant the regulons (TFs) and the target genes of each regulon across cell types for different disease states |
| TF | Cell Type | Tissue | Disease Stage | Target Gene | RSS | Regulon Activity |
| ∗The dot plots of a searched regulon are shown for all cell subpopulations in each disease state of each tissue based on the regulon specific score inferred using pySCENIC and by calculating the average expression. |
| Page: 1 |
Top |
Somatic mutation of malignant transformation related genes |
| Annotation of somatic variants for genes involved in malignant transformation |
| Hugo Symbol | Variant Class | Variant Classification | dbSNP RS | HGVSc | HGVSp | HGVSp Short | SWISSPROT | BIOTYPE | SIFT | PolyPhen | Tumor Sample Barcode | Tissue | Histology | Sex | Age | Stage | Therapy Types | Drugs | Outcome |
| FAM46B | SNV | Missense_Mutation | novel | c.616N>C | p.Asp206His | p.D206H | Q96A09 | protein_coding | tolerated(0.06) | probably_damaging(0.98) | TCGA-AC-A5XS-01 | Breast | breast invasive carcinoma | Female | >=65 | I/II | Hormone Therapy | femara | SD |
| FAM46B | SNV | Missense_Mutation | novel | c.1085N>A | p.Arg362His | p.R362H | Q96A09 | protein_coding | deleterious(0.03) | probably_damaging(1) | TCGA-EW-A3E8-01 | Breast | breast invasive carcinoma | Female | <65 | I/II | Hormone Therapy | anastrozole | SD |
| FAM46B | SNV | Missense_Mutation | rs750538687 | c.871N>T | p.Arg291Trp | p.R291W | Q96A09 | protein_coding | deleterious(0) | probably_damaging(0.992) | TCGA-C5-A1MH-01 | Cervix | cervical & endocervical cancer | Female | >=65 | III/IV | Chemotherapy | cisplatin | PD |
| FAM46B | SNV | Missense_Mutation | c.214N>A | p.Gly72Arg | p.G72R | Q96A09 | protein_coding | deleterious(0) | probably_damaging(0.997) | TCGA-AA-3821-01 | Colorectum | colon adenocarcinoma | Female | >=65 | I/II | Unknown | Unknown | SD | |
| FAM46B | SNV | Missense_Mutation | c.511N>C | p.Glu171Gln | p.E171Q | Q96A09 | protein_coding | deleterious(0) | probably_damaging(1) | TCGA-AD-6899-01 | Colorectum | colon adenocarcinoma | Male | >=65 | III/IV | Unknown | Unknown | SD | |
| FAM46B | SNV | Missense_Mutation | c.218N>A | p.Arg73His | p.R73H | Q96A09 | protein_coding | deleterious(0) | probably_damaging(0.954) | TCGA-AU-6004-01 | Colorectum | colon adenocarcinoma | Female | >=65 | I/II | Unknown | Unknown | SD | |
| FAM46B | SNV | Missense_Mutation | c.1186G>A | p.Asp396Asn | p.D396N | Q96A09 | protein_coding | tolerated(0.31) | benign(0.04) | TCGA-AZ-6601-01 | Colorectum | colon adenocarcinoma | Male | >=65 | I/II | Unknown | Unknown | PD | |
| FAM46B | SNV | Missense_Mutation | c.176G>A | p.Arg59Gln | p.R59Q | Q96A09 | protein_coding | deleterious(0.05) | probably_damaging(0.999) | TCGA-CK-4951-01 | Colorectum | colon adenocarcinoma | Female | >=65 | I/II | Unknown | Unknown | PD | |
| FAM46B | SNV | Missense_Mutation | c.620N>G | p.Ser207Trp | p.S207W | Q96A09 | protein_coding | deleterious(0) | probably_damaging(0.995) | TCGA-QG-A5Z2-01 | Colorectum | colon adenocarcinoma | Male | <65 | I/II | Unknown | Unknown | SD | |
| FAM46B | SNV | Missense_Mutation | rs749677149 | c.547G>A | p.Asp183Asn | p.D183N | Q96A09 | protein_coding | deleterious(0.04) | probably_damaging(0.981) | TCGA-AG-A002-01 | Colorectum | rectum adenocarcinoma | Male | <65 | I/II | Unknown | Unknown | SD |
| Page: 1 2 3 4 |
Top |
Related drugs of malignant transformation related genes |
| Identification of chemicals and drugs interact with genes involved in malignant transfromation |
| (DGIdb 4.0) |
| Entrez ID | Symbol | Category | Interaction Types | Drug Claim Name | Drug Name | PMIDs |
| Page: 1 |

Copyright 2023-Present -The University of Texas Health Science Center at Houston |