
|
|||||
|
 | |
| |
| |
| |
| |
| |
|
Gene: FAM3D |
Gene summary for FAM3D |
| Gene information | Species | Human | Gene symbol | FAM3D | Gene ID | 131177 |
| Gene name | FAM3 metabolism regulating signaling molecule D | |
| Gene Alias | EF7 | |
| Cytomap | 3p14.2 | |
| Gene Type | protein-coding | GO ID | GO:0002790 | UniProtAcc | A0A0A8K9B4 |
Top |
Malignant transformation analysis |
| Identification of the aberrant gene expression in precancerous and cancerous lesions by comparing the gene expression of stem-like cells in diseased tissues with normal stem cells |
| Entrez ID | Symbol | Replicates | Species | Organ | Tissue | Adj P-value | Log2FC | Malignancy |
| 131177 | FAM3D | H2 | Human | Cervix | HSIL_HPV | 1.89e-23 | 5.45e-01 | 0.0632 |
| 131177 | FAM3D | T2 | Human | Cervix | CC | 6.34e-10 | 5.08e-01 | 0.0709 |
| 131177 | FAM3D | HTA11_3410_2000001011 | Human | Colorectum | AD | 7.50e-11 | -3.93e-01 | 0.0155 |
| 131177 | FAM3D | HTA11_78_2000001011 | Human | Colorectum | AD | 1.59e-02 | 5.01e-01 | -0.1088 |
| 131177 | FAM3D | HTA11_347_2000001011 | Human | Colorectum | AD | 6.46e-48 | 1.60e+00 | -0.1954 |
| 131177 | FAM3D | HTA11_411_2000001011 | Human | Colorectum | SER | 8.59e-09 | 1.26e+00 | -0.2602 |
| 131177 | FAM3D | HTA11_2112_2000001011 | Human | Colorectum | SER | 5.27e-25 | 1.84e+00 | -0.2196 |
| 131177 | FAM3D | HTA11_696_2000001011 | Human | Colorectum | AD | 2.47e-27 | 1.31e+00 | -0.1464 |
| 131177 | FAM3D | HTA11_866_2000001011 | Human | Colorectum | AD | 1.29e-14 | 7.82e-01 | -0.1001 |
| 131177 | FAM3D | HTA11_2992_2000001011 | Human | Colorectum | SER | 4.00e-02 | 7.40e-01 | -0.1706 |
| 131177 | FAM3D | HTA11_7663_2000001011 | Human | Colorectum | SER | 2.62e-06 | 9.40e-01 | 0.0131 |
| 131177 | FAM3D | HTA11_7696_3000711011 | Human | Colorectum | AD | 1.02e-06 | 5.66e-01 | 0.0674 |
| 131177 | FAM3D | HTA11_6818_2000001011 | Human | Colorectum | AD | 6.24e-14 | 1.52e+00 | 0.0112 |
| 131177 | FAM3D | HTA11_6818_2000001021 | Human | Colorectum | AD | 8.03e-06 | 8.29e-01 | 0.0588 |
| 131177 | FAM3D | HTA11_99999965104_69814 | Human | Colorectum | MSS | 4.35e-03 | 6.57e-01 | 0.281 |
| 131177 | FAM3D | HTA11_99999974143_84620 | Human | Colorectum | MSS | 3.02e-16 | -6.08e-01 | 0.3005 |
| 131177 | FAM3D | F007 | Human | Colorectum | FAP | 1.49e-06 | -3.21e-01 | 0.1176 |
| 131177 | FAM3D | A001-C-207 | Human | Colorectum | FAP | 4.64e-02 | 2.30e-02 | 0.1278 |
| 131177 | FAM3D | A015-C-203 | Human | Colorectum | FAP | 3.12e-23 | -7.79e-02 | -0.1294 |
| 131177 | FAM3D | A015-C-204 | Human | Colorectum | FAP | 4.27e-05 | -1.61e-01 | -0.0228 |
| Page: 1 2 3 4 5 6 |
| Tissue | Expression Dynamics | Abbreviation |
| Cervix | 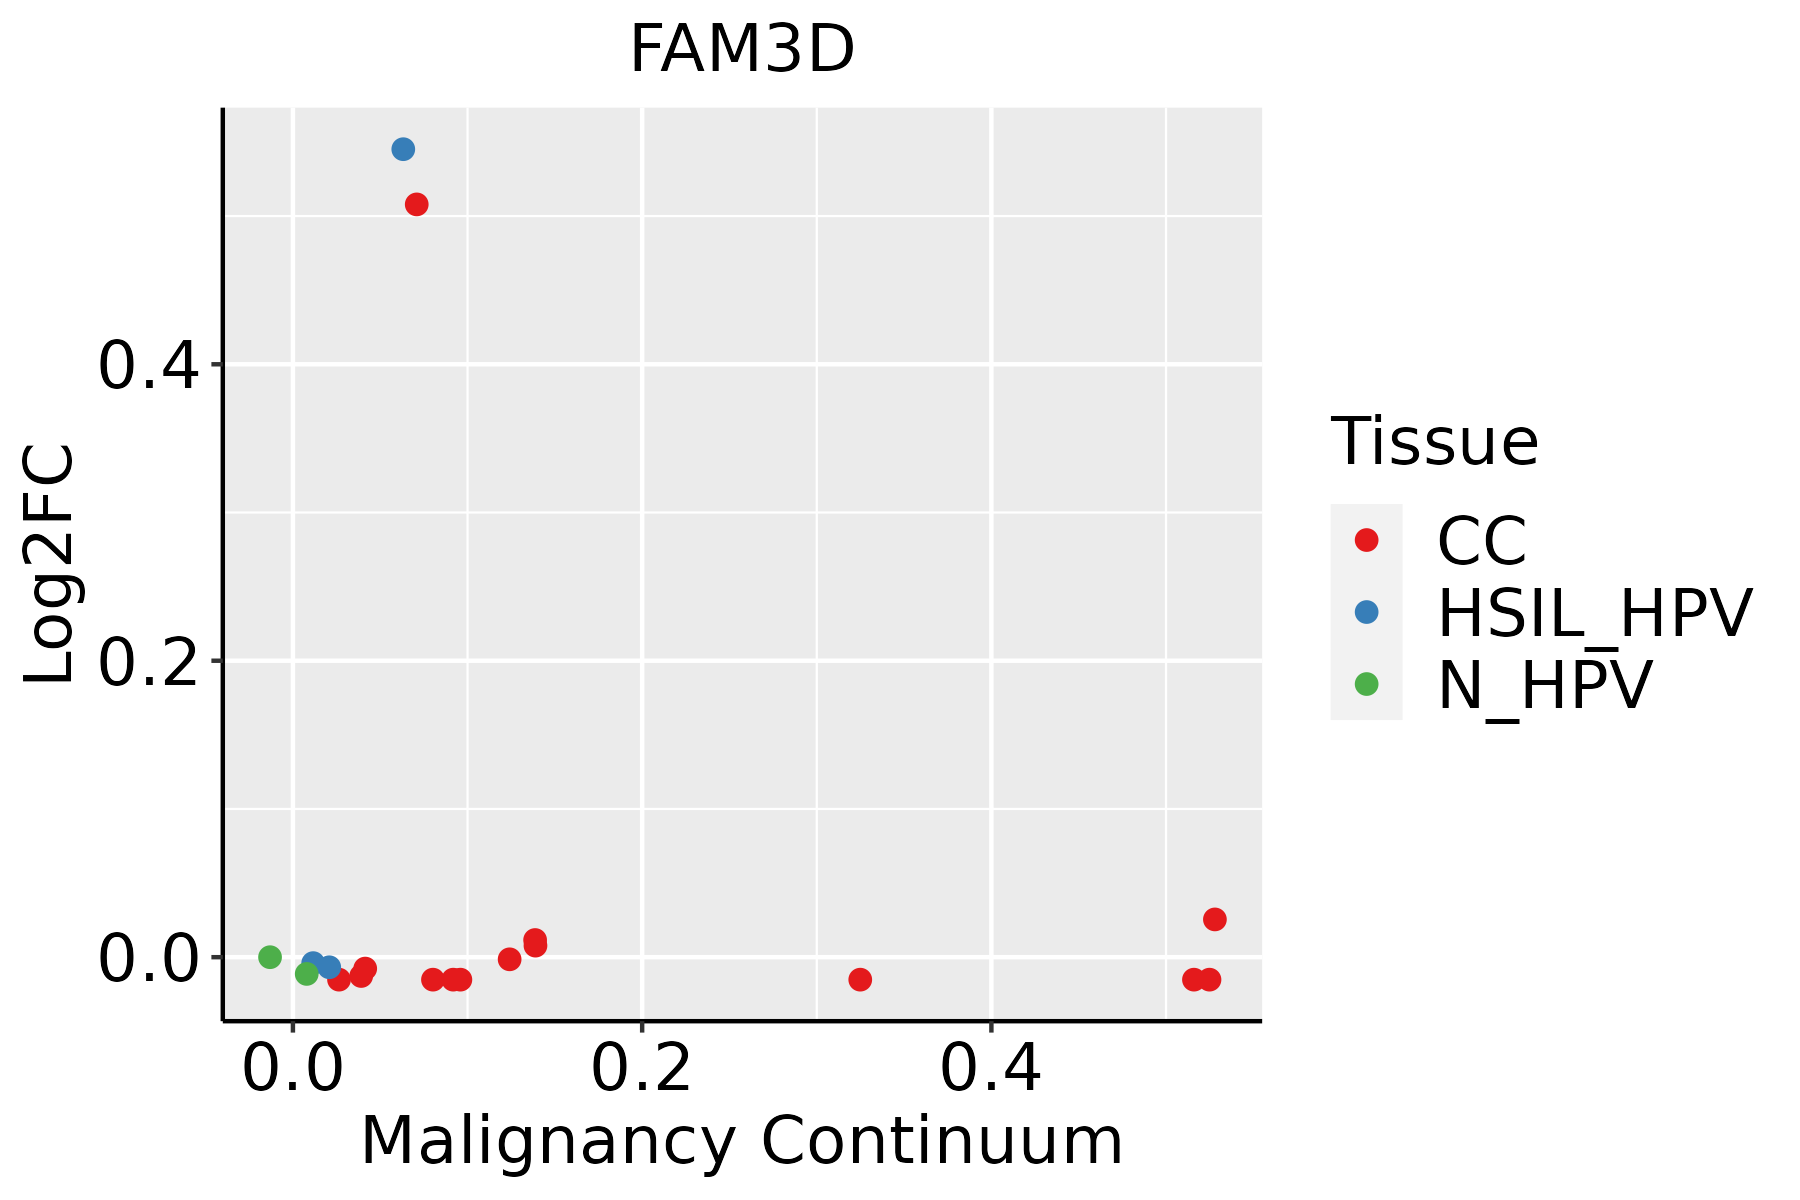 | CC: Cervix cancer |
| HSIL_HPV: HPV-infected high-grade squamous intraepithelial lesions | ||
| N_HPV: HPV-infected normal cervix | ||
| Colorectum (GSE201348) |  | FAP: Familial adenomatous polyposis |
| CRC: Colorectal cancer | ||
| Colorectum (HTA11) |  | AD: Adenomas |
| SER: Sessile serrated lesions | ||
| MSI-H: Microsatellite-high colorectal cancer | ||
| MSS: Microsatellite stable colorectal cancer | ||
| Esophagus | 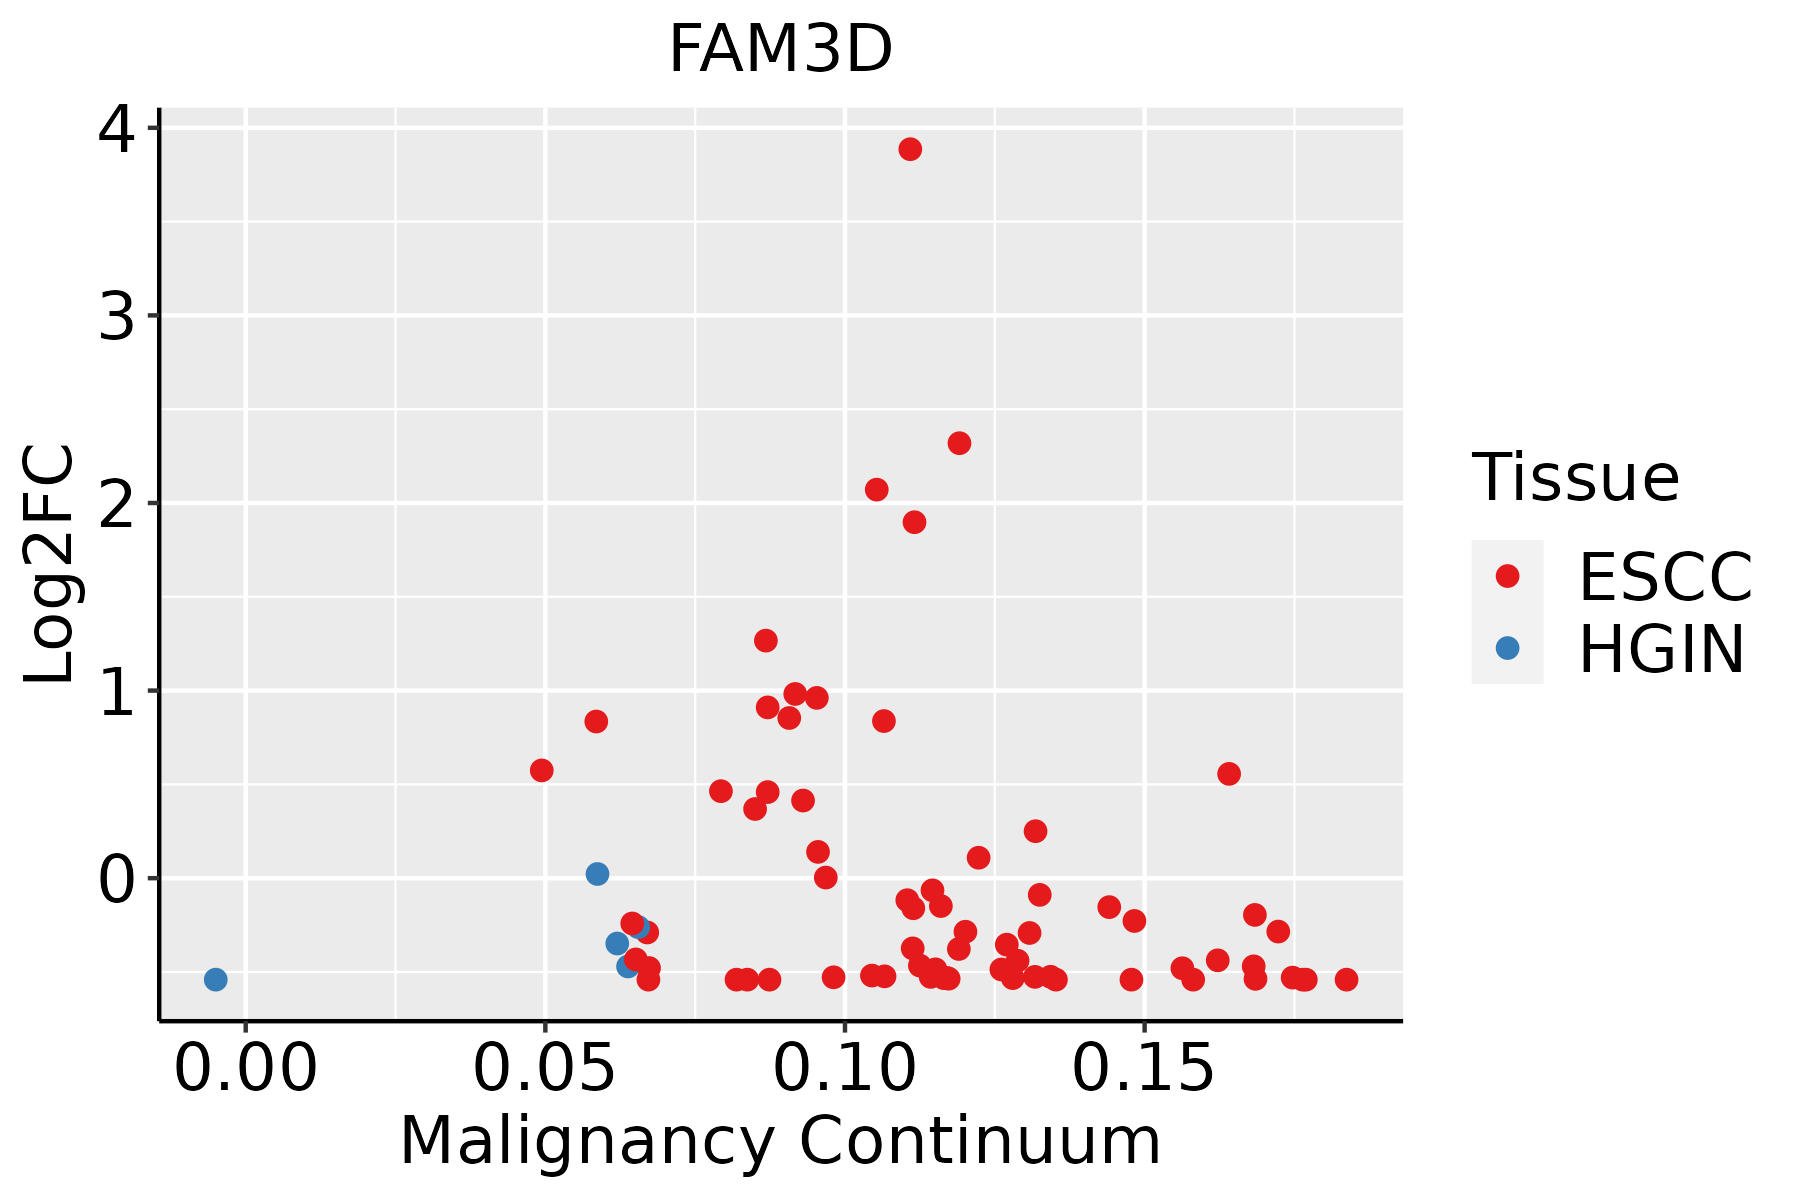 | ESCC: Esophageal squamous cell carcinoma |
| HGIN: High-grade intraepithelial neoplasias | ||
| LGIN: Low-grade intraepithelial neoplasias | ||
| GC | 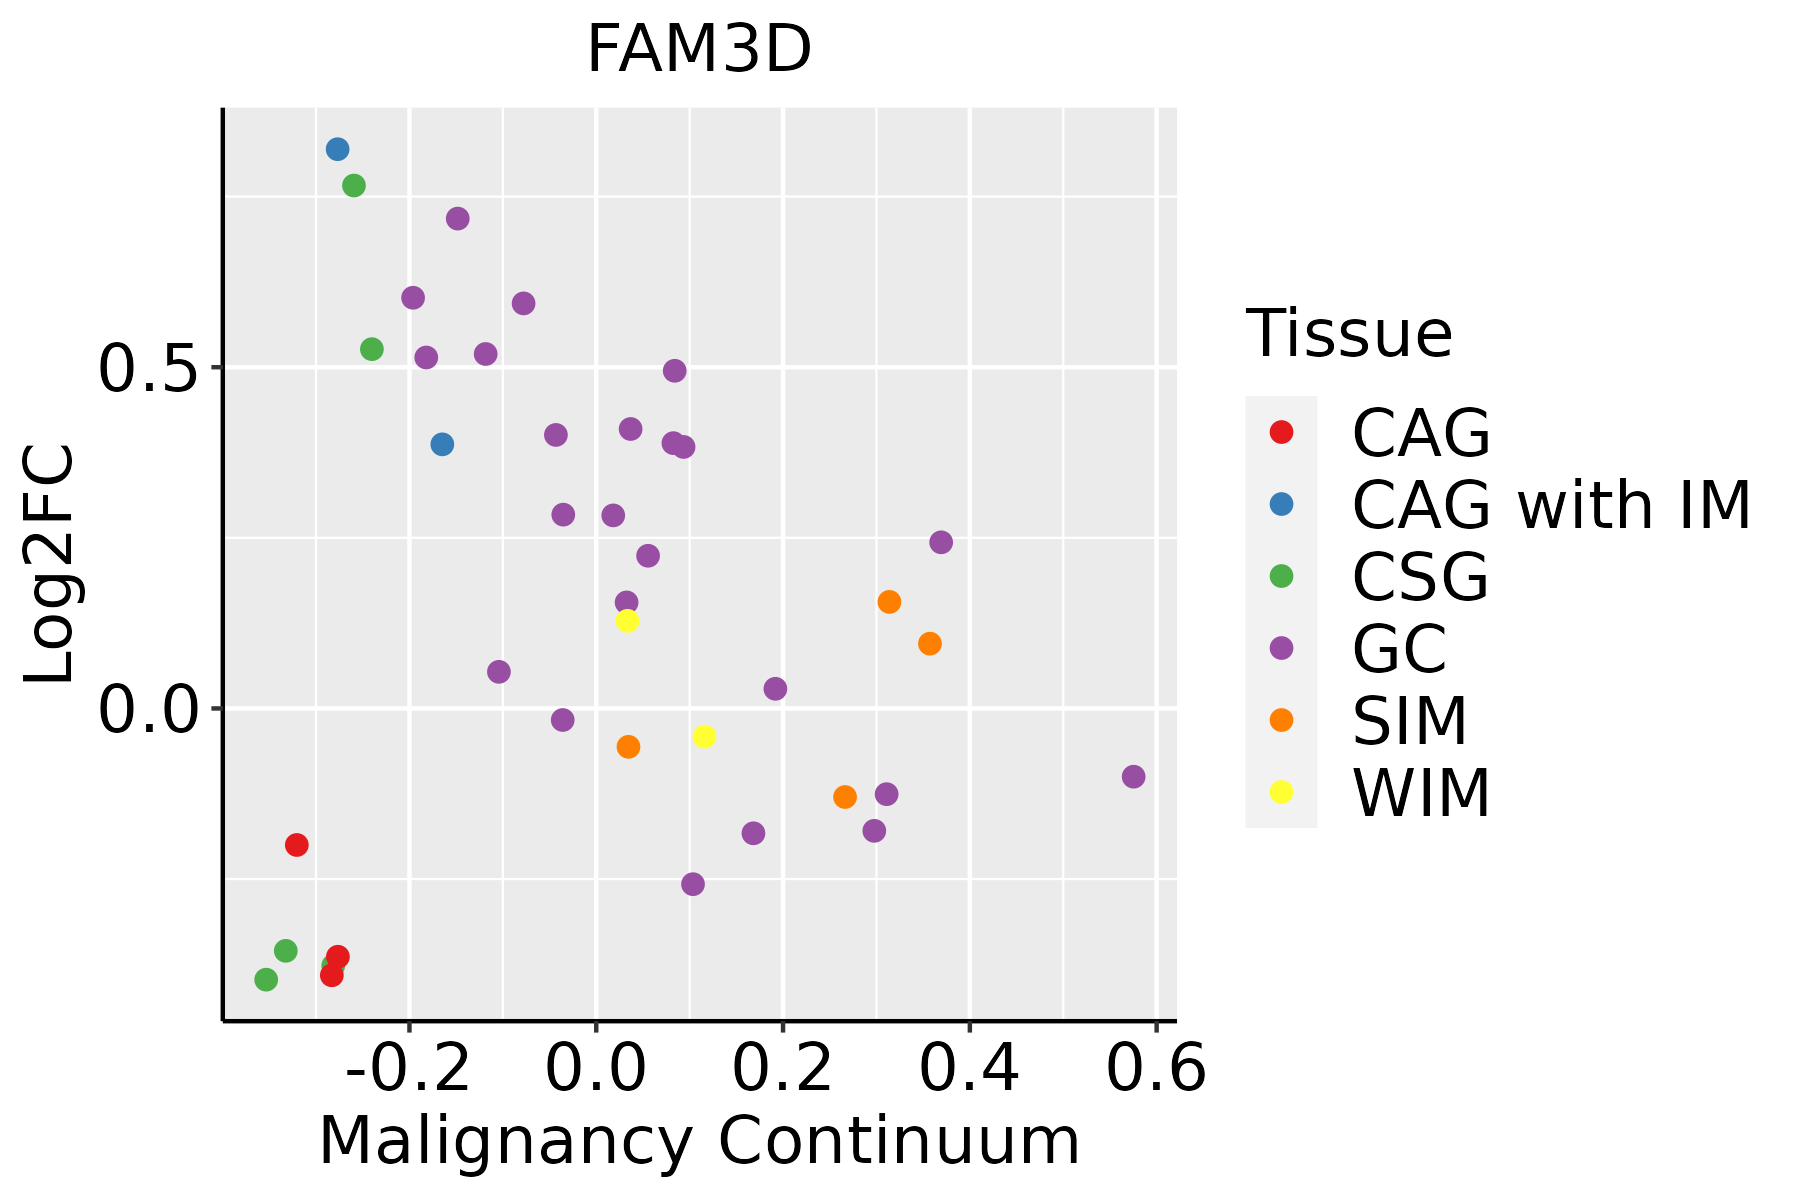 | CAG: Chronic atrophic gastritis |
| CAG with IM: Chronic atrophic gastritis with intestinal metaplasia | ||
| CSG: Chronic superficial gastritis | ||
| GC: Gastric cancer | ||
| SIM: Severe intestinal metaplasia | ||
| WIM: Wild intestinal metaplasia | ||
| Liver |  | HCC: Hepatocellular carcinoma |
| NAFLD: Non-alcoholic fatty liver disease | ||
| Oral Cavity |  | EOLP: Erosive Oral lichen planus |
| LP: leukoplakia | ||
| NEOLP: Non-erosive oral lichen planus | ||
| OSCC: Oral squamous cell carcinoma | ||
| Prostate | 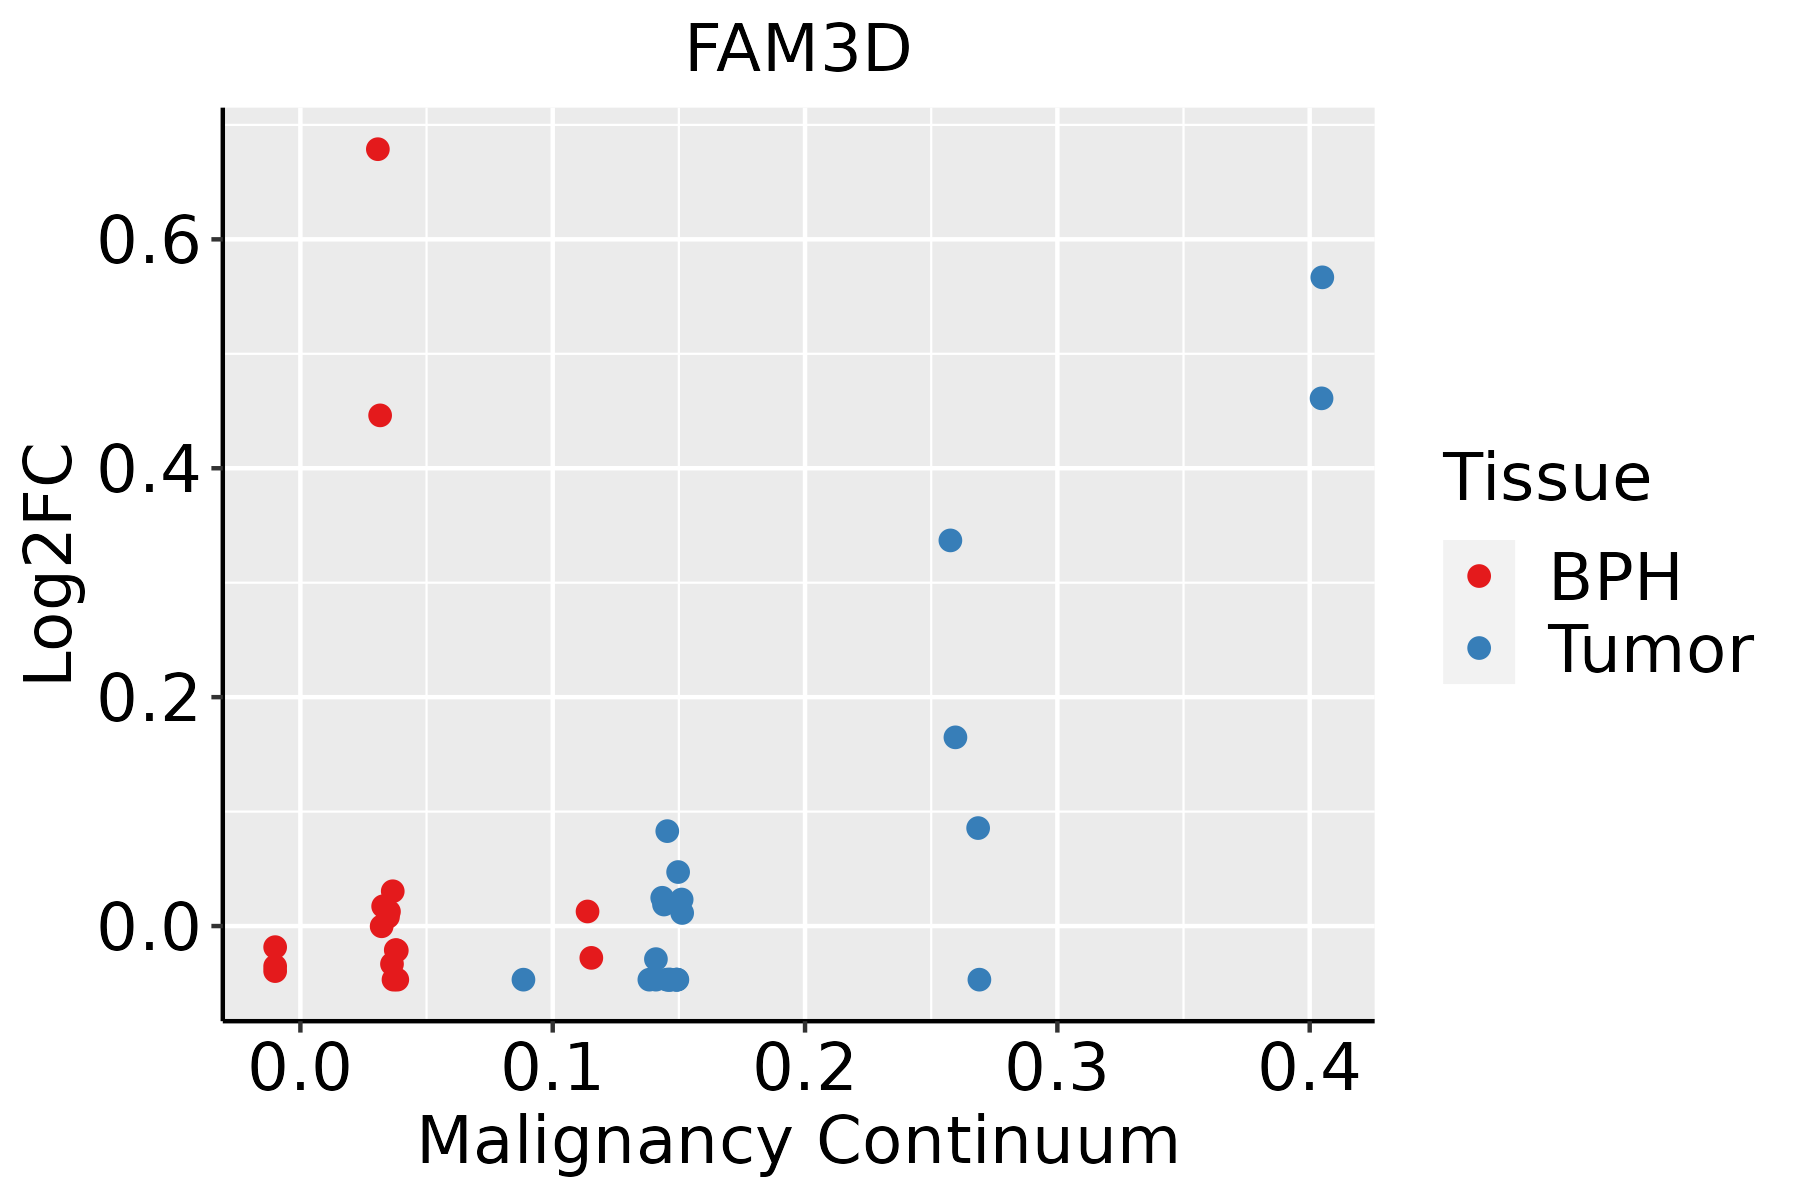 | BPH: Benign Prostatic Hyperplasia |
| ∗log2FC in expression of this searched gene in stem-like cells from each diseased tissue sample relative to stem-like cells in normal samples in each tissue plotted against the malignancy continuum. Samples are colored based on if they are from different disease stage. |
Top |
Malignant transformation related pathway analysis |
| Find out the enriched GO biological processes and KEGG pathways involved in transition from healthy to precancer to cancer |
| Tissue | Disease Stage | Enriched GO biological Processes |
| Colorectum | AD |  |
| Colorectum | SER |  |
| Colorectum | MSS |  |
| Colorectum | MSI-H |  |
| Colorectum | FAP |  |
| ∗Top 15 enriched GO BP terms are showed in the bar plot of each disease state in each tissue. Each row represents a significant GO biological process which is colored according to the -log10(p.adjust). |
| Page: 1 2 3 4 5 6 7 8 9 |
| GO ID | Tissue | Disease Stage | Description | Gene Ratio | Bg Ratio | pvalue | p.adjust | Count |
| GO:00158337 | Cervix | CC | peptide transport | 46/2311 | 264/18723 | 9.69e-03 | 4.78e-02 | 46 |
| GO:0050708 | Colorectum | AD | regulation of protein secretion | 83/3918 | 268/18723 | 6.59e-05 | 1.07e-03 | 83 |
| GO:0009306 | Colorectum | AD | protein secretion | 105/3918 | 359/18723 | 1.05e-04 | 1.57e-03 | 105 |
| GO:0035592 | Colorectum | AD | establishment of protein localization to extracellular region | 105/3918 | 360/18723 | 1.18e-04 | 1.73e-03 | 105 |
| GO:0071692 | Colorectum | AD | protein localization to extracellular region | 106/3918 | 368/18723 | 1.86e-04 | 2.49e-03 | 106 |
| GO:0050796 | Colorectum | AD | regulation of insulin secretion | 54/3918 | 165/18723 | 2.60e-04 | 3.25e-03 | 54 |
| GO:0030073 | Colorectum | AD | insulin secretion | 61/3918 | 195/18723 | 4.28e-04 | 4.81e-03 | 61 |
| GO:0015833 | Colorectum | AD | peptide transport | 77/3918 | 264/18723 | 8.90e-04 | 8.60e-03 | 77 |
| GO:0090087 | Colorectum | AD | regulation of peptide transport | 60/3918 | 202/18723 | 1.94e-03 | 1.58e-02 | 60 |
| GO:0030072 | Colorectum | AD | peptide hormone secretion | 68/3918 | 236/18723 | 2.39e-03 | 1.85e-02 | 68 |
| GO:0002791 | Colorectum | AD | regulation of peptide secretion | 59/3918 | 200/18723 | 2.50e-03 | 1.92e-02 | 59 |
| GO:0090276 | Colorectum | AD | regulation of peptide hormone secretion | 58/3918 | 196/18723 | 2.51e-03 | 1.92e-02 | 58 |
| GO:0002790 | Colorectum | AD | peptide secretion | 69/3918 | 242/18723 | 2.97e-03 | 2.22e-02 | 69 |
| GO:0042886 | Colorectum | AD | amide transport | 83/3918 | 301/18723 | 3.37e-03 | 2.46e-02 | 83 |
| GO:0002792 | Colorectum | AD | negative regulation of peptide secretion | 17/3918 | 44/18723 | 5.46e-03 | 3.56e-02 | 17 |
| GO:0046676 | Colorectum | AD | negative regulation of insulin secretion | 15/3918 | 38/18723 | 7.01e-03 | 4.31e-02 | 15 |
| GO:00507081 | Colorectum | SER | regulation of protein secretion | 63/2897 | 268/18723 | 3.42e-04 | 5.39e-03 | 63 |
| GO:00093061 | Colorectum | SER | protein secretion | 79/2897 | 359/18723 | 5.99e-04 | 8.19e-03 | 79 |
| GO:00355921 | Colorectum | SER | establishment of protein localization to extracellular region | 79/2897 | 360/18723 | 6.54e-04 | 8.77e-03 | 79 |
| GO:00716921 | Colorectum | SER | protein localization to extracellular region | 80/2897 | 368/18723 | 8.13e-04 | 1.01e-02 | 80 |
| Page: 1 2 3 4 5 6 7 |
| Pathway ID | Tissue | Disease Stage | Description | Gene Ratio | Bg Ratio | pvalue | p.adjust | qvalue | Count |
| Page: 1 |
Top |
Cell-cell communication analysis |
| Identification of potential cell-cell interactions between two cell types and their ligand-receptor pairs for different disease states |
| Ligand | Receptor | LRpair | Pathway | Tissue | Disease Stage |
| Page: 1 |
Top |
Single-cell gene regulatory network inference analysis |
| Find out the significant the regulons (TFs) and the target genes of each regulon across cell types for different disease states |
| TF | Cell Type | Tissue | Disease Stage | Target Gene | RSS | Regulon Activity |
| ∗The dot plots of a searched regulon are shown for all cell subpopulations in each disease state of each tissue based on the regulon specific score inferred using pySCENIC and by calculating the average expression. |
| Page: 1 |
Top |
Somatic mutation of malignant transformation related genes |
| Annotation of somatic variants for genes involved in malignant transformation |
| Hugo Symbol | Variant Class | Variant Classification | dbSNP RS | HGVSc | HGVSp | HGVSp Short | SWISSPROT | BIOTYPE | SIFT | PolyPhen | Tumor Sample Barcode | Tissue | Histology | Sex | Age | Stage | Therapy Types | Drugs | Outcome |
| FAM3D | SNV | Missense_Mutation | c.640N>C | p.Glu214Gln | p.E214Q | Q96BQ1 | protein_coding | deleterious(0.01) | probably_damaging(0.956) | TCGA-JW-A5VL-01 | Cervix | cervical & endocervical cancer | Female | <65 | I/II | Unknown | Unknown | SD | |
| FAM3D | SNV | Missense_Mutation | rs149077834 | c.128N>T | p.Ser43Leu | p.S43L | Q96BQ1 | protein_coding | tolerated(0.22) | benign(0.034) | TCGA-UC-A7PG-06 | Cervix | cervical & endocervical cancer | Female | <65 | III/IV | Chemotherapy | cisplatin | PD |
| FAM3D | SNV | Missense_Mutation | c.298N>T | p.Gly100Cys | p.G100C | Q96BQ1 | protein_coding | deleterious(0) | probably_damaging(1) | TCGA-AZ-6598-01 | Colorectum | colon adenocarcinoma | Female | >=65 | I/II | Unknown | Unknown | SD | |
| FAM3D | deletion | Frame_Shift_Del | c.416delG | p.Gly139ValfsTer16 | p.G139Vfs*16 | Q96BQ1 | protein_coding | TCGA-AZ-4313-01 | Colorectum | colon adenocarcinoma | Female | <65 | I/II | Unknown | Unknown | SD | |||
| FAM3D | SNV | Missense_Mutation | novel | c.335N>T | p.Ala112Val | p.A112V | Q96BQ1 | protein_coding | tolerated(0.12) | benign(0.007) | TCGA-A5-A0G2-01 | Endometrium | uterine corpus endometrioid carcinoma | Female | <65 | III/IV | Unknown | Unknown | SD |
| FAM3D | SNV | Missense_Mutation | rs547933815 | c.53N>T | p.Thr18Met | p.T18M | Q96BQ1 | protein_coding | tolerated(0.28) | possibly_damaging(0.653) | TCGA-AP-A0LM-01 | Endometrium | uterine corpus endometrioid carcinoma | Female | <65 | III/IV | Chemotherapy | cisplatin | SD |
| FAM3D | SNV | Missense_Mutation | c.109N>A | p.Pro37Thr | p.P37T | Q96BQ1 | protein_coding | tolerated(0.41) | possibly_damaging(0.857) | TCGA-AX-A0J0-01 | Endometrium | uterine corpus endometrioid carcinoma | Female | <65 | I/II | Unknown | Unknown | SD | |
| FAM3D | SNV | Missense_Mutation | c.368C>A | p.Ser123Tyr | p.S123Y | Q96BQ1 | protein_coding | deleterious(0) | probably_damaging(0.962) | TCGA-AX-A2HC-01 | Endometrium | uterine corpus endometrioid carcinoma | Female | <65 | III/IV | Chemotherapy | paclitaxel | PD | |
| FAM3D | SNV | Missense_Mutation | c.109C>T | p.Pro37Ser | p.P37S | Q96BQ1 | protein_coding | tolerated(0.58) | possibly_damaging(0.724) | TCGA-AX-A2HC-01 | Endometrium | uterine corpus endometrioid carcinoma | Female | <65 | III/IV | Chemotherapy | paclitaxel | PD | |
| FAM3D | SNV | Missense_Mutation | rs867222900 | c.658C>T | p.Pro220Ser | p.P220S | Q96BQ1 | protein_coding | deleterious(0.01) | probably_damaging(1) | TCGA-B5-A11E-01 | Endometrium | uterine corpus endometrioid carcinoma | Female | <65 | I/II | Unknown | Unknown | SD |
| Page: 1 2 3 |
Top |
Related drugs of malignant transformation related genes |
| Identification of chemicals and drugs interact with genes involved in malignant transfromation |
| (DGIdb 4.0) |
| Entrez ID | Symbol | Category | Interaction Types | Drug Claim Name | Drug Name | PMIDs |
| Page: 1 |

Copyright 2023-Present -The University of Texas Health Science Center at Houston |