
|
|||||
|
 | |
| |
| |
| |
| |
| |
|
Gene: FAM3B |
Gene summary for FAM3B |
| Gene information | Species | Human | Gene symbol | FAM3B | Gene ID | 54097 |
| Gene name | FAM3 metabolism regulating signaling molecule B | |
| Gene Alias | 2-21 | |
| Cytomap | 21q22.3 | |
| Gene Type | protein-coding | GO ID | GO:0002790 | UniProtAcc | P58499 |
Top |
Malignant transformation analysis |
| Identification of the aberrant gene expression in precancerous and cancerous lesions by comparing the gene expression of stem-like cells in diseased tissues with normal stem cells |
| Entrez ID | Symbol | Replicates | Species | Organ | Tissue | Adj P-value | Log2FC | Malignancy |
| 54097 | FAM3B | HTA11_1938_2000001011 | Human | Colorectum | AD | 5.34e-13 | 4.12e-01 | -0.0811 |
| 54097 | FAM3B | HTA11_78_2000001011 | Human | Colorectum | AD | 8.27e-04 | 2.13e-01 | -0.1088 |
| 54097 | FAM3B | HTA11_83_2000001011 | Human | Colorectum | SER | 2.22e-11 | 4.13e-01 | -0.1526 |
| 54097 | FAM3B | HTA11_7663_2000001011 | Human | Colorectum | SER | 7.69e-08 | 5.14e-01 | 0.0131 |
| 54097 | FAM3B | HTA11_6801_2000001011 | Human | Colorectum | SER | 5.16e-06 | 4.67e-01 | 0.0171 |
| 54097 | FAM3B | HTA11_99999974143_84620 | Human | Colorectum | MSS | 2.36e-31 | 6.94e-01 | 0.3005 |
| 54097 | FAM3B | LZE7T | Human | Esophagus | ESCC | 6.82e-03 | 3.22e-01 | 0.0667 |
| 54097 | FAM3B | LZE22D1 | Human | Esophagus | HGIN | 3.27e-07 | 4.98e-01 | 0.0595 |
| 54097 | FAM3B | LZE22T | Human | Esophagus | ESCC | 9.22e-05 | 4.99e-01 | 0.068 |
| 54097 | FAM3B | LZE24T | Human | Esophagus | ESCC | 1.95e-10 | 4.15e-01 | 0.0596 |
| 54097 | FAM3B | LZE21T | Human | Esophagus | ESCC | 9.14e-03 | 4.58e-01 | 0.0655 |
| 54097 | FAM3B | P1T-E | Human | Esophagus | ESCC | 2.20e-08 | 9.13e-01 | 0.0875 |
| 54097 | FAM3B | P4T-E | Human | Esophagus | ESCC | 3.32e-21 | 4.97e-01 | 0.1323 |
| 54097 | FAM3B | P8T-E | Human | Esophagus | ESCC | 2.44e-30 | 6.93e-01 | 0.0889 |
| 54097 | FAM3B | P9T-E | Human | Esophagus | ESCC | 1.25e-02 | -2.13e-02 | 0.1131 |
| 54097 | FAM3B | P10T-E | Human | Esophagus | ESCC | 1.94e-03 | -1.06e-02 | 0.116 |
| 54097 | FAM3B | P23T-E | Human | Esophagus | ESCC | 9.34e-16 | 1.25e+00 | 0.108 |
| 54097 | FAM3B | P26T-E | Human | Esophagus | ESCC | 3.20e-07 | 3.29e-01 | 0.1276 |
| 54097 | FAM3B | P27T-E | Human | Esophagus | ESCC | 1.39e-66 | 1.43e+00 | 0.1055 |
| 54097 | FAM3B | P28T-E | Human | Esophagus | ESCC | 3.60e-52 | 1.24e+00 | 0.1149 |
| Page: 1 2 3 4 5 |
| Tissue | Expression Dynamics | Abbreviation |
| Colorectum (GSE201348) |  | FAP: Familial adenomatous polyposis |
| CRC: Colorectal cancer | ||
| Colorectum (HTA11) |  | AD: Adenomas |
| SER: Sessile serrated lesions | ||
| MSI-H: Microsatellite-high colorectal cancer | ||
| MSS: Microsatellite stable colorectal cancer | ||
| Esophagus |  | ESCC: Esophageal squamous cell carcinoma |
| HGIN: High-grade intraepithelial neoplasias | ||
| LGIN: Low-grade intraepithelial neoplasias | ||
| GC | 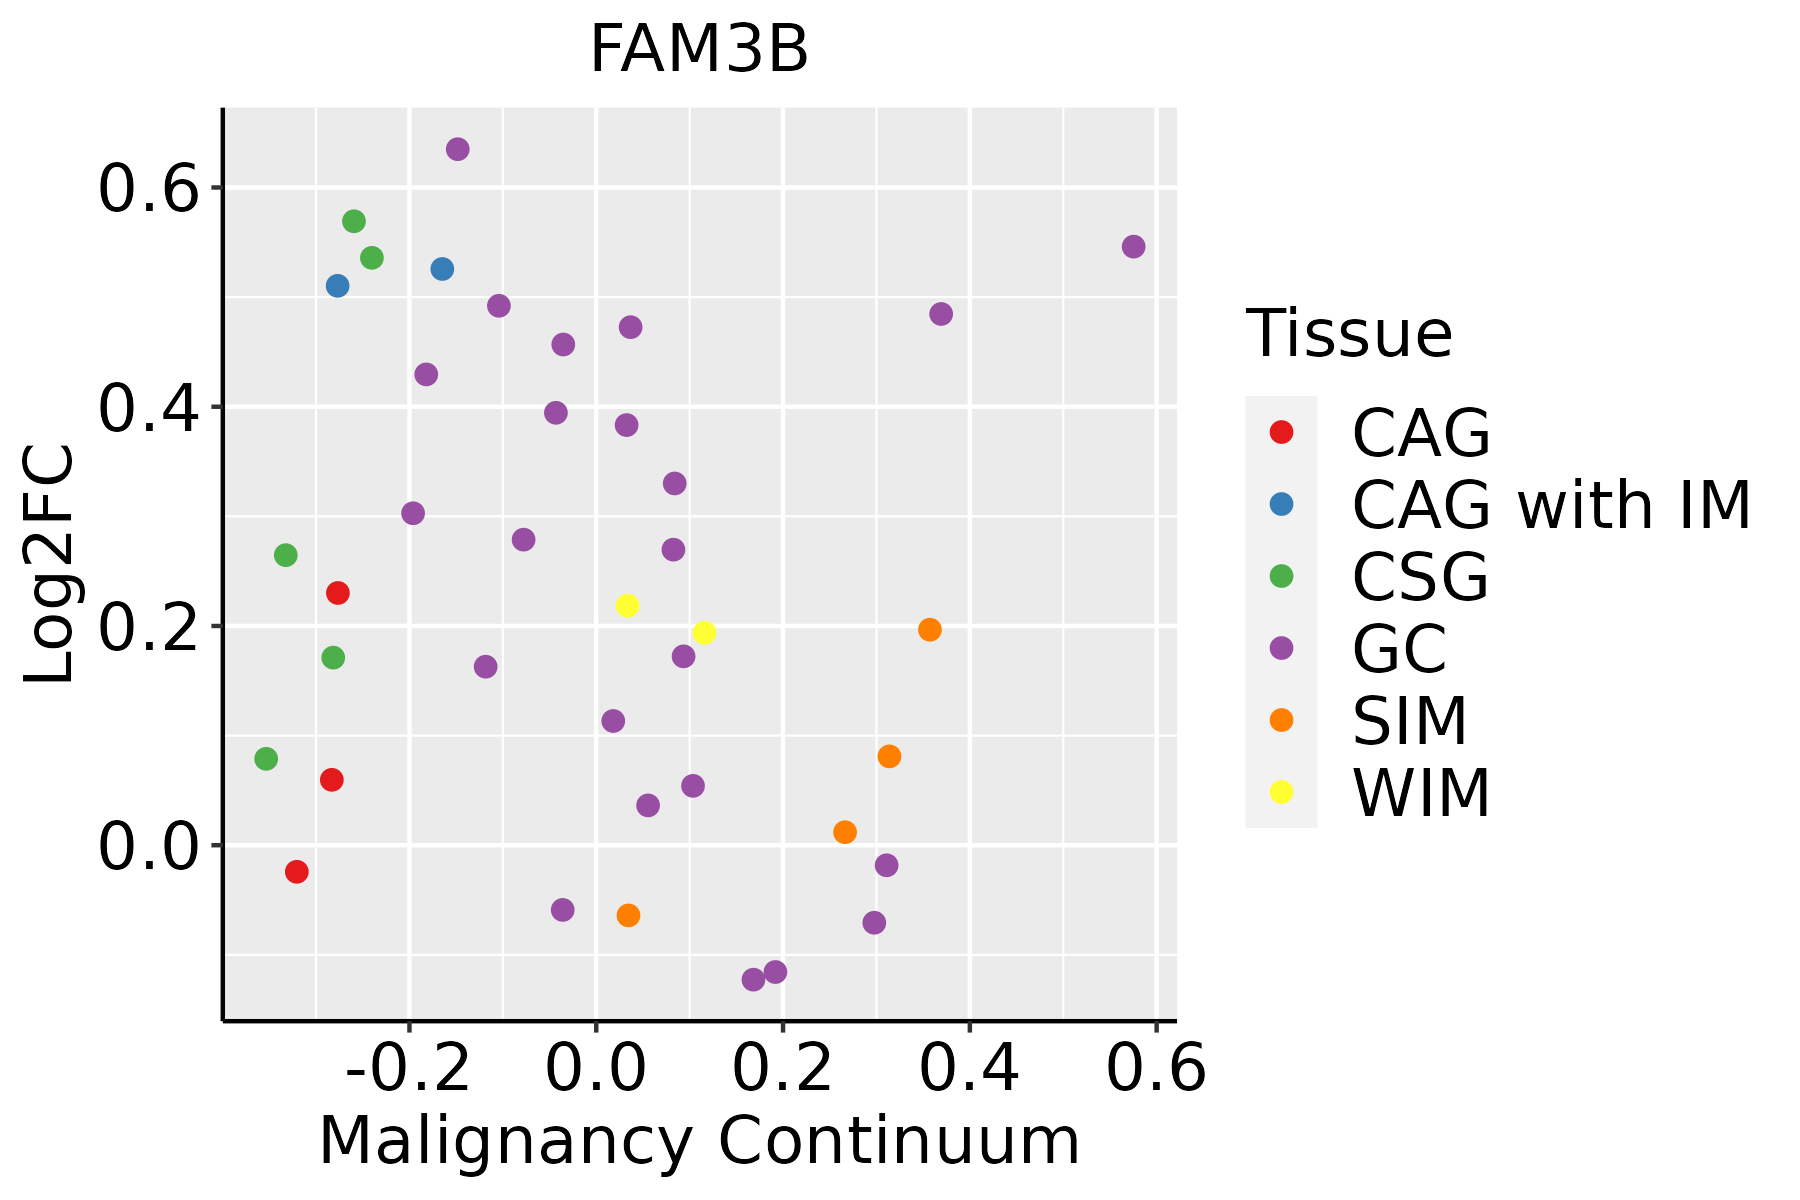 | CAG: Chronic atrophic gastritis |
| CAG with IM: Chronic atrophic gastritis with intestinal metaplasia | ||
| CSG: Chronic superficial gastritis | ||
| GC: Gastric cancer | ||
| SIM: Severe intestinal metaplasia | ||
| WIM: Wild intestinal metaplasia | ||
| Liver |  | HCC: Hepatocellular carcinoma |
| NAFLD: Non-alcoholic fatty liver disease | ||
| Oral Cavity |  | EOLP: Erosive Oral lichen planus |
| LP: leukoplakia | ||
| NEOLP: Non-erosive oral lichen planus | ||
| OSCC: Oral squamous cell carcinoma | ||
| Prostate |  | BPH: Benign Prostatic Hyperplasia |
| ∗log2FC in expression of this searched gene in stem-like cells from each diseased tissue sample relative to stem-like cells in normal samples in each tissue plotted against the malignancy continuum. Samples are colored based on if they are from different disease stage. |
Top |
Malignant transformation related pathway analysis |
| Find out the enriched GO biological processes and KEGG pathways involved in transition from healthy to precancer to cancer |
| Tissue | Disease Stage | Enriched GO biological Processes |
| Colorectum | AD |  |
| Colorectum | SER |  |
| Colorectum | MSS |  |
| Colorectum | MSI-H |  |
| Colorectum | FAP |  |
| ∗Top 15 enriched GO BP terms are showed in the bar plot of each disease state in each tissue. Each row represents a significant GO biological process which is colored according to the -log10(p.adjust). |
| Page: 1 2 3 4 5 6 7 8 9 |
| GO ID | Tissue | Disease Stage | Description | Gene Ratio | Bg Ratio | pvalue | p.adjust | Count |
| GO:0033500 | Colorectum | AD | carbohydrate homeostasis | 84/3918 | 259/18723 | 9.10e-06 | 2.15e-04 | 84 |
| GO:0042593 | Colorectum | AD | glucose homeostasis | 83/3918 | 258/18723 | 1.44e-05 | 3.11e-04 | 83 |
| GO:0009306 | Colorectum | AD | protein secretion | 105/3918 | 359/18723 | 1.05e-04 | 1.57e-03 | 105 |
| GO:0035592 | Colorectum | AD | establishment of protein localization to extracellular region | 105/3918 | 360/18723 | 1.18e-04 | 1.73e-03 | 105 |
| GO:0071692 | Colorectum | AD | protein localization to extracellular region | 106/3918 | 368/18723 | 1.86e-04 | 2.49e-03 | 106 |
| GO:0030073 | Colorectum | AD | insulin secretion | 61/3918 | 195/18723 | 4.28e-04 | 4.81e-03 | 61 |
| GO:0015833 | Colorectum | AD | peptide transport | 77/3918 | 264/18723 | 8.90e-04 | 8.60e-03 | 77 |
| GO:0030072 | Colorectum | AD | peptide hormone secretion | 68/3918 | 236/18723 | 2.39e-03 | 1.85e-02 | 68 |
| GO:0002790 | Colorectum | AD | peptide secretion | 69/3918 | 242/18723 | 2.97e-03 | 2.22e-02 | 69 |
| GO:0042886 | Colorectum | AD | amide transport | 83/3918 | 301/18723 | 3.37e-03 | 2.46e-02 | 83 |
| GO:00093061 | Colorectum | SER | protein secretion | 79/2897 | 359/18723 | 5.99e-04 | 8.19e-03 | 79 |
| GO:00355921 | Colorectum | SER | establishment of protein localization to extracellular region | 79/2897 | 360/18723 | 6.54e-04 | 8.77e-03 | 79 |
| GO:00716921 | Colorectum | SER | protein localization to extracellular region | 80/2897 | 368/18723 | 8.13e-04 | 1.01e-02 | 80 |
| GO:00300731 | Colorectum | SER | insulin secretion | 46/2897 | 195/18723 | 1.86e-03 | 1.90e-02 | 46 |
| GO:00425931 | Colorectum | SER | glucose homeostasis | 57/2897 | 258/18723 | 2.92e-03 | 2.59e-02 | 57 |
| GO:00158331 | Colorectum | SER | peptide transport | 58/2897 | 264/18723 | 3.08e-03 | 2.70e-02 | 58 |
| GO:00335001 | Colorectum | SER | carbohydrate homeostasis | 57/2897 | 259/18723 | 3.20e-03 | 2.76e-02 | 57 |
| GO:00335002 | Colorectum | MSS | carbohydrate homeostasis | 76/3467 | 259/18723 | 1.37e-05 | 3.14e-04 | 76 |
| GO:00425932 | Colorectum | MSS | glucose homeostasis | 75/3467 | 258/18723 | 2.22e-05 | 4.69e-04 | 75 |
| GO:00093062 | Colorectum | MSS | protein secretion | 98/3467 | 359/18723 | 2.43e-05 | 5.09e-04 | 98 |
| Page: 1 2 3 4 |
| Pathway ID | Tissue | Disease Stage | Description | Gene Ratio | Bg Ratio | pvalue | p.adjust | qvalue | Count |
| Page: 1 |
Top |
Cell-cell communication analysis |
| Identification of potential cell-cell interactions between two cell types and their ligand-receptor pairs for different disease states |
| Ligand | Receptor | LRpair | Pathway | Tissue | Disease Stage |
| Page: 1 |
Top |
Single-cell gene regulatory network inference analysis |
| Find out the significant the regulons (TFs) and the target genes of each regulon across cell types for different disease states |
| TF | Cell Type | Tissue | Disease Stage | Target Gene | RSS | Regulon Activity |
| ∗The dot plots of a searched regulon are shown for all cell subpopulations in each disease state of each tissue based on the regulon specific score inferred using pySCENIC and by calculating the average expression. |
| Page: 1 |
Top |
Somatic mutation of malignant transformation related genes |
| Annotation of somatic variants for genes involved in malignant transformation |
| Hugo Symbol | Variant Class | Variant Classification | dbSNP RS | HGVSc | HGVSp | HGVSp Short | SWISSPROT | BIOTYPE | SIFT | PolyPhen | Tumor Sample Barcode | Tissue | Histology | Sex | Age | Stage | Therapy Types | Drugs | Outcome |
| FAM3B | SNV | Missense_Mutation | novel | c.700N>G | p.Arg234Gly | p.R234G | P58499 | protein_coding | tolerated_low_confidence(0.3) | benign(0.007) | TCGA-AQ-A54N-01 | Breast | breast invasive carcinoma | Female | <65 | I/II | Unknown | Unknown | SD |
| FAM3B | insertion | Nonsense_Mutation | novel | c.527_528insACCAGAATAGGAGAAAGTAGGTCATTTTGCTAGACT | p.Ser176delinsArgProGluTerGluLysValGlyHisPheAlaArgLeu | p.S176delinsRPE*EKVGHFARL | P58499 | protein_coding | TCGA-AN-A0FX-01 | Breast | breast invasive carcinoma | Female | <65 | I/II | Unknown | Unknown | SD | ||
| FAM3B | SNV | Missense_Mutation | novel | c.644N>G | p.Asn215Ser | p.N215S | P58499 | protein_coding | deleterious(0.01) | probably_damaging(0.996) | TCGA-VS-A9V0-01 | Cervix | cervical & endocervical cancer | Female | <65 | I/II | Chemotherapy | cisplatin | PD |
| FAM3B | SNV | Missense_Mutation | rs369029304 | c.293T>C | p.Met98Thr | p.M98T | P58499 | protein_coding | tolerated(0.16) | benign(0.044) | TCGA-A6-2680-01 | Colorectum | colon adenocarcinoma | Female | >=65 | I/II | Unknown | Unknown | SD |
| FAM3B | SNV | Missense_Mutation | c.142N>T | p.Gly48Trp | p.G48W | P58499 | protein_coding | deleterious(0) | probably_damaging(0.994) | TCGA-D5-6530-01 | Colorectum | colon adenocarcinoma | Male | <65 | I/II | Unknown | Unknown | SD | |
| FAM3B | SNV | Missense_Mutation | c.329A>G | p.Asn110Ser | p.N110S | P58499 | protein_coding | deleterious(0.02) | probably_damaging(0.979) | TCGA-A5-A0GP-01 | Endometrium | uterine corpus endometrioid carcinoma | Female | <65 | I/II | Unknown | Unknown | SD | |
| FAM3B | SNV | Missense_Mutation | c.434C>T | p.Ala145Val | p.A145V | P58499 | protein_coding | tolerated(0.08) | benign(0.031) | TCGA-A5-A0VP-01 | Endometrium | uterine corpus endometrioid carcinoma | Female | >=65 | I/II | Unknown | Unknown | SD | |
| FAM3B | SNV | Missense_Mutation | rs556115707 | c.262N>A | p.Ala88Thr | p.A88T | P58499 | protein_coding | deleterious(0.03) | probably_damaging(0.976) | TCGA-AX-A2HD-01 | Endometrium | uterine corpus endometrioid carcinoma | Female | >=65 | III/IV | Unknown | Unknown | SD |
| FAM3B | SNV | Missense_Mutation | novel | c.101N>G | p.Asp34Gly | p.D34G | P58499 | protein_coding | deleterious(0.04) | benign(0.153) | TCGA-BS-A0UJ-01 | Endometrium | uterine corpus endometrioid carcinoma | Female | >=65 | I/II | Unknown | Unknown | SD |
| FAM3B | SNV | Missense_Mutation | rs750575195 | c.509N>T | p.Ala170Val | p.A170V | P58499 | protein_coding | tolerated(0.55) | benign(0.013) | TCGA-EY-A548-01 | Endometrium | uterine corpus endometrioid carcinoma | Female | >=65 | I/II | Unknown | Unknown | SD |
| Page: 1 2 |
Top |
Related drugs of malignant transformation related genes |
| Identification of chemicals and drugs interact with genes involved in malignant transfromation |
| (DGIdb 4.0) |
| Entrez ID | Symbol | Category | Interaction Types | Drug Claim Name | Drug Name | PMIDs |
| Page: 1 |

Copyright 2023-Present -The University of Texas Health Science Center at Houston |