Schematic overview of the cellular and molecular mechanisms involved in the cancer progression, including the proposed cellular and molecular mechanisms in cancer cells trajectory. AT1: alveolar type 1 cells; AT2: alveolar type 2 cells; AAH: atypical adenomatous hyperplasia; AIS: adenocarcinoma in situ; MIA: minimally invasive adenocarcinoma; IA: invasive adenocarcinoma; EMT: epithelial-mesenchymal transition

Home

Download

Statistics

Help

Contact

Center for Computational Systems Medicine
leaf

Gene summary

leaf

Malignant transformation analysis

leaf

Malignant transformation related pathway analysis

leaf

Cell-cell communication analysis

leaf

Single-cell gene regulatory network inference analysis

leaf

Somatic mutation of malignant transformation related genes

leaf

Related drugs of malignant transformation related genes

Gene: FAM3A

Gene summary for FAM3A

check button Gene summary.

Gene informationSpeciesHuman
Gene symbol

FAM3A

Gene ID

60343

Gene nameFAM3 metabolism regulating signaling molecule A
Gene Alias2.19
CytomapXq28
Gene Typeprotein-coding
GO ID

GO:0002376

UniProtAcc

P98173


Top

Malignant transformation analysis

check button Identification of the aberrant gene expression in precancerous and cancerous lesions by comparing the gene expression of stem-like cells in diseased tissues with normal stem cells
check button Malignant transformation involving gene list.
Entrez IDSymbolReplicatesSpeciesOrganTissueAdj P-valueLog2FCMalignancy
60343FAM3ALZE2THumanEsophagusESCC1.19e-075.92e-010.082
60343FAM3ALZE4THumanEsophagusESCC3.10e-122.76e-010.0811
60343FAM3ALZE7THumanEsophagusESCC4.96e-106.52e-010.0667
60343FAM3ALZE8THumanEsophagusESCC4.28e-092.57e-010.067
60343FAM3ALZE20THumanEsophagusESCC9.24e-134.40e-010.0662
60343FAM3ALZE22THumanEsophagusESCC8.71e-066.35e-010.068
60343FAM3ALZE24THumanEsophagusESCC9.46e-381.15e+000.0596
60343FAM3ALZE21THumanEsophagusESCC8.53e-074.68e-010.0655
60343FAM3ALZE6THumanEsophagusESCC4.80e-041.12e-010.0845
60343FAM3AP1T-EHumanEsophagusESCC7.76e-321.24e+000.0875
60343FAM3AP2T-EHumanEsophagusESCC6.63e-457.42e-010.1177
60343FAM3AP4T-EHumanEsophagusESCC2.64e-367.47e-010.1323
60343FAM3AP5T-EHumanEsophagusESCC6.15e-202.80e-010.1327
60343FAM3AP8T-EHumanEsophagusESCC4.42e-315.38e-010.0889
60343FAM3AP9T-EHumanEsophagusESCC3.03e-266.38e-010.1131
60343FAM3AP10T-EHumanEsophagusESCC1.01e-548.02e-010.116
60343FAM3AP11T-EHumanEsophagusESCC1.67e-187.18e-010.1426
60343FAM3AP12T-EHumanEsophagusESCC2.07e-569.65e-010.1122
60343FAM3AP15T-EHumanEsophagusESCC5.59e-406.34e-010.1149
60343FAM3AP16T-EHumanEsophagusESCC2.64e-253.91e-010.1153
Page: 1 2 3 4 5 6 

check button Transcriptomic changes along malignancy continuum.
TissueExpression DynamicsAbbreviation
EsophagusThe image shows the transcriptomic changes along malignancy continuum.log2FC in expression of this searched gene in stem-like cells from each diseased tissue sample relative to stem-like cells in normal samples in each tissue plotted against the malignancy continuum. Samples are colored based on if they are from different disease stage.
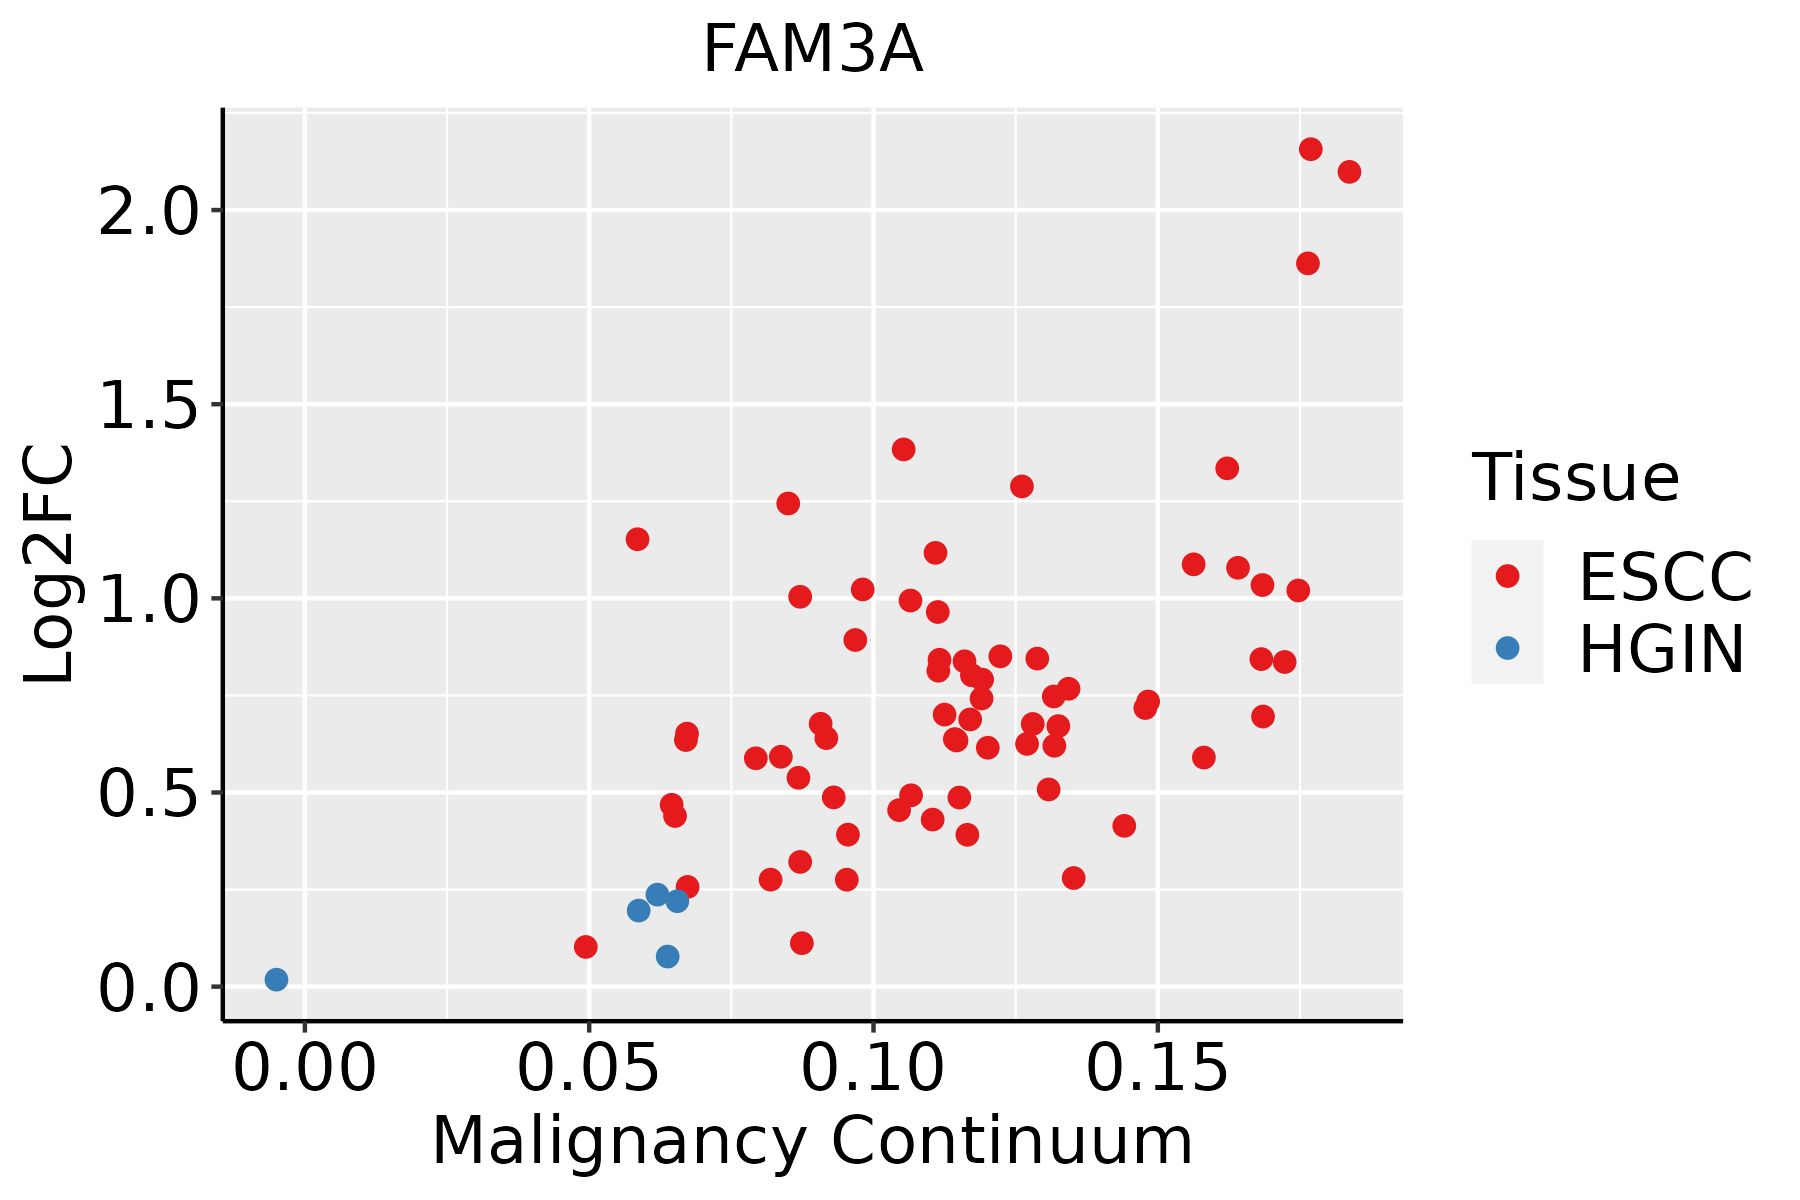
ESCC: Esophageal squamous cell carcinoma
HGIN: High-grade intraepithelial neoplasias
LGIN: Low-grade intraepithelial neoplasias
LiverThe image shows the transcriptomic changes along malignancy continuum.log2FC in expression of this searched gene in stem-like cells from each diseased tissue sample relative to stem-like cells in normal samples in each tissue plotted against the malignancy continuum. Samples are colored based on if they are from different disease stage.HCC: Hepatocellular carcinoma
NAFLD: Non-alcoholic fatty liver disease
Oral CavityThe image shows the transcriptomic changes along malignancy continuum.log2FC in expression of this searched gene in stem-like cells from each diseased tissue sample relative to stem-like cells in normal samples in each tissue plotted against the malignancy continuum. Samples are colored based on if they are from different disease stage.
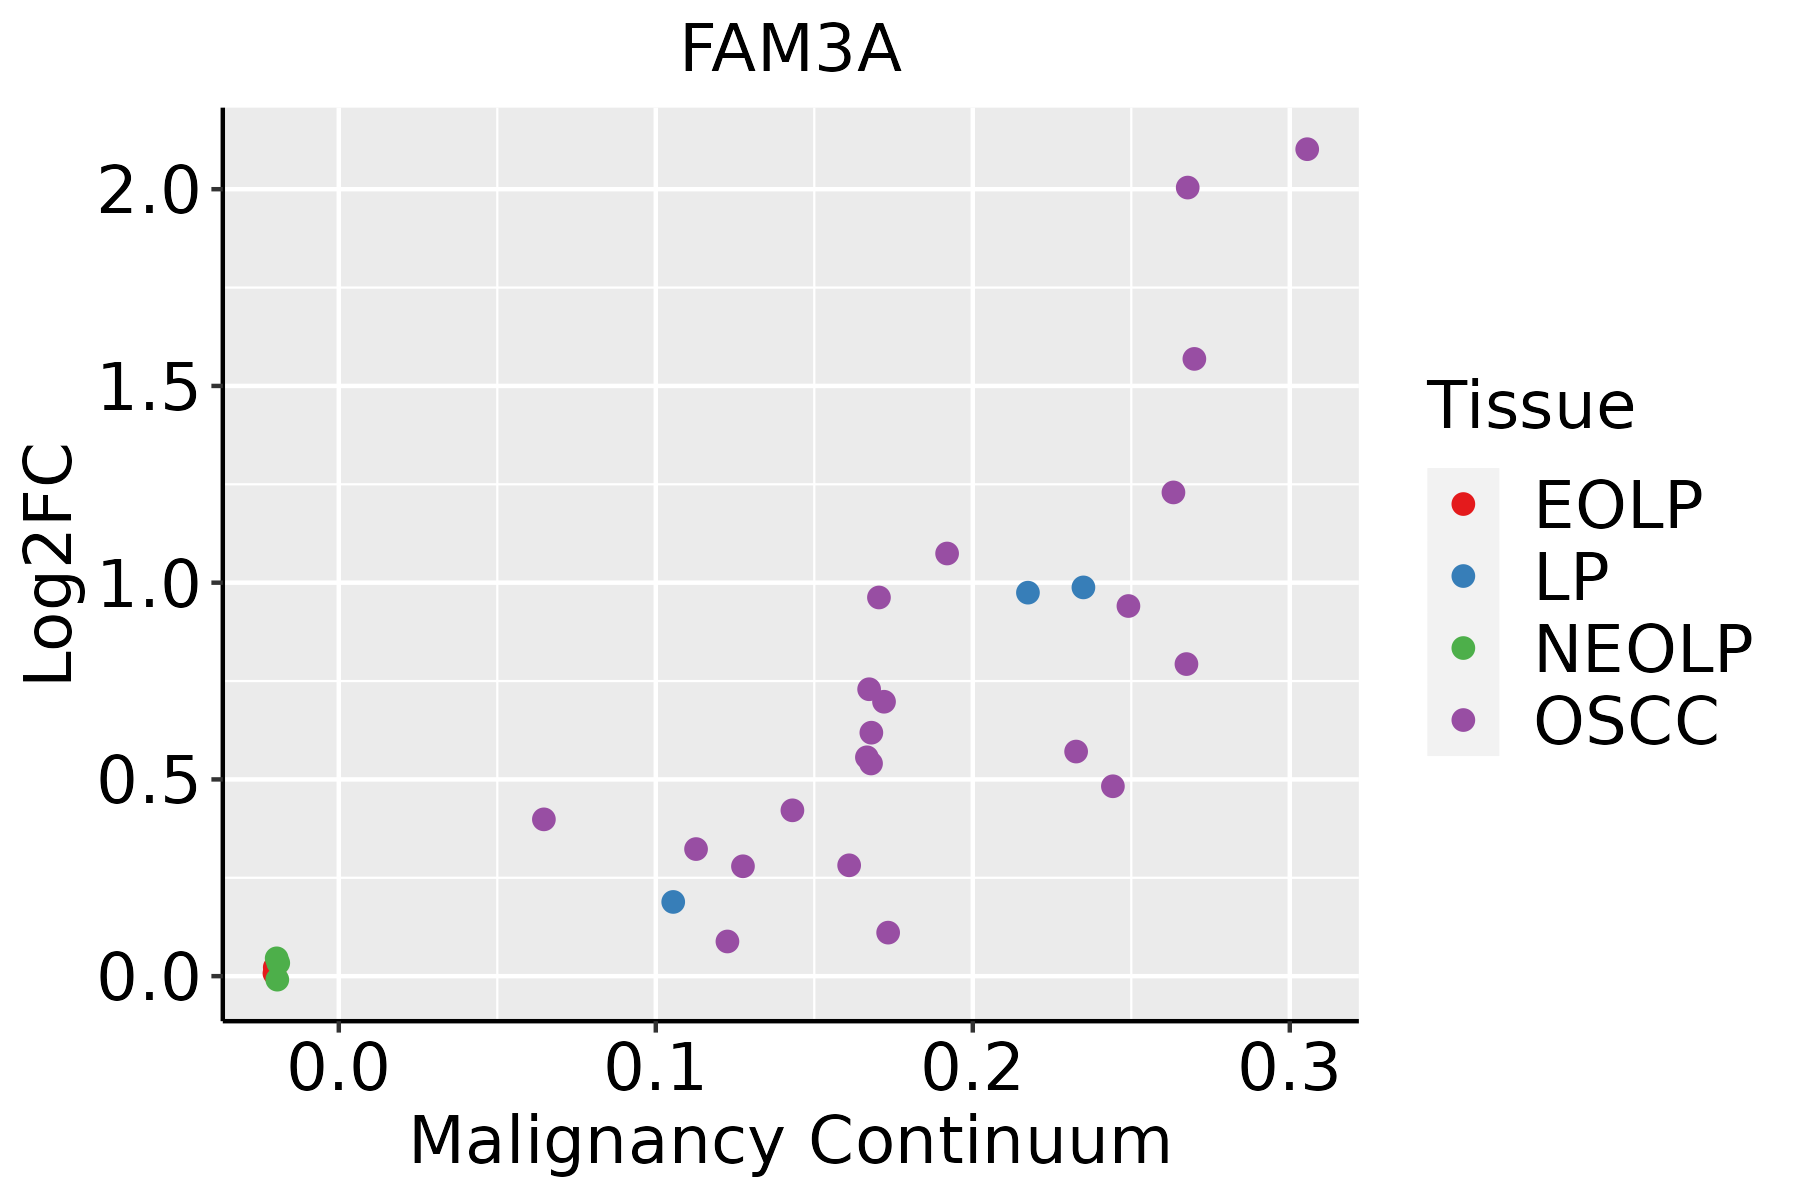
EOLP: Erosive Oral lichen planus
LP: leukoplakia
NEOLP: Non-erosive oral lichen planus
OSCC: Oral squamous cell carcinoma
SkinThe image shows the transcriptomic changes along malignancy continuum.log2FC in expression of this searched gene in stem-like cells from each diseased tissue sample relative to stem-like cells in normal samples in each tissue plotted against the malignancy continuum. Samples are colored based on if they are from different disease stage.
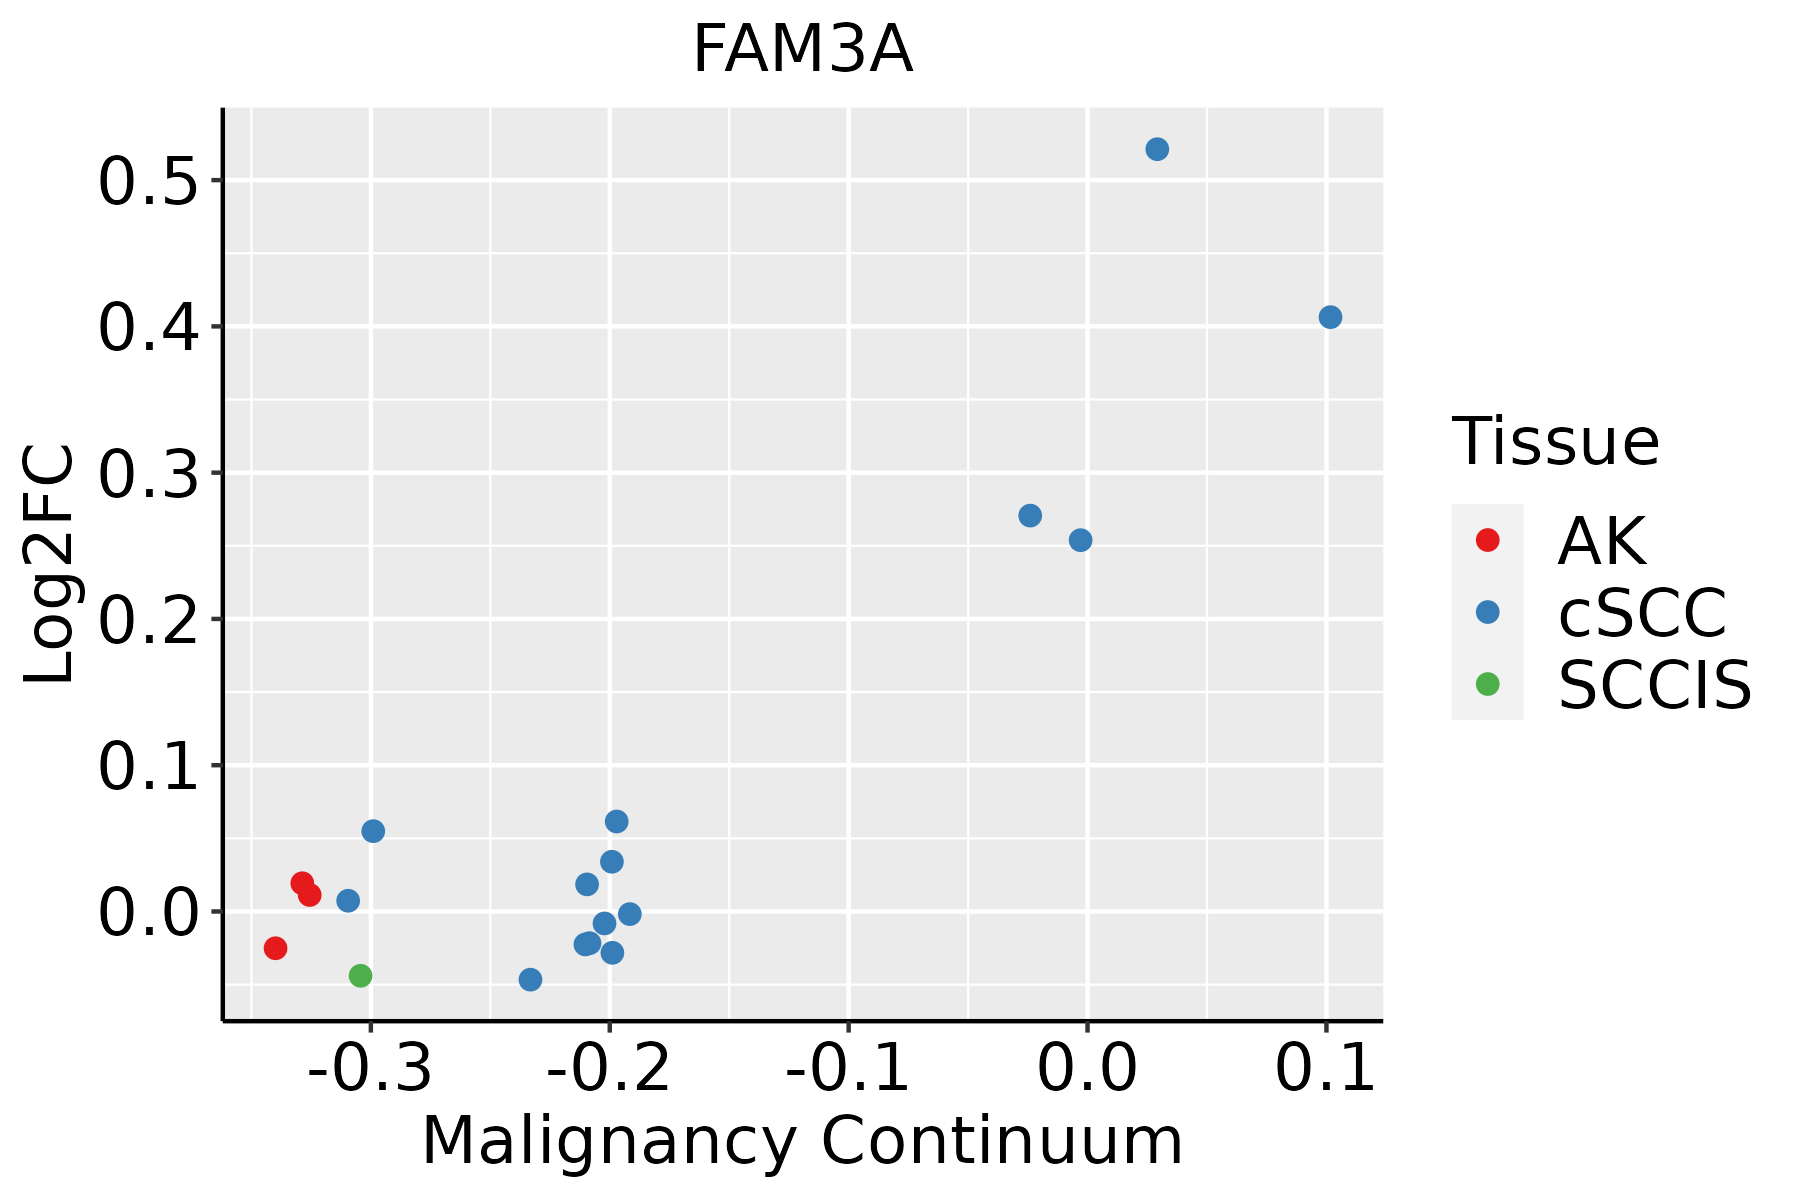
AK: Actinic keratosis
cSCC: Cutaneous squamous cell carcinoma
SCCIS:squamous cell carcinoma in situ
ThyroidThe image shows the transcriptomic changes along malignancy continuum.log2FC in expression of this searched gene in stem-like cells from each diseased tissue sample relative to stem-like cells in normal samples in each tissue plotted against the malignancy continuum. Samples are colored based on if they are from different disease stage.
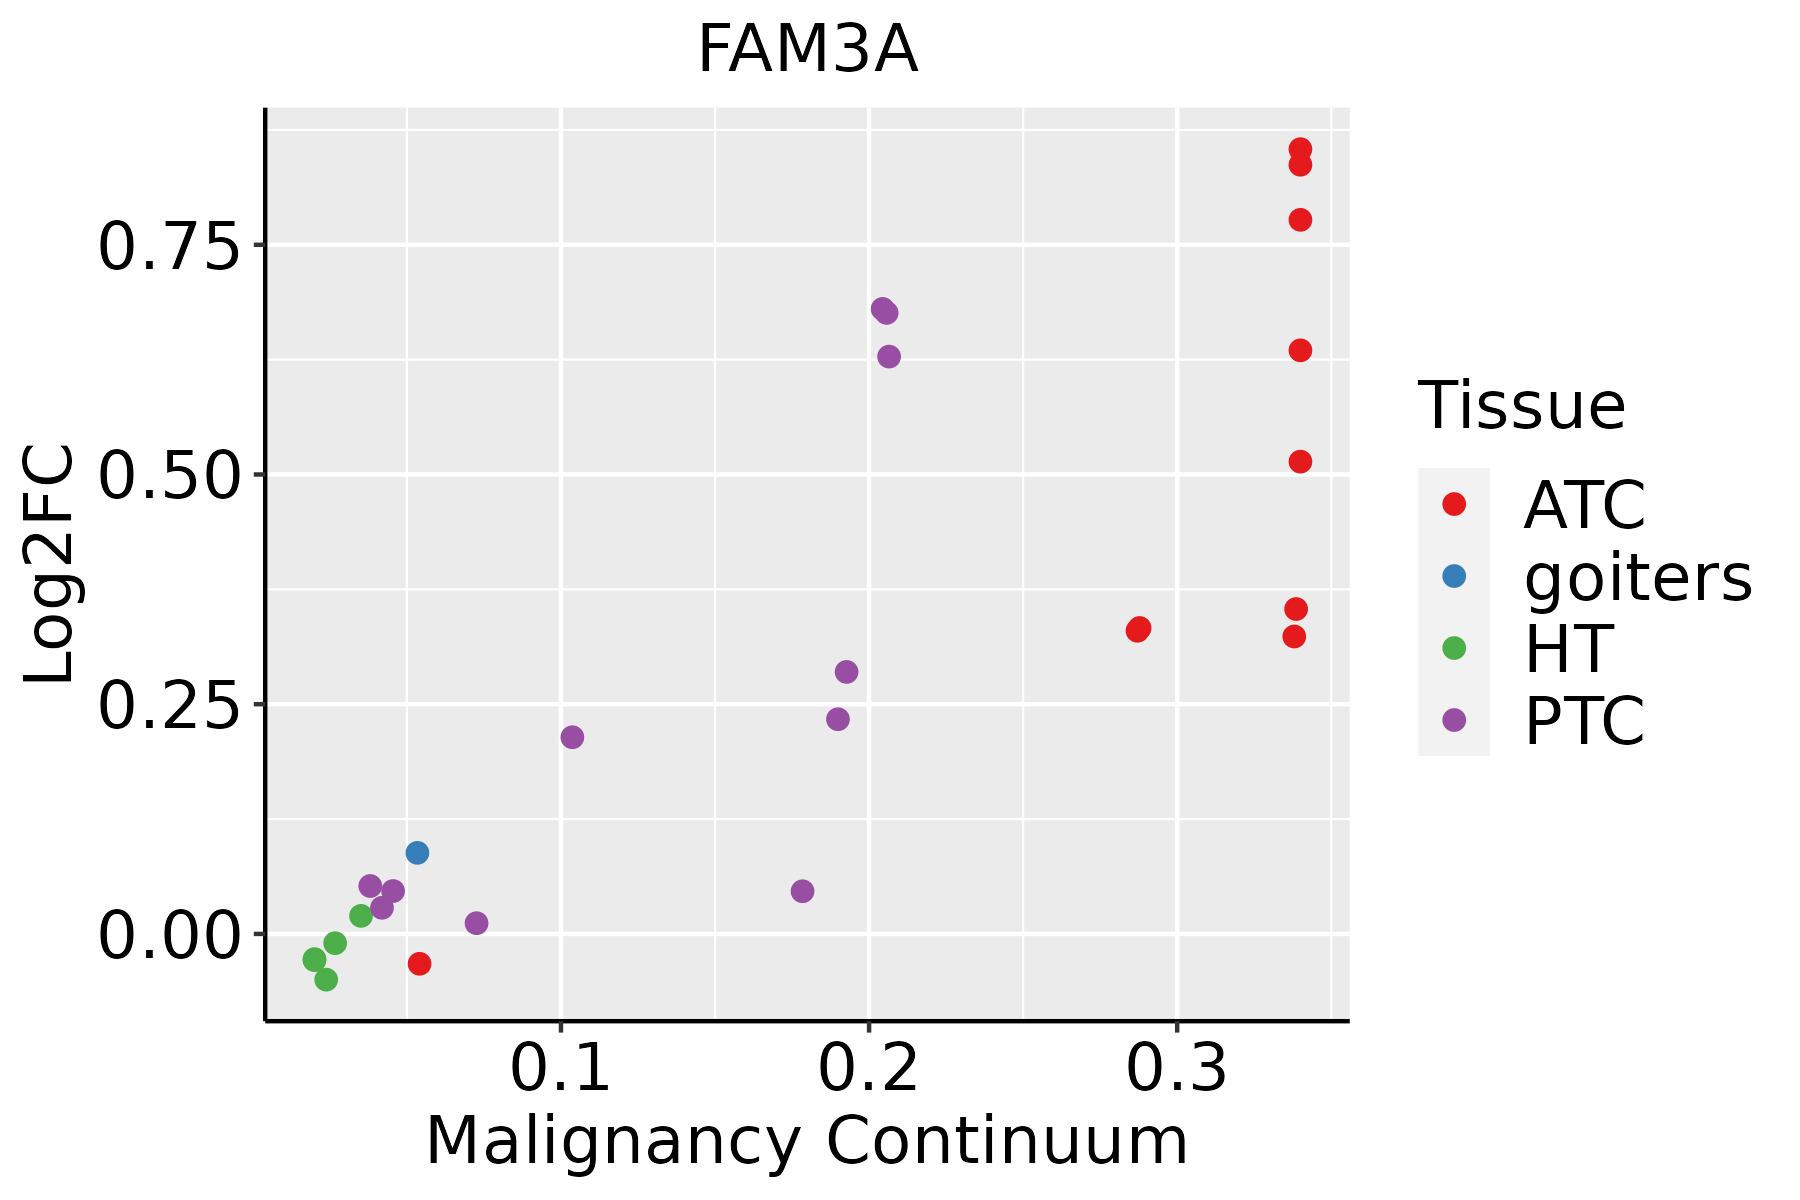
ATC: Anaplastic thyroid cancer
HT: Hashimoto's thyroiditis
PTC: Papillary thyroid cancer
∗log2FC in expression of this searched gene in stem-like cells from each diseased tissue sample relative to stem-like cells in normal samples in each tissue plotted against the malignancy continuum. Samples are colored based on if they are from different disease stage.

Top

Malignant transformation related pathway analysis

check buttonFind out the enriched GO biological processes and KEGG pathways involved in transition from healthy to precancer to cancer
check button Figure of enriched GO biological processes.
TissueDisease StageEnriched GO biological Processes
ColorectumADGO analysis - Figure of enriched GO biological processes: Top 15 enriched GO BP terms are showed in the bar plot of each disease state in each tissue. Each row represents a significant GO biological process which is colored according to the -log10(p.adjust).
ColorectumSERGO analysis - Figure of enriched GO biological processes: Top 15 enriched GO BP terms are showed in the bar plot of each disease state in each tissue. Each row represents a significant GO biological process which is colored according to the -log10(p.adjust).
ColorectumMSSGO analysis - Figure of enriched GO biological processes: Top 15 enriched GO BP terms are showed in the bar plot of each disease state in each tissue. Each row represents a significant GO biological process which is colored according to the -log10(p.adjust).
ColorectumMSI-HGO analysis - Figure of enriched GO biological processes: Top 15 enriched GO BP terms are showed in the bar plot of each disease state in each tissue. Each row represents a significant GO biological process which is colored according to the -log10(p.adjust).
ColorectumFAPGO analysis - Figure of enriched GO biological processes: Top 15 enriched GO BP terms are showed in the bar plot of each disease state in each tissue. Each row represents a significant GO biological process which is colored according to the -log10(p.adjust).
∗Top 15 enriched GO BP terms are showed in the bar plot of each disease state in each tissue. Each row represents a significant GO biological process which is colored according to the -log10(p.adjust).
Page: 1 2 3 4 5 6 7 8 9 

check button Enriched GO biological processes.
GO IDTissueDisease StageDescriptionGene RatioBg Ratiopvaluep.adjustCount
GO:00059969EsophagusESCCmonosaccharide metabolic process159/8552257/187231.11e-071.81e-06159
GO:00193189EsophagusESCChexose metabolic process147/8552237/187232.63e-073.94e-06147
GO:00028318EsophagusESCCregulation of response to biotic stimulus191/8552327/187232.12e-062.45e-05191
GO:000283212EsophagusESCCnegative regulation of response to biotic stimulus72/8552108/187238.36e-068.11e-0572
GO:00060069EsophagusESCCglucose metabolic process119/8552196/187231.51e-051.36e-04119
GO:00442626EsophagusESCCcellular carbohydrate metabolic process160/8552283/187231.43e-049.66e-04160
GO:00160514EsophagusESCCcarbohydrate biosynthetic process117/8552202/187232.96e-041.79e-03117
GO:00620129EsophagusESCCregulation of small molecule metabolic process184/8552334/187233.11e-041.85e-03184
GO:00450885EsophagusESCCregulation of innate immune response125/8552218/187233.34e-041.96e-03125
GO:00507775EsophagusESCCnegative regulation of immune response112/8552194/187234.67e-042.62e-03112
GO:000268316EsophagusESCCnegative regulation of immune system process231/8552434/187238.48e-044.36e-03231
GO:00463643EsophagusESCCmonosaccharide biosynthetic process52/855282/187239.03e-044.61e-0352
GO:00109065EsophagusESCCregulation of glucose metabolic process71/8552119/187231.46e-036.92e-0371
GO:00193193EsophagusESCChexose biosynthetic process49/855278/187231.69e-037.81e-0349
GO:00061096EsophagusESCCregulation of carbohydrate metabolic process101/8552178/187231.89e-038.52e-03101
GO:00458245EsophagusESCCnegative regulation of innate immune response45/855271/187231.98e-038.90e-0345
GO:00106755EsophagusESCCregulation of cellular carbohydrate metabolic process83/8552146/187234.24e-031.69e-0283
GO:00060943EsophagusESCCgluconeogenesis46/855275/187234.54e-031.78e-0246
GO:00192168EsophagusESCCregulation of lipid metabolic process172/8552331/187231.20e-024.02e-02172
GO:000599612LiverCirrhoticmonosaccharide metabolic process104/4634257/187231.74e-086.32e-07104
Page: 1 2 3 4 5 6 

check button Enriched KEGG pathways.
Pathway IDTissueDisease StageDescriptionGene RatioBg Ratiopvaluep.adjustqvalueCount
Page: 1 

Top

Cell-cell communication analysis

check buttonIdentification of potential cell-cell interactions between two cell types and their ligand-receptor pairs for different disease states
LigandReceptorLRpairPathwayTissueDisease Stage
Page: 1 

Top

Single-cell gene regulatory network inference analysis

check buttonFind out the significant the regulons (TFs) and the target genes of each regulon across cell types for different disease states
TFCell TypeTissueDisease StageTarget GeneRSSRegulon Activity
∗The dot plots of a searched regulon are shown for all cell subpopulations in each disease state of each tissue based on the regulon specific score inferred using pySCENIC and by calculating the average expression.
Page: 1 

Top

Somatic mutation of malignant transformation related genes

check buttonAnnotation of somatic variants for genes involved in malignant transformation
Hugo SymbolVariant ClassVariant ClassificationdbSNP RSHGVScHGVSpHGVSp ShortSWISSPROTBIOTYPESIFTPolyPhenTumor Sample BarcodeTissueHistologySexAgeStageTherapy TypesDrugsOutcome
FAM3ASNVMissense_Mutationnovelc.416N>Ap.Met139Lysp.M139Kprotein_codingdeleterious(0)probably_damaging(0.962)TCGA-GI-A2C9-01Breastbreast invasive carcinomaFemale<65I/IIUnspecificSD
FAM3AdeletionFrame_Shift_Delnovelc.694delGp.Glu232ArgfsTer163p.E232Rfs*163protein_codingTCGA-D8-A27V-01Breastbreast invasive carcinomaFemale<65I/IIHormone TherapytamoxiphenSD
FAM3ASNVMissense_Mutationrs35985994c.7N>Tp.Arg3Cysp.R3Cprotein_codingdeleterious_low_confidence(0)benign(0)TCGA-AA-3663-01Colorectumcolon adenocarcinomaMale<65I/IIUnknownUnknownSD
FAM3ASNVMissense_Mutationc.350G>Ap.Arg117Hisp.R117Hprotein_codingdeleterious(0.04)probably_damaging(0.997)TCGA-WS-AB45-01Colorectumcolon adenocarcinomaFemale<65I/IIUnknownUnknownSD
FAM3ASNVMissense_Mutationnovelc.182N>Tp.Ser61Leup.S61Lprotein_codingtolerated(0.12)benign(0.006)TCGA-AP-A1DV-01Endometriumuterine corpus endometrioid carcinomaFemale<65I/IIUnknownUnknownSD
FAM3ASNVMissense_Mutationnovelc.601N>Ap.Gly201Argp.G201Rprotein_codingdeleterious(0)probably_damaging(1)TCGA-AX-A3FT-01Endometriumuterine corpus endometrioid carcinomaFemale<65I/IIUnknownUnknownSD
FAM3ASNVMissense_Mutationnovelc.588N>Ap.Ser196Argp.S196Rprotein_codingdeleterious(0)probably_damaging(0.986)TCGA-B5-A0JY-01Endometriumuterine corpus endometrioid carcinomaFemale<65III/IVChemotherapydoxorubicinSD
FAM3ASNVMissense_Mutationnovelc.467N>Gp.Glu156Glyp.E156Gprotein_codingtolerated(0.14)benign(0.054)TCGA-D1-A175-01Endometriumuterine corpus endometrioid carcinomaFemale<65I/IIChemotherapypaclitaxelSD
FAM3ASNVMissense_Mutationc.715N>Tp.Arg239Trpp.R239Wprotein_codingdeleterious(0)probably_damaging(0.921)TCGA-D1-A17Q-01Endometriumuterine corpus endometrioid carcinomaFemale<65I/IIUnknownUnknownSD
FAM3ASNVMissense_Mutationrs782379297c.725N>Tp.Thr242Metp.T242Mprotein_codingtolerated_low_confidence(0.06)benign(0.014)TCGA-DI-A2QY-01Endometriumuterine corpus endometrioid carcinomaFemale<65I/IIChemotherapypaclitaxelCR
Page: 1 2 

Top

Related drugs of malignant transformation related genes

check buttonIdentification of chemicals and drugs interact with genes involved in malignant transfromation
(DGIdb 4.0)
Entrez IDSymbolCategoryInteraction TypesDrug Claim NameDrug NamePMIDs
Page: 1