
|
|||||
|
 | |
| |
| |
| |
| |
| |
|
Gene: FAM26F |
Gene summary for FAM26F |
| Gene information | Species | Human | Gene symbol | FAM26F | Gene ID | 441168 |
| Gene name | calcium homeostasis modulator family member 6 | |
| Gene Alias | C6orf187 | |
| Cytomap | 6q22.1 | |
| Gene Type | protein-coding | GO ID | GO:0006810 | UniProtAcc | Q5R3K3 |
Top |
Malignant transformation analysis |
| Identification of the aberrant gene expression in precancerous and cancerous lesions by comparing the gene expression of stem-like cells in diseased tissues with normal stem cells |
| Entrez ID | Symbol | Replicates | Species | Organ | Tissue | Adj P-value | Log2FC | Malignancy |
| 441168 | FAM26F | P2T-E | Human | Esophagus | ESCC | 4.31e-06 | 1.51e-01 | 0.1177 |
| 441168 | FAM26F | P5T-E | Human | Esophagus | ESCC | 2.39e-24 | 4.61e-01 | 0.1327 |
| 441168 | FAM26F | P10T-E | Human | Esophagus | ESCC | 3.97e-04 | 1.19e-01 | 0.116 |
| 441168 | FAM26F | P16T-E | Human | Esophagus | ESCC | 2.86e-10 | 2.07e-01 | 0.1153 |
| 441168 | FAM26F | P17T-E | Human | Esophagus | ESCC | 2.06e-04 | 3.25e-01 | 0.1278 |
| 441168 | FAM26F | P20T-E | Human | Esophagus | ESCC | 5.28e-07 | 1.72e-01 | 0.1124 |
| 441168 | FAM26F | P23T-E | Human | Esophagus | ESCC | 4.28e-22 | 7.15e-01 | 0.108 |
| 441168 | FAM26F | P24T-E | Human | Esophagus | ESCC | 9.44e-07 | 2.05e-01 | 0.1287 |
| 441168 | FAM26F | P26T-E | Human | Esophagus | ESCC | 4.30e-03 | 1.12e-01 | 0.1276 |
| 441168 | FAM26F | P27T-E | Human | Esophagus | ESCC | 1.25e-26 | 4.85e-01 | 0.1055 |
| 441168 | FAM26F | P32T-E | Human | Esophagus | ESCC | 4.40e-09 | 1.89e-01 | 0.1666 |
| 441168 | FAM26F | P36T-E | Human | Esophagus | ESCC | 3.62e-08 | 2.92e-01 | 0.1187 |
| 441168 | FAM26F | P37T-E | Human | Esophagus | ESCC | 2.23e-27 | 6.80e-01 | 0.1371 |
| 441168 | FAM26F | P52T-E | Human | Esophagus | ESCC | 4.43e-02 | 8.84e-02 | 0.1555 |
| 441168 | FAM26F | P56T-E | Human | Esophagus | ESCC | 2.26e-02 | 2.71e-01 | 0.1613 |
| 441168 | FAM26F | P62T-E | Human | Esophagus | ESCC | 1.02e-05 | 1.90e-01 | 0.1302 |
| 441168 | FAM26F | P74T-E | Human | Esophagus | ESCC | 1.59e-27 | 7.30e-01 | 0.1479 |
| 441168 | FAM26F | P76T-E | Human | Esophagus | ESCC | 4.41e-07 | 1.78e-01 | 0.1207 |
| 441168 | FAM26F | P79T-E | Human | Esophagus | ESCC | 3.50e-02 | 5.72e-02 | 0.1154 |
| 441168 | FAM26F | P80T-E | Human | Esophagus | ESCC | 1.13e-21 | 6.15e-01 | 0.155 |
| Page: 1 2 |
| Tissue | Expression Dynamics | Abbreviation |
| Esophagus | 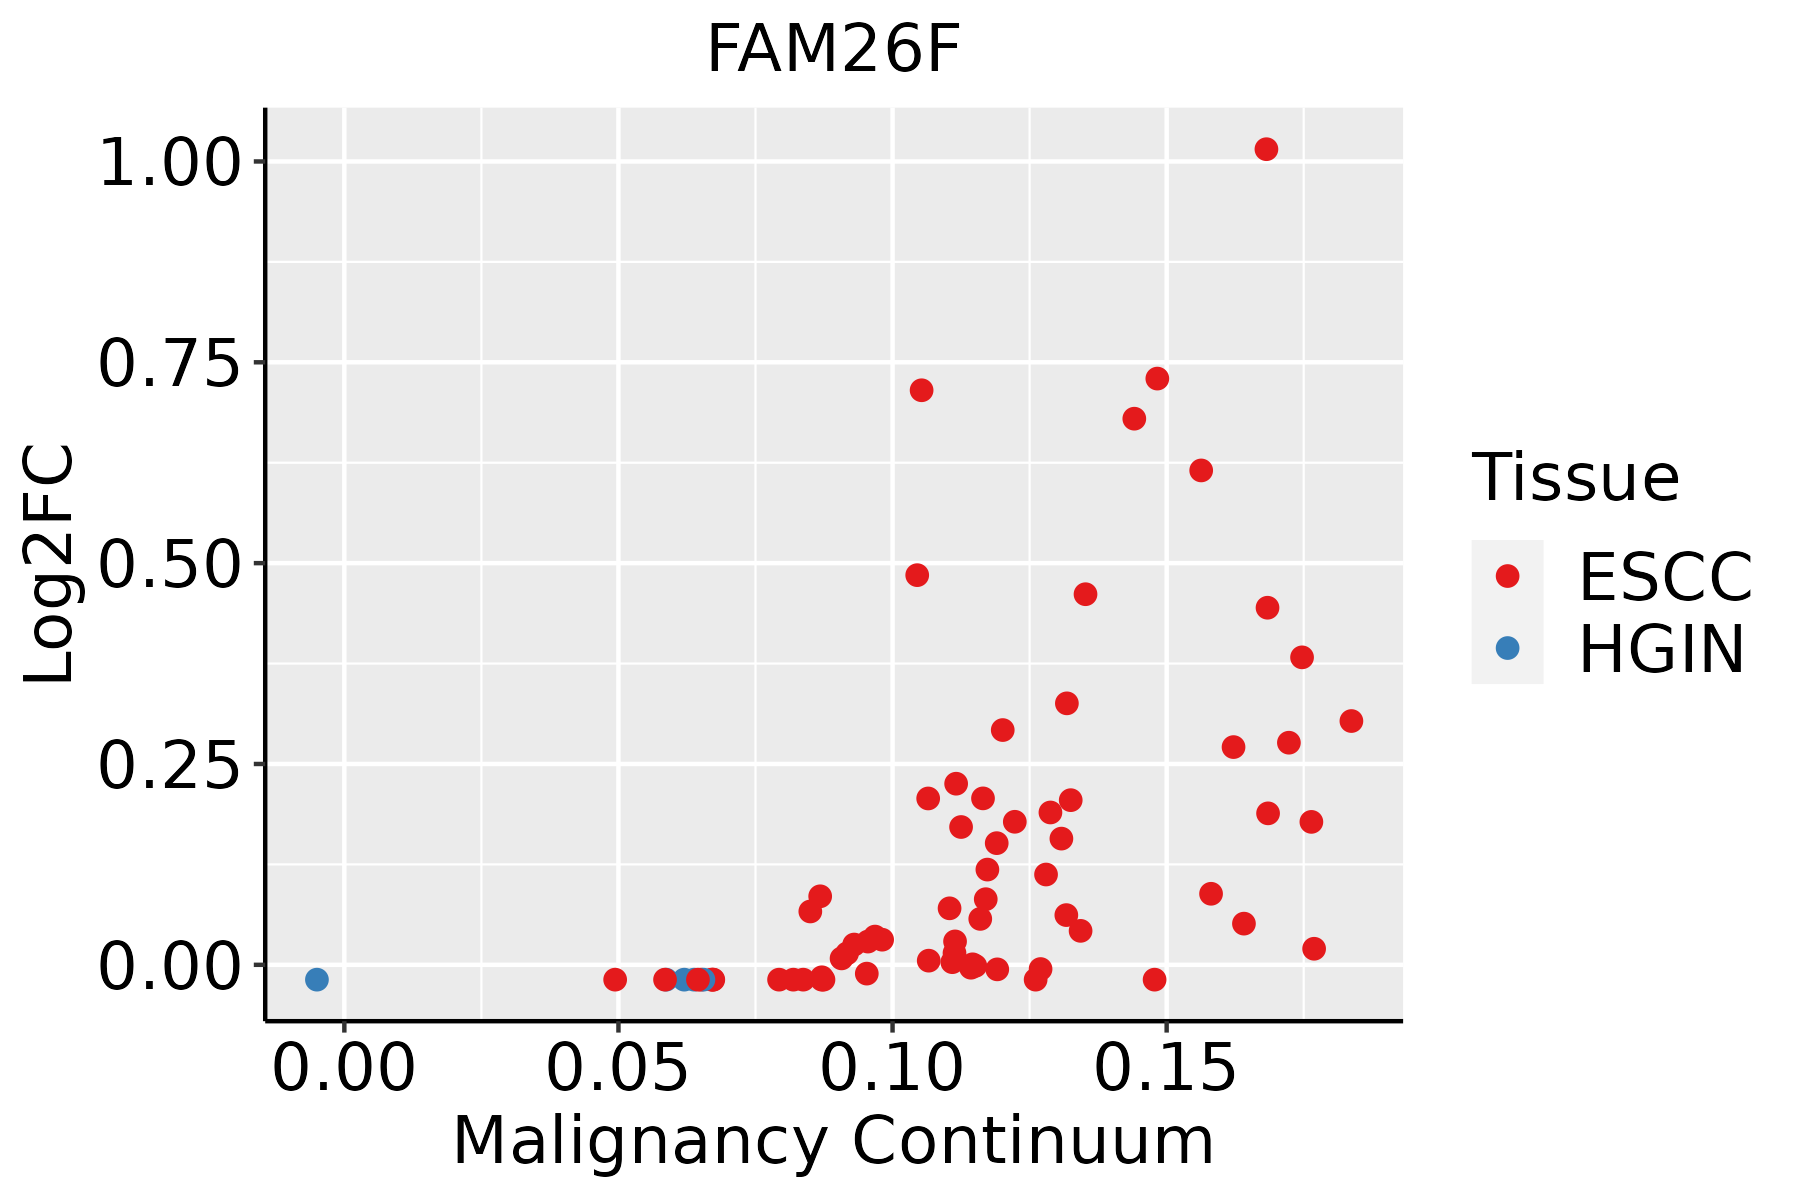 | ESCC: Esophageal squamous cell carcinoma |
| HGIN: High-grade intraepithelial neoplasias | ||
| LGIN: Low-grade intraepithelial neoplasias | ||
| Oral Cavity |  | EOLP: Erosive Oral lichen planus |
| LP: leukoplakia | ||
| NEOLP: Non-erosive oral lichen planus | ||
| OSCC: Oral squamous cell carcinoma |
| ∗log2FC in expression of this searched gene in stem-like cells from each diseased tissue sample relative to stem-like cells in normal samples in each tissue plotted against the malignancy continuum. Samples are colored based on if they are from different disease stage. |
Top |
Malignant transformation related pathway analysis |
| Find out the enriched GO biological processes and KEGG pathways involved in transition from healthy to precancer to cancer |
| Tissue | Disease Stage | Enriched GO biological Processes |
| Colorectum | AD |  |
| Colorectum | SER |  |
| Colorectum | MSS |  |
| Colorectum | MSI-H |  |
| Colorectum | FAP |  |
| ∗Top 15 enriched GO BP terms are showed in the bar plot of each disease state in each tissue. Each row represents a significant GO biological process which is colored according to the -log10(p.adjust). |
| Page: 1 2 3 4 5 6 7 8 9 |
| GO ID | Tissue | Disease Stage | Description | Gene Ratio | Bg Ratio | pvalue | p.adjust | Count |
| Page: 1 |
| Pathway ID | Tissue | Disease Stage | Description | Gene Ratio | Bg Ratio | pvalue | p.adjust | qvalue | Count |
| Page: 1 |
Top |
Cell-cell communication analysis |
| Identification of potential cell-cell interactions between two cell types and their ligand-receptor pairs for different disease states |
| Ligand | Receptor | LRpair | Pathway | Tissue | Disease Stage |
| Page: 1 |
Top |
Single-cell gene regulatory network inference analysis |
| Find out the significant the regulons (TFs) and the target genes of each regulon across cell types for different disease states |
| TF | Cell Type | Tissue | Disease Stage | Target Gene | RSS | Regulon Activity |
| ∗The dot plots of a searched regulon are shown for all cell subpopulations in each disease state of each tissue based on the regulon specific score inferred using pySCENIC and by calculating the average expression. |
| Page: 1 |
Top |
Somatic mutation of malignant transformation related genes |
| Annotation of somatic variants for genes involved in malignant transformation |
| Hugo Symbol | Variant Class | Variant Classification | dbSNP RS | HGVSc | HGVSp | HGVSp Short | SWISSPROT | BIOTYPE | SIFT | PolyPhen | Tumor Sample Barcode | Tissue | Histology | Sex | Age | Stage | Therapy Types | Drugs | Outcome |
| FAM26F | SNV | Missense_Mutation | c.850N>C | p.Glu284Gln | p.E284Q | Q5R3K3 | protein_coding | tolerated(0.18) | benign(0.011) | TCGA-C8-A1HM-01 | Breast | breast invasive carcinoma | Female | >=65 | I/II | Chemotherapy | doxorubicin | CR | |
| FAM26F | SNV | Missense_Mutation | c.99N>G | p.Ile33Met | p.I33M | Q5R3K3 | protein_coding | deleterious(0) | benign(0.164) | TCGA-EK-A3GK-01 | Cervix | cervical & endocervical cancer | Female | <65 | I/II | Unknown | Unknown | SD | |
| FAM26F | SNV | Missense_Mutation | c.424N>T | p.Arg142Cys | p.R142C | Q5R3K3 | protein_coding | deleterious(0.01) | possibly_damaging(0.627) | TCGA-A6-6780-01 | Colorectum | colon adenocarcinoma | Male | >=65 | I/II | Unknown | Unknown | SD | |
| FAM26F | SNV | Missense_Mutation | c.217N>T | p.Arg73Cys | p.R73C | Q5R3K3 | protein_coding | deleterious(0) | probably_damaging(0.984) | TCGA-AZ-6598-01 | Colorectum | colon adenocarcinoma | Female | >=65 | I/II | Unknown | Unknown | SD | |
| FAM26F | SNV | Missense_Mutation | novel | c.386N>T | p.Thr129Ile | p.T129I | Q5R3K3 | protein_coding | deleterious(0) | benign(0.107) | TCGA-T9-A92H-01 | Colorectum | colon adenocarcinoma | Male | >=65 | I/II | Unknown | Unknown | PD |
| FAM26F | SNV | Missense_Mutation | rs557482432 | c.731N>T | p.Ser244Leu | p.S244L | Q5R3K3 | protein_coding | deleterious(0.03) | benign(0.034) | TCGA-AG-A002-01 | Colorectum | rectum adenocarcinoma | Male | <65 | I/II | Unknown | Unknown | SD |
| FAM26F | SNV | Missense_Mutation | novel | c.573N>G | p.Ile191Met | p.I191M | Q5R3K3 | protein_coding | deleterious(0) | benign(0.225) | TCGA-EI-6917-01 | Colorectum | rectum adenocarcinoma | Male | <65 | III/IV | Chemotherapy | 5fluorouracil+oxaciplatina+l-folinian | SD |
| FAM26F | SNV | Missense_Mutation | c.720N>A | p.Phe240Leu | p.F240L | Q5R3K3 | protein_coding | deleterious(0) | probably_damaging(0.995) | TCGA-AJ-A5DW-01 | Endometrium | uterine corpus endometrioid carcinoma | Female | <65 | I/II | Unknown | Unknown | SD | |
| FAM26F | SNV | Missense_Mutation | novel | c.83N>T | p.Ala28Val | p.A28V | Q5R3K3 | protein_coding | tolerated(0.13) | benign(0.025) | TCGA-AP-A1DK-01 | Endometrium | uterine corpus endometrioid carcinoma | Female | <65 | I/II | Unknown | Unknown | SD |
| FAM26F | SNV | Missense_Mutation | novel | c.573T>G | p.Ile191Met | p.I191M | Q5R3K3 | protein_coding | deleterious(0) | benign(0.225) | TCGA-AP-A1E0-01 | Endometrium | uterine corpus endometrioid carcinoma | Female | <65 | III/IV | Chemotherapy | paclitaxel | SD |
| Page: 1 2 3 |
Top |
Related drugs of malignant transformation related genes |
| Identification of chemicals and drugs interact with genes involved in malignant transfromation |
| (DGIdb 4.0) |
| Entrez ID | Symbol | Category | Interaction Types | Drug Claim Name | Drug Name | PMIDs |
| Page: 1 |

Copyright 2023-Present -The University of Texas Health Science Center at Houston |