
|
|||||
|
 | |
| |
| |
| |
| |
| |
|
Gene: FAM227A |
Gene summary for FAM227A |
| Gene information | Species | Human | Gene symbol | FAM227A | Gene ID | 646851 |
| Gene name | family with sequence similarity 227 member A | |
| Gene Alias | FAM227A | |
| Cytomap | 22q13.1 | |
| Gene Type | protein-coding | GO ID | NA | UniProtAcc | F5H4B4 |
Top |
Malignant transformation analysis |
| Identification of the aberrant gene expression in precancerous and cancerous lesions by comparing the gene expression of stem-like cells in diseased tissues with normal stem cells |
| Entrez ID | Symbol | Replicates | Species | Organ | Tissue | Adj P-value | Log2FC | Malignancy |
| 646851 | FAM227A | HCC1_Meng | Human | Liver | HCC | 5.54e-12 | 1.03e-02 | 0.0246 |
| 646851 | FAM227A | HCC1 | Human | Liver | HCC | 5.60e-20 | 2.00e+00 | 0.5336 |
| 646851 | FAM227A | HCC2 | Human | Liver | HCC | 8.82e-36 | 3.14e+00 | 0.5341 |
| 646851 | FAM227A | HCC5 | Human | Liver | HCC | 2.25e-27 | 1.85e+00 | 0.4932 |
| Page: 1 |
| Tissue | Expression Dynamics | Abbreviation |
| Liver | 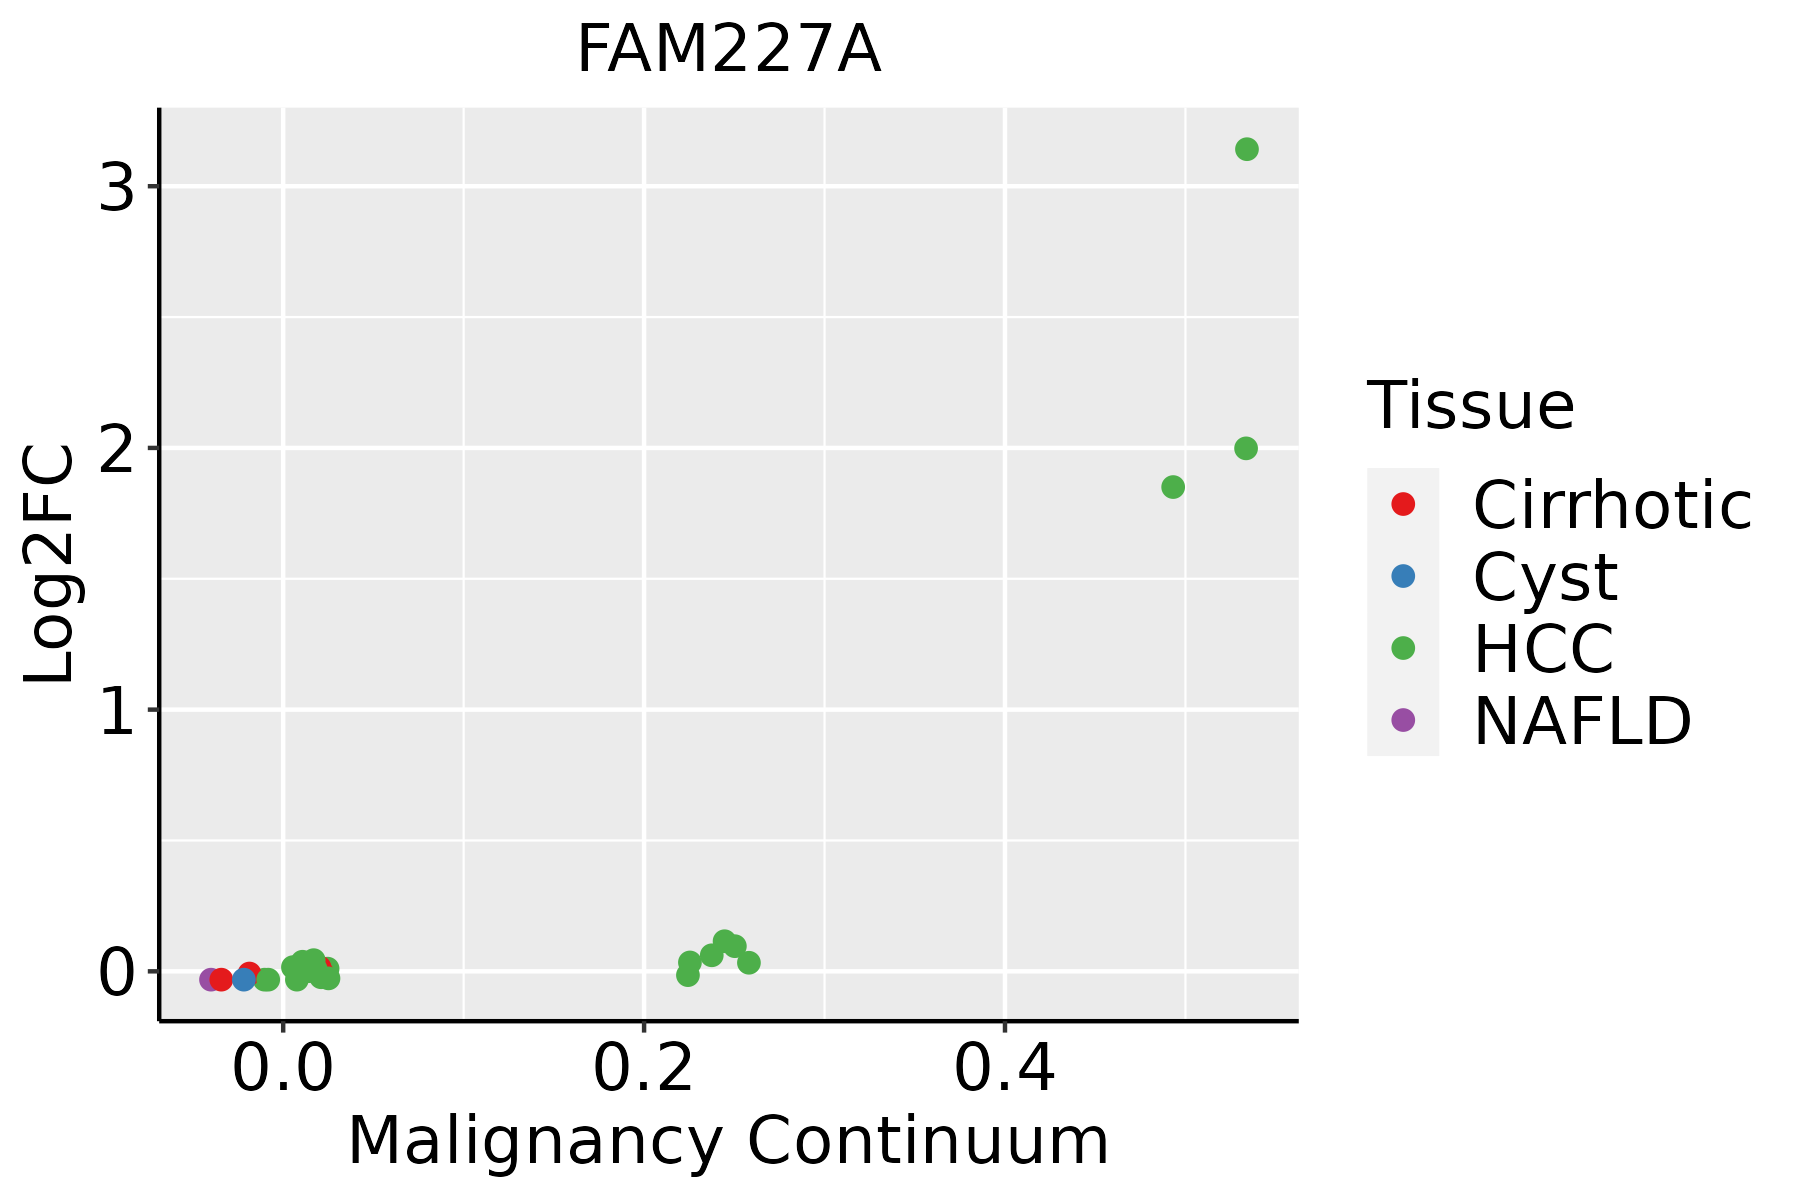 | HCC: Hepatocellular carcinoma |
| NAFLD: Non-alcoholic fatty liver disease |
| ∗log2FC in expression of this searched gene in stem-like cells from each diseased tissue sample relative to stem-like cells in normal samples in each tissue plotted against the malignancy continuum. Samples are colored based on if they are from different disease stage. |
Top |
Malignant transformation related pathway analysis |
| Find out the enriched GO biological processes and KEGG pathways involved in transition from healthy to precancer to cancer |
| Tissue | Disease Stage | Enriched GO biological Processes |
| Colorectum | AD |  |
| Colorectum | SER |  |
| Colorectum | MSS |  |
| Colorectum | MSI-H |  |
| Colorectum | FAP |  |
| ∗Top 15 enriched GO BP terms are showed in the bar plot of each disease state in each tissue. Each row represents a significant GO biological process which is colored according to the -log10(p.adjust). |
| Page: 1 2 3 4 5 6 7 8 9 |
| GO ID | Tissue | Disease Stage | Description | Gene Ratio | Bg Ratio | pvalue | p.adjust | Count |
| Page: 1 |
| Pathway ID | Tissue | Disease Stage | Description | Gene Ratio | Bg Ratio | pvalue | p.adjust | qvalue | Count |
| Page: 1 |
Top |
Cell-cell communication analysis |
| Identification of potential cell-cell interactions between two cell types and their ligand-receptor pairs for different disease states |
| Ligand | Receptor | LRpair | Pathway | Tissue | Disease Stage |
| Page: 1 |
Top |
Single-cell gene regulatory network inference analysis |
| Find out the significant the regulons (TFs) and the target genes of each regulon across cell types for different disease states |
| TF | Cell Type | Tissue | Disease Stage | Target Gene | RSS | Regulon Activity |
| ∗The dot plots of a searched regulon are shown for all cell subpopulations in each disease state of each tissue based on the regulon specific score inferred using pySCENIC and by calculating the average expression. |
| Page: 1 |
Top |
Somatic mutation of malignant transformation related genes |
| Annotation of somatic variants for genes involved in malignant transformation |
| Hugo Symbol | Variant Class | Variant Classification | dbSNP RS | HGVSc | HGVSp | HGVSp Short | SWISSPROT | BIOTYPE | SIFT | PolyPhen | Tumor Sample Barcode | Tissue | Histology | Sex | Age | Stage | Therapy Types | Drugs | Outcome |
| FAM227A | SNV | Missense_Mutation | novel | c.587N>G | p.Phe196Cys | p.F196C | protein_coding | deleterious(0) | probably_damaging(0.998) | TCGA-AR-A2LR-01 | Breast | breast invasive carcinoma | Female | <65 | I/II | Chemotherapy | adriamycin | SD | |
| FAM227A | SNV | Missense_Mutation | c.972N>T | p.Lys324Asn | p.K324N | protein_coding | deleterious(0.02) | benign(0.165) | TCGA-C8-A278-01 | Breast | breast invasive carcinoma | Female | <65 | III/IV | Hormone Therapy | tamoxiphen | SD | ||
| FAM227A | SNV | Missense_Mutation | novel | c.497N>A | p.Gly166Asp | p.G166D | protein_coding | deleterious(0) | probably_damaging(1) | TCGA-C5-A2LZ-01 | Cervix | cervical & endocervical cancer | Female | >=65 | III/IV | Unknown | Unknown | PD | |
| FAM227A | SNV | Missense_Mutation | novel | c.1108A>G | p.Lys370Glu | p.K370E | protein_coding | tolerated(0.39) | benign(0.271) | TCGA-C5-A8XH-01 | Cervix | cervical & endocervical cancer | Female | <65 | I/II | Unknown | Unknown | SD | |
| FAM227A | SNV | Missense_Mutation | rs565247823 | c.1423N>T | p.Arg475Trp | p.R475W | protein_coding | deleterious(0.02) | probably_damaging(0.992) | TCGA-C5-A905-01 | Cervix | cervical & endocervical cancer | Female | <65 | I/II | Unknown | Unknown | SD | |
| FAM227A | SNV | Missense_Mutation | novel | c.1416N>T | p.Met472Ile | p.M472I | protein_coding | tolerated(0.17) | possibly_damaging(0.487) | TCGA-EK-A2PG-01 | Cervix | cervical & endocervical cancer | Female | >=65 | I/II | Unknown | Unknown | SD | |
| FAM227A | SNV | Missense_Mutation | novel | c.801N>A | p.Asp267Glu | p.D267E | protein_coding | tolerated(0.43) | benign(0.014) | TCGA-EK-A2PK-01 | Cervix | cervical & endocervical cancer | Female | <65 | I/II | Unknown | Unknown | SD | |
| FAM227A | SNV | Missense_Mutation | c.1040N>T | p.Ser347Leu | p.S347L | protein_coding | tolerated(0.44) | benign(0.003) | TCGA-EK-A3GK-01 | Cervix | cervical & endocervical cancer | Female | <65 | I/II | Unknown | Unknown | SD | ||
| FAM227A | SNV | Missense_Mutation | rs779397566 | c.194N>T | p.Ser65Leu | p.S65L | protein_coding | tolerated(1) | benign(0) | TCGA-UC-A7PF-01 | Cervix | cervical & endocervical cancer | Female | <65 | I/II | Unknown | Unknown | SD | |
| FAM227A | SNV | Missense_Mutation | c.956N>A | p.Ser319Tyr | p.S319Y | protein_coding | deleterious(0.01) | possibly_damaging(0.904) | TCGA-AA-3510-01 | Colorectum | colon adenocarcinoma | Male | >=65 | I/II | Unknown | Unknown | SD |
| Page: 1 2 3 |
Top |
Related drugs of malignant transformation related genes |
| Identification of chemicals and drugs interact with genes involved in malignant transfromation |
| (DGIdb 4.0) |
| Entrez ID | Symbol | Category | Interaction Types | Drug Claim Name | Drug Name | PMIDs |
| Page: 1 |

Copyright 2023-Present -The University of Texas Health Science Center at Houston |