
|
|||||
|
 | |
| |
| |
| |
| |
| |
|
Gene: FAM222B |
Gene summary for FAM222B |
| Gene information | Species | Human | Gene symbol | FAM222B | Gene ID | 55731 |
| Gene name | family with sequence similarity 222 member B | |
| Gene Alias | C17orf63 | |
| Cytomap | 17q11.2 | |
| Gene Type | protein-coding | GO ID | GO:0005575 | UniProtAcc | A0A024QZ60 |
Top |
Malignant transformation analysis |
| Identification of the aberrant gene expression in precancerous and cancerous lesions by comparing the gene expression of stem-like cells in diseased tissues with normal stem cells |
| Entrez ID | Symbol | Replicates | Species | Organ | Tissue | Adj P-value | Log2FC | Malignancy |
| 55731 | FAM222B | CCI_2 | Human | Cervix | CC | 6.76e-05 | 5.48e-01 | 0.5249 |
| 55731 | FAM222B | CCI_3 | Human | Cervix | CC | 8.62e-11 | 7.44e-01 | 0.516 |
| 55731 | FAM222B | HTA11_3410_2000001011 | Human | Colorectum | AD | 3.81e-08 | -3.78e-01 | 0.0155 |
| 55731 | FAM222B | HTA11_347_2000001011 | Human | Colorectum | AD | 3.05e-03 | 3.85e-01 | -0.1954 |
| 55731 | FAM222B | HTA11_99999970781_79442 | Human | Colorectum | MSS | 2.68e-05 | -4.29e-01 | 0.294 |
| 55731 | FAM222B | F007 | Human | Colorectum | FAP | 2.21e-04 | -4.43e-01 | 0.1176 |
| 55731 | FAM222B | A002-C-010 | Human | Colorectum | FAP | 1.27e-03 | -3.86e-01 | 0.242 |
| 55731 | FAM222B | A001-C-207 | Human | Colorectum | FAP | 4.16e-06 | -4.70e-01 | 0.1278 |
| 55731 | FAM222B | A015-C-203 | Human | Colorectum | FAP | 5.01e-32 | -6.51e-01 | -0.1294 |
| 55731 | FAM222B | A015-C-204 | Human | Colorectum | FAP | 9.96e-12 | -6.11e-01 | -0.0228 |
| 55731 | FAM222B | A014-C-040 | Human | Colorectum | FAP | 3.90e-09 | -7.32e-01 | -0.1184 |
| 55731 | FAM222B | A002-C-201 | Human | Colorectum | FAP | 4.63e-16 | -5.58e-01 | 0.0324 |
| 55731 | FAM222B | A002-C-203 | Human | Colorectum | FAP | 5.11e-05 | -4.17e-01 | 0.2786 |
| 55731 | FAM222B | A001-C-119 | Human | Colorectum | FAP | 5.03e-03 | -2.30e-01 | -0.1557 |
| 55731 | FAM222B | A001-C-108 | Human | Colorectum | FAP | 1.73e-19 | -5.20e-01 | -0.0272 |
| 55731 | FAM222B | A002-C-205 | Human | Colorectum | FAP | 1.02e-23 | -5.62e-01 | -0.1236 |
| 55731 | FAM222B | A001-C-104 | Human | Colorectum | FAP | 3.25e-04 | -4.37e-01 | 0.0184 |
| 55731 | FAM222B | A015-C-005 | Human | Colorectum | FAP | 2.30e-06 | -4.67e-01 | -0.0336 |
| 55731 | FAM222B | A015-C-006 | Human | Colorectum | FAP | 1.12e-18 | -6.13e-01 | -0.0994 |
| 55731 | FAM222B | A015-C-106 | Human | Colorectum | FAP | 1.10e-12 | -4.25e-01 | -0.0511 |
| Page: 1 2 3 4 5 6 7 |
| Tissue | Expression Dynamics | Abbreviation |
| Cervix | 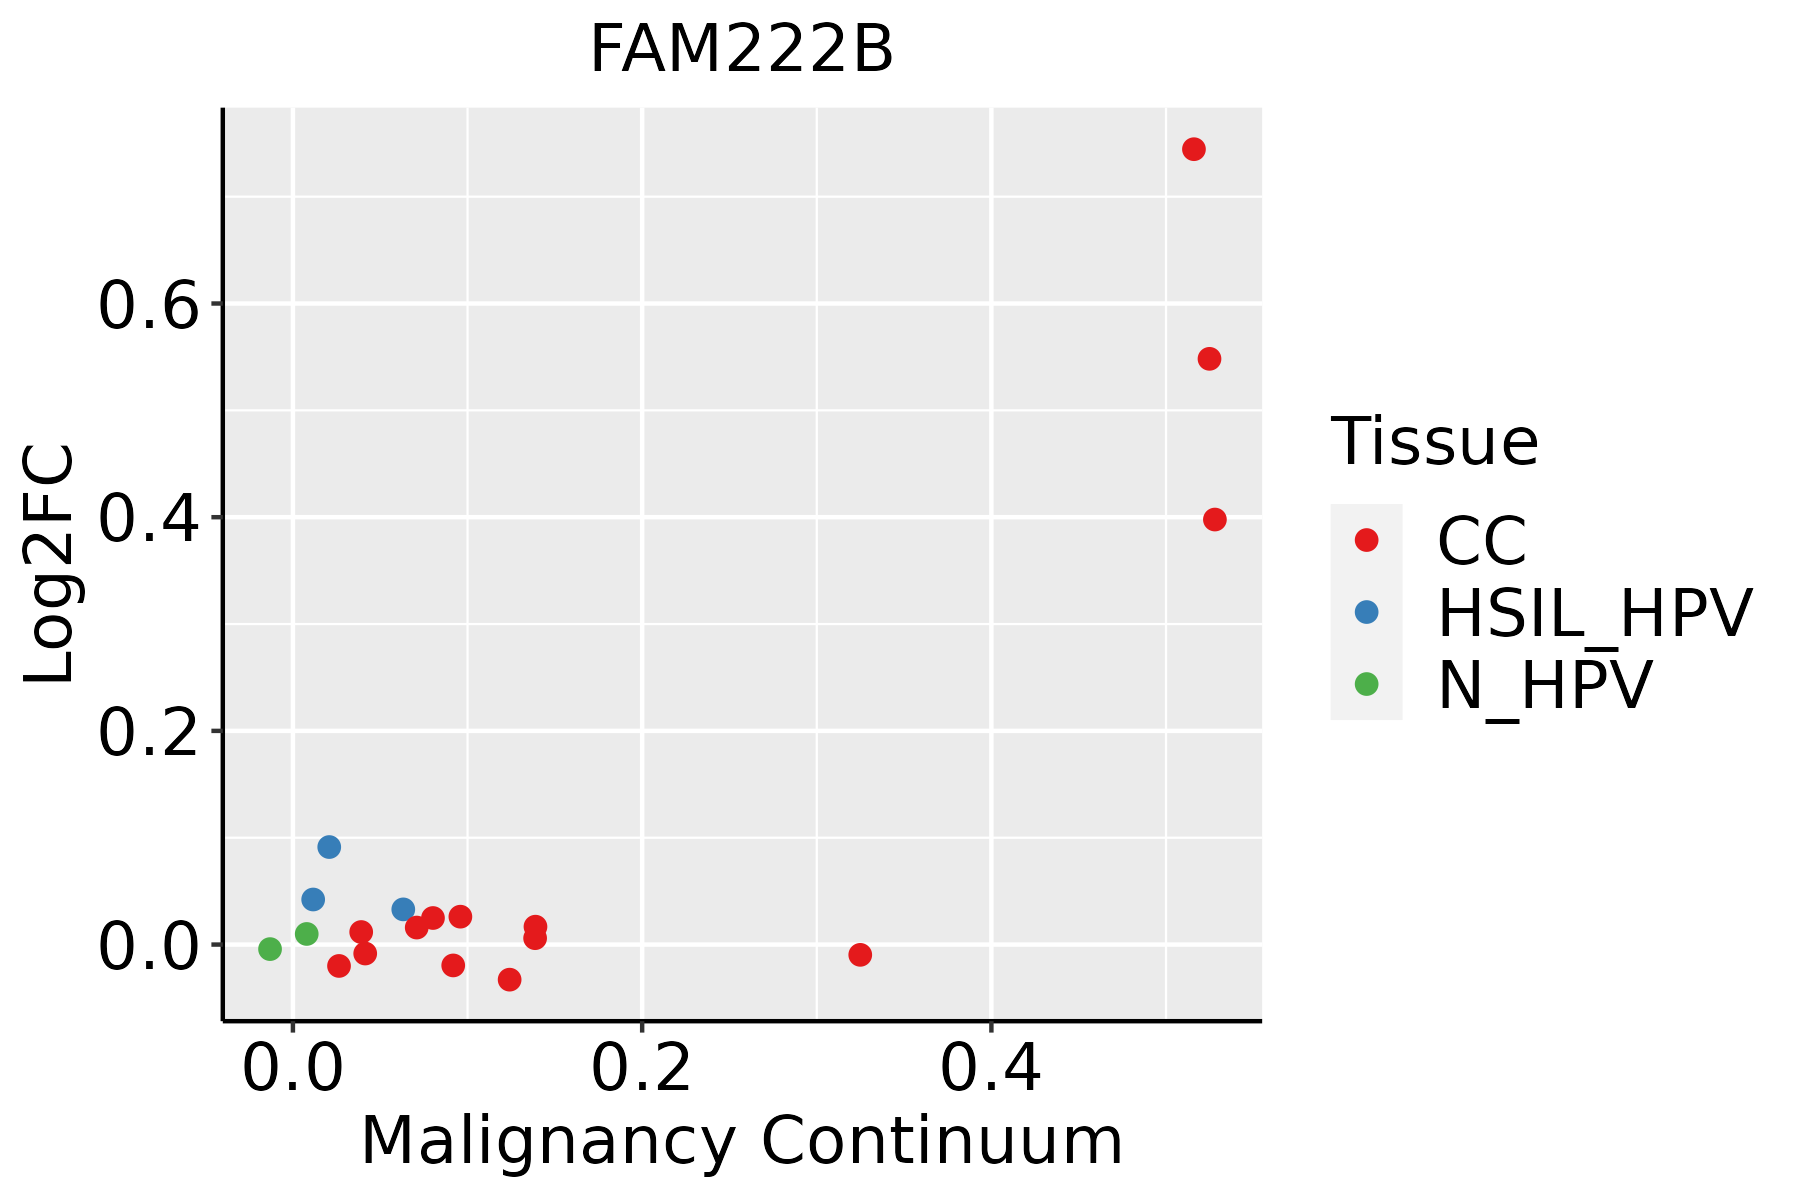 | CC: Cervix cancer |
| HSIL_HPV: HPV-infected high-grade squamous intraepithelial lesions | ||
| N_HPV: HPV-infected normal cervix | ||
| Colorectum (GSE201348) |  | FAP: Familial adenomatous polyposis |
| CRC: Colorectal cancer | ||
| Colorectum (HTA11) |  | AD: Adenomas |
| SER: Sessile serrated lesions | ||
| MSI-H: Microsatellite-high colorectal cancer | ||
| MSS: Microsatellite stable colorectal cancer | ||
| Endometrium | 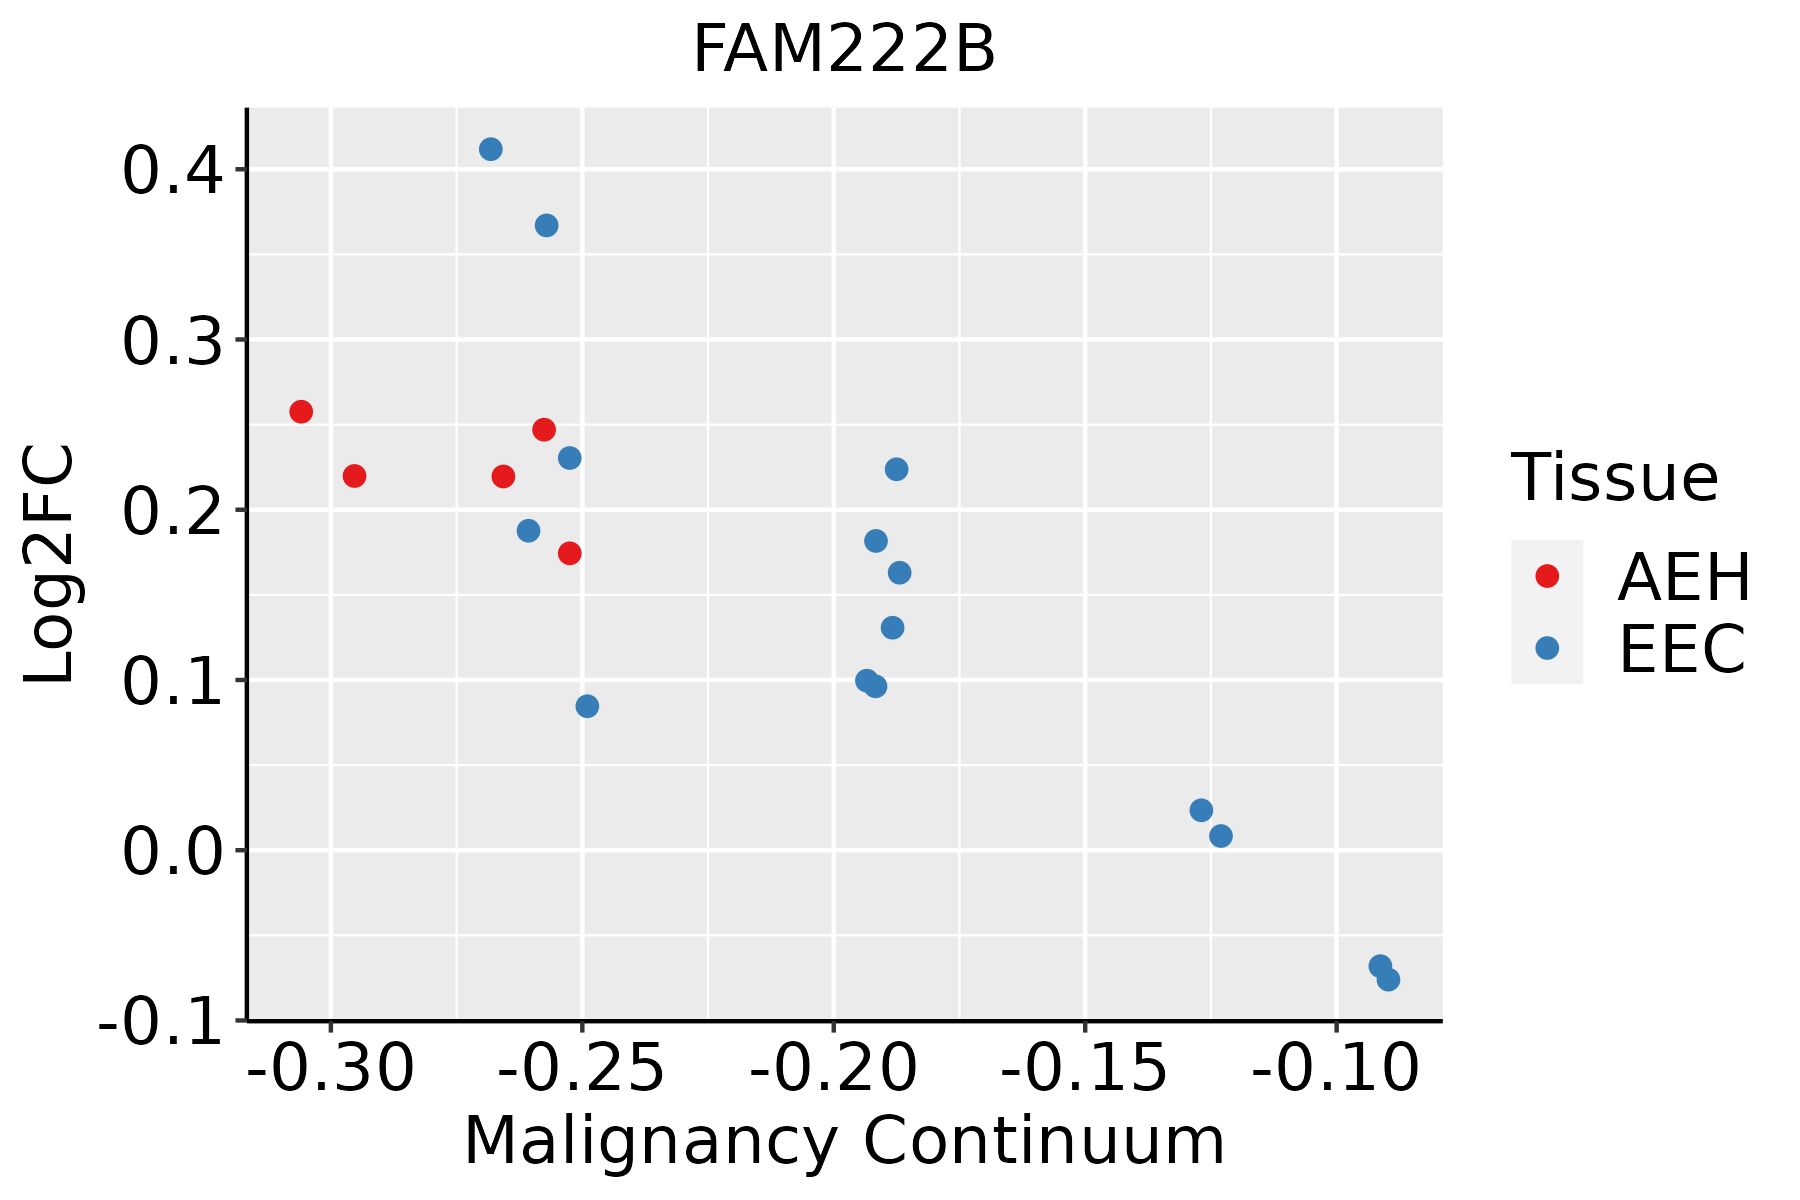 | AEH: Atypical endometrial hyperplasia |
| EEC: Endometrioid Cancer | ||
| Esophagus | 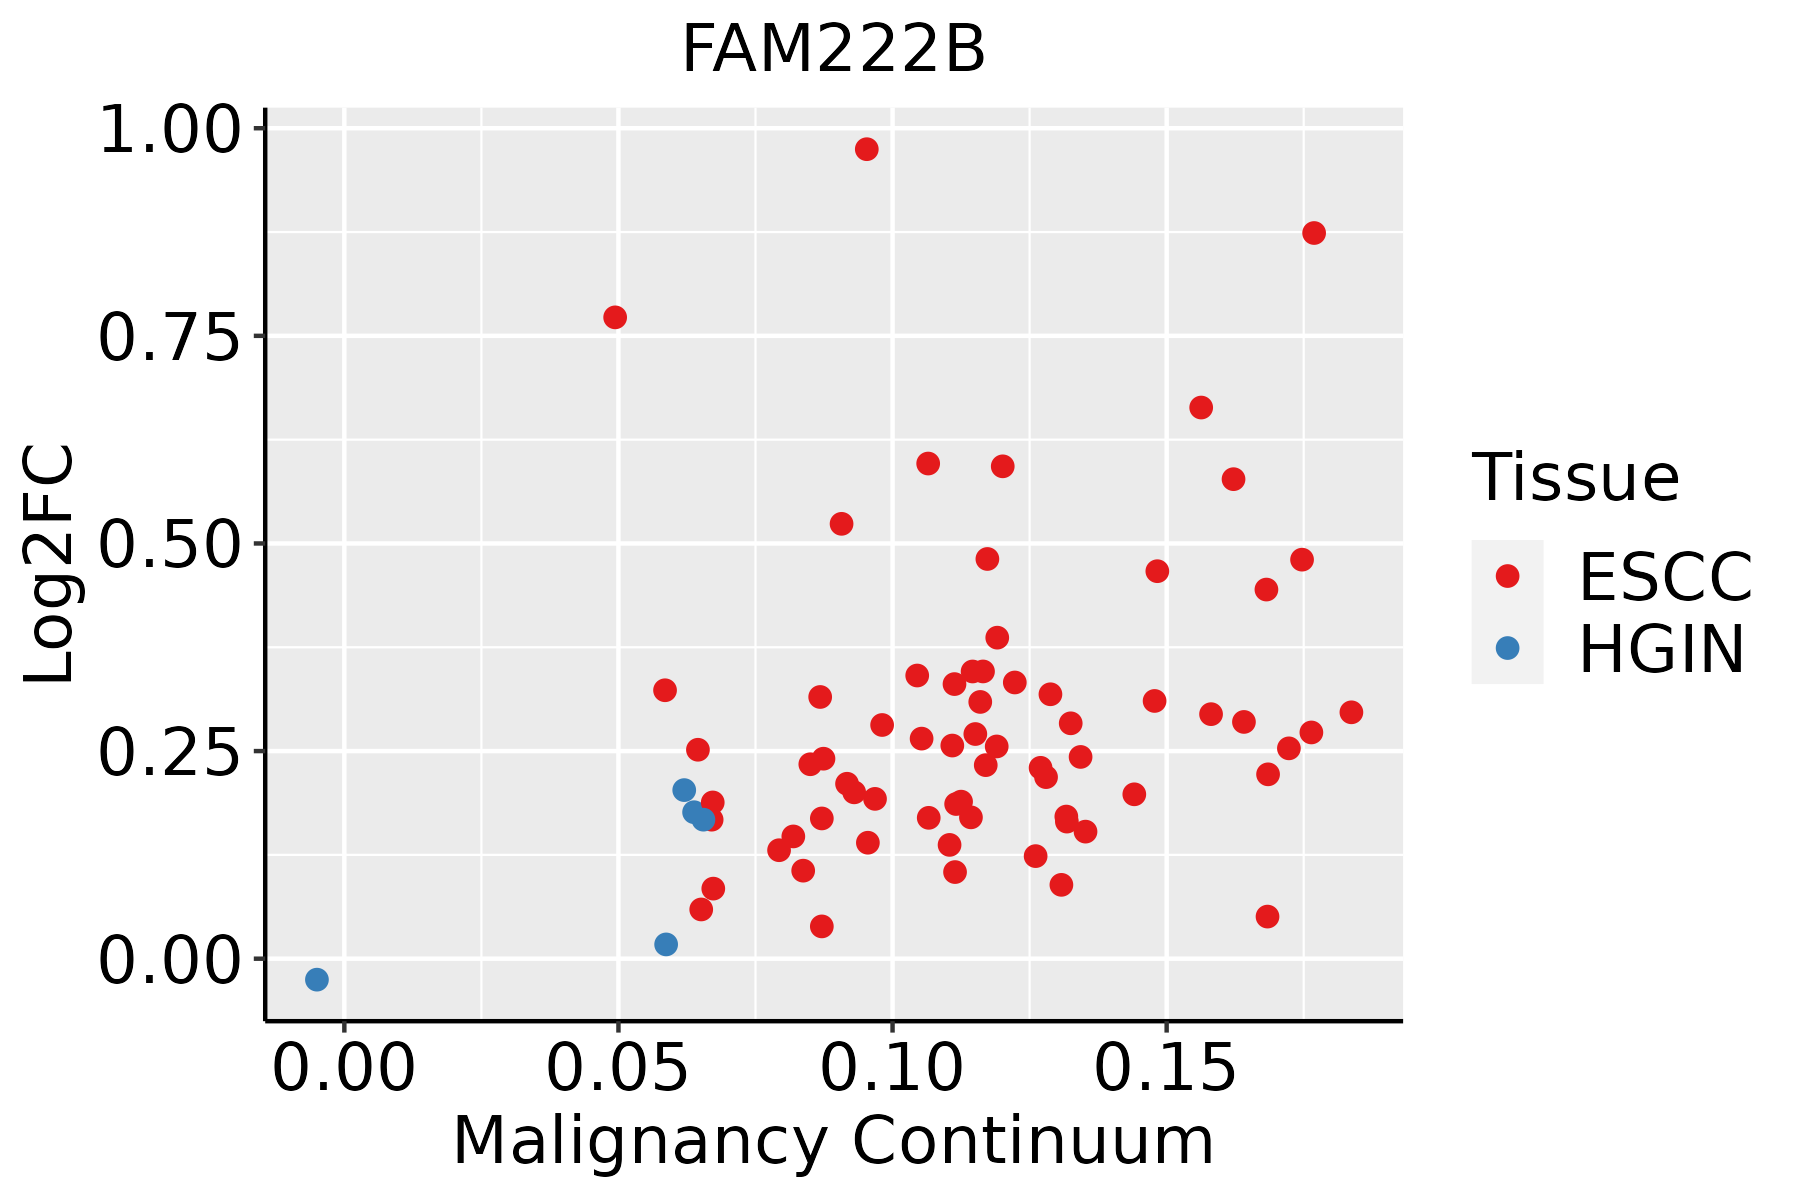 | ESCC: Esophageal squamous cell carcinoma |
| HGIN: High-grade intraepithelial neoplasias | ||
| LGIN: Low-grade intraepithelial neoplasias | ||
| Liver | 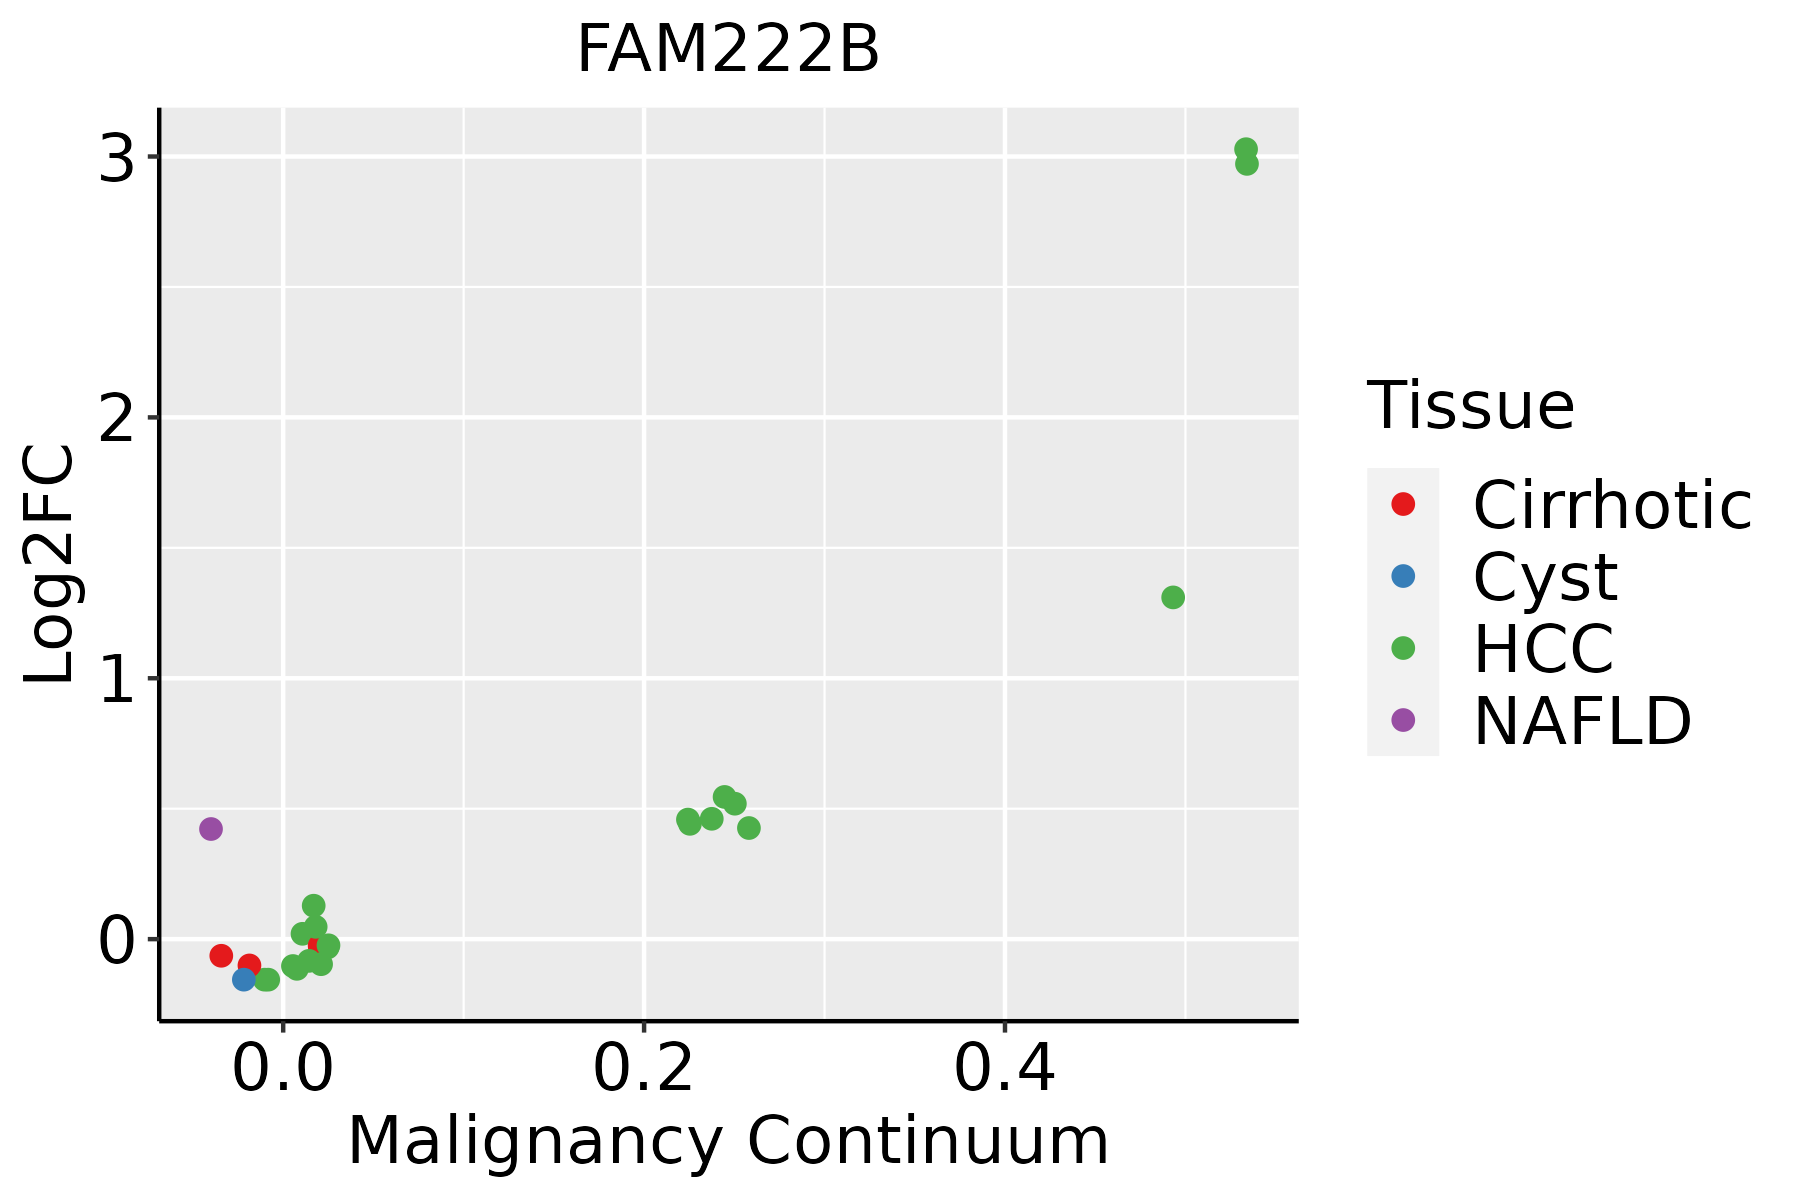 | HCC: Hepatocellular carcinoma |
| NAFLD: Non-alcoholic fatty liver disease | ||
| Lung |  | AAH: Atypical adenomatous hyperplasia |
| AIS: Adenocarcinoma in situ | ||
| IAC: Invasive lung adenocarcinoma | ||
| MIA: Minimally invasive adenocarcinoma |
| ∗log2FC in expression of this searched gene in stem-like cells from each diseased tissue sample relative to stem-like cells in normal samples in each tissue plotted against the malignancy continuum. Samples are colored based on if they are from different disease stage. |
Top |
Malignant transformation related pathway analysis |
| Find out the enriched GO biological processes and KEGG pathways involved in transition from healthy to precancer to cancer |
| Tissue | Disease Stage | Enriched GO biological Processes |
| Colorectum | AD |  |
| Colorectum | SER |  |
| Colorectum | MSS |  |
| Colorectum | MSI-H |  |
| Colorectum | FAP |  |
| ∗Top 15 enriched GO BP terms are showed in the bar plot of each disease state in each tissue. Each row represents a significant GO biological process which is colored according to the -log10(p.adjust). |
| Page: 1 2 3 4 5 6 7 8 9 |
| GO ID | Tissue | Disease Stage | Description | Gene Ratio | Bg Ratio | pvalue | p.adjust | Count |
| Page: 1 |
| Pathway ID | Tissue | Disease Stage | Description | Gene Ratio | Bg Ratio | pvalue | p.adjust | qvalue | Count |
| Page: 1 |
Top |
Cell-cell communication analysis |
| Identification of potential cell-cell interactions between two cell types and their ligand-receptor pairs for different disease states |
| Ligand | Receptor | LRpair | Pathway | Tissue | Disease Stage |
| Page: 1 |
Top |
Single-cell gene regulatory network inference analysis |
| Find out the significant the regulons (TFs) and the target genes of each regulon across cell types for different disease states |
| TF | Cell Type | Tissue | Disease Stage | Target Gene | RSS | Regulon Activity |
| ∗The dot plots of a searched regulon are shown for all cell subpopulations in each disease state of each tissue based on the regulon specific score inferred using pySCENIC and by calculating the average expression. |
| Page: 1 |
Top |
Somatic mutation of malignant transformation related genes |
| Annotation of somatic variants for genes involved in malignant transformation |
| Hugo Symbol | Variant Class | Variant Classification | dbSNP RS | HGVSc | HGVSp | HGVSp Short | SWISSPROT | BIOTYPE | SIFT | PolyPhen | Tumor Sample Barcode | Tissue | Histology | Sex | Age | Stage | Therapy Types | Drugs | Outcome |
| FAM222B | SNV | Missense_Mutation | c.438C>G | p.His146Gln | p.H146Q | Q8WU58 | protein_coding | tolerated(0.11) | possibly_damaging(0.881) | TCGA-GM-A2DH-01 | Breast | breast invasive carcinoma | Female | <65 | I/II | Chemotherapy | taxol | CR | |
| FAM222B | SNV | Missense_Mutation | c.251N>T | p.Ser84Leu | p.S84L | Q8WU58 | protein_coding | deleterious(0) | benign(0.224) | TCGA-GM-A2DO-01 | Breast | breast invasive carcinoma | Female | <65 | I/II | Hormone Therapy | tamoxiphen | CR | |
| FAM222B | SNV | Missense_Mutation | c.804C>G | p.Ile268Met | p.I268M | Q8WU58 | protein_coding | deleterious(0) | probably_damaging(0.938) | TCGA-DG-A2KL-01 | Cervix | cervical & endocervical cancer | Female | <65 | I/II | Chemotherapy | cisplatin | SD | |
| FAM222B | SNV | Missense_Mutation | c.865G>C | p.Glu289Gln | p.E289Q | Q8WU58 | protein_coding | tolerated(0.18) | benign(0.362) | TCGA-IR-A3LH-01 | Cervix | cervical & endocervical cancer | Female | <65 | I/II | Chemotherapy | cisplatin | CR | |
| FAM222B | SNV | Missense_Mutation | novel | c.112C>G | p.His38Asp | p.H38D | Q8WU58 | protein_coding | tolerated(0.44) | benign(0.055) | TCGA-VS-A8EK-01 | Cervix | cervical & endocervical cancer | Female | >=65 | I/II | Chemotherapy | cisplatin | PD |
| FAM222B | SNV | Missense_Mutation | c.1300N>T | p.Pro434Ser | p.P434S | Q8WU58 | protein_coding | tolerated(0.06) | probably_damaging(0.947) | TCGA-A6-6781-01 | Colorectum | colon adenocarcinoma | Male | <65 | III/IV | Chemotherapy | oxaliplatin | SD | |
| FAM222B | SNV | Missense_Mutation | novel | c.1537N>T | p.Thr513Ser | p.T513S | Q8WU58 | protein_coding | tolerated(0.3) | possibly_damaging(0.662) | TCGA-AA-3667-01 | Colorectum | colon adenocarcinoma | Female | <65 | I/II | Unknown | Unknown | SD |
| FAM222B | SNV | Missense_Mutation | c.1288N>G | p.Thr430Ala | p.T430A | Q8WU58 | protein_coding | tolerated(0.25) | probably_damaging(0.986) | TCGA-AA-3864-01 | Colorectum | colon adenocarcinoma | Male | >=65 | I/II | Unknown | Unknown | SD | |
| FAM222B | SNV | Missense_Mutation | novel | c.1173G>T | p.Lys391Asn | p.K391N | Q8WU58 | protein_coding | tolerated(0.16) | benign(0.056) | TCGA-AA-3947-01 | Colorectum | colon adenocarcinoma | Female | <65 | I/II | Unknown | Unknown | SD |
| FAM222B | SNV | Missense_Mutation | rs184608986 | c.359N>A | p.Arg120Gln | p.R120Q | Q8WU58 | protein_coding | tolerated(0.06) | probably_damaging(0.992) | TCGA-AA-A00N-01 | Colorectum | colon adenocarcinoma | Male | >=65 | I/II | Unknown | Unknown | PD |
| Page: 1 2 3 4 5 |
Top |
Related drugs of malignant transformation related genes |
| Identification of chemicals and drugs interact with genes involved in malignant transfromation |
| (DGIdb 4.0) |
| Entrez ID | Symbol | Category | Interaction Types | Drug Claim Name | Drug Name | PMIDs |
| Page: 1 |

Copyright 2023-Present -The University of Texas Health Science Center at Houston |