
|
|||||
|
 | |
| |
| |
| |
| |
| |
|
Gene: FAM214B |
Gene summary for FAM214B |
| Gene information | Species | Human | Gene symbol | FAM214B | Gene ID | 80256 |
| Gene name | family with sequence similarity 214 member B | |
| Gene Alias | KIAA1539 | |
| Cytomap | 9p13.3 | |
| Gene Type | protein-coding | GO ID | GO:0005575 | UniProtAcc | Q7L5A3 |
Top |
Malignant transformation analysis |
| Identification of the aberrant gene expression in precancerous and cancerous lesions by comparing the gene expression of stem-like cells in diseased tissues with normal stem cells |
| Entrez ID | Symbol | Replicates | Species | Organ | Tissue | Adj P-value | Log2FC | Malignancy |
| 80256 | FAM214B | C21 | Human | Oral cavity | OSCC | 4.61e-10 | 3.31e-01 | 0.2678 |
| 80256 | FAM214B | C30 | Human | Oral cavity | OSCC | 3.58e-18 | 1.08e+00 | 0.3055 |
| 80256 | FAM214B | C38 | Human | Oral cavity | OSCC | 3.43e-02 | 4.30e-01 | 0.172 |
| 80256 | FAM214B | C51 | Human | Oral cavity | OSCC | 9.69e-04 | 3.81e-01 | 0.2674 |
| 80256 | FAM214B | C06 | Human | Oral cavity | OSCC | 1.08e-09 | 1.18e+00 | 0.2699 |
| 80256 | FAM214B | SYSMH1 | Human | Oral cavity | OSCC | 2.28e-09 | 1.97e-01 | 0.1127 |
| 80256 | FAM214B | SYSMH3 | Human | Oral cavity | OSCC | 2.20e-10 | 3.11e-01 | 0.2442 |
| 80256 | FAM214B | SYSMH6 | Human | Oral cavity | OSCC | 4.25e-04 | 1.19e-01 | 0.1275 |
| Page: 1 |
| Tissue | Expression Dynamics | Abbreviation |
| Oral Cavity | 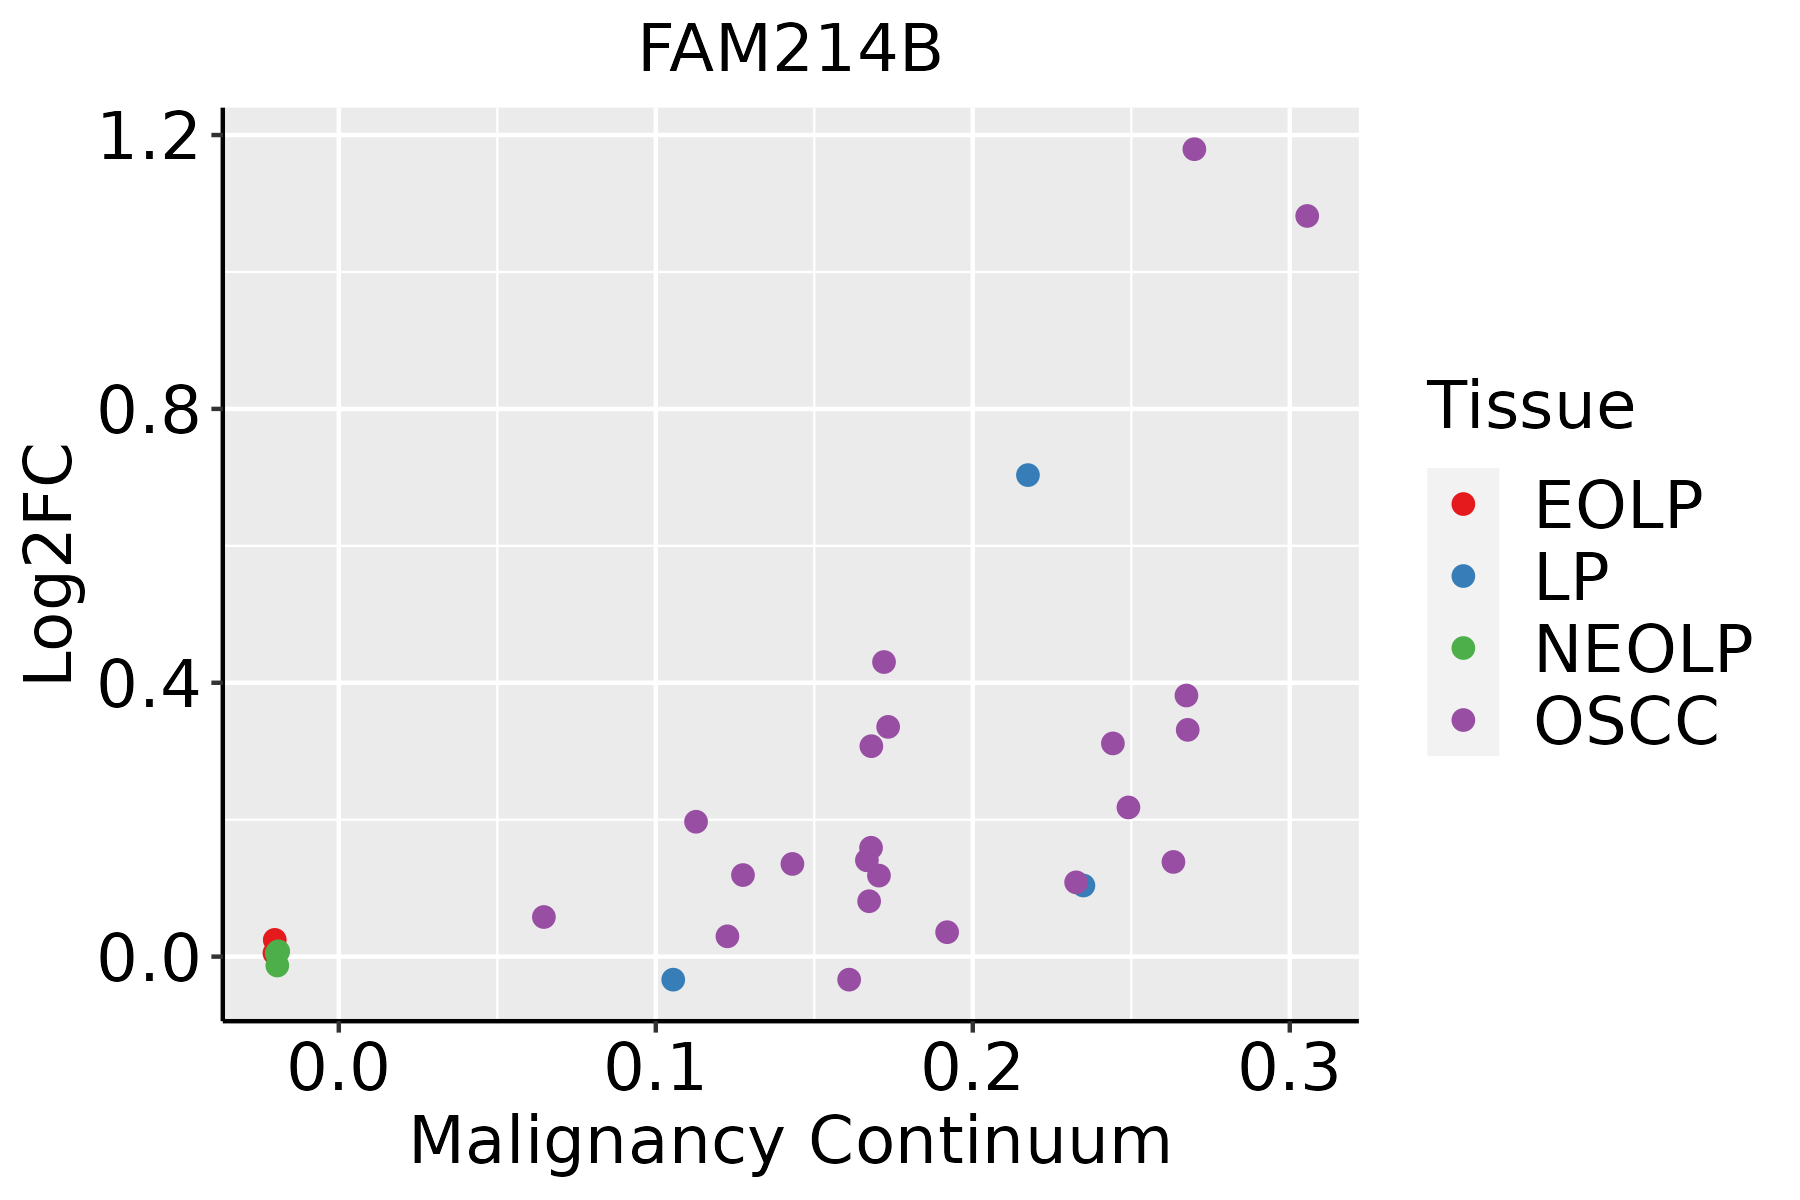 | EOLP: Erosive Oral lichen planus |
| LP: leukoplakia | ||
| NEOLP: Non-erosive oral lichen planus | ||
| OSCC: Oral squamous cell carcinoma |
| ∗log2FC in expression of this searched gene in stem-like cells from each diseased tissue sample relative to stem-like cells in normal samples in each tissue plotted against the malignancy continuum. Samples are colored based on if they are from different disease stage. |
Top |
Malignant transformation related pathway analysis |
| Find out the enriched GO biological processes and KEGG pathways involved in transition from healthy to precancer to cancer |
| Tissue | Disease Stage | Enriched GO biological Processes |
| Colorectum | AD |  |
| Colorectum | SER |  |
| Colorectum | MSS |  |
| Colorectum | MSI-H |  |
| Colorectum | FAP |  |
| ∗Top 15 enriched GO BP terms are showed in the bar plot of each disease state in each tissue. Each row represents a significant GO biological process which is colored according to the -log10(p.adjust). |
| Page: 1 2 3 4 5 6 7 8 9 |
| GO ID | Tissue | Disease Stage | Description | Gene Ratio | Bg Ratio | pvalue | p.adjust | Count |
| Page: 1 |
| Pathway ID | Tissue | Disease Stage | Description | Gene Ratio | Bg Ratio | pvalue | p.adjust | qvalue | Count |
| Page: 1 |
Top |
Cell-cell communication analysis |
| Identification of potential cell-cell interactions between two cell types and their ligand-receptor pairs for different disease states |
| Ligand | Receptor | LRpair | Pathway | Tissue | Disease Stage |
| Page: 1 |
Top |
Single-cell gene regulatory network inference analysis |
| Find out the significant the regulons (TFs) and the target genes of each regulon across cell types for different disease states |
| TF | Cell Type | Tissue | Disease Stage | Target Gene | RSS | Regulon Activity |
| ∗The dot plots of a searched regulon are shown for all cell subpopulations in each disease state of each tissue based on the regulon specific score inferred using pySCENIC and by calculating the average expression. |
| Page: 1 |
Top |
Somatic mutation of malignant transformation related genes |
| Annotation of somatic variants for genes involved in malignant transformation |
| Hugo Symbol | Variant Class | Variant Classification | dbSNP RS | HGVSc | HGVSp | HGVSp Short | SWISSPROT | BIOTYPE | SIFT | PolyPhen | Tumor Sample Barcode | Tissue | Histology | Sex | Age | Stage | Therapy Types | Drugs | Outcome |
| FAM214B | SNV | Missense_Mutation | c.644N>C | p.Glu215Ala | p.E215A | Q7L5A3 | protein_coding | tolerated_low_confidence(0.22) | benign(0.039) | TCGA-A8-A06T-01 | Breast | breast invasive carcinoma | Female | >=65 | III/IV | Hormone Therapy | anastrozole | SD | |
| FAM214B | SNV | Missense_Mutation | novel | c.748G>T | p.Ala250Ser | p.A250S | Q7L5A3 | protein_coding | tolerated(0.47) | benign(0.014) | TCGA-BH-A209-01 | Breast | breast invasive carcinoma | Female | >=65 | I/II | Unknown | Unknown | SD |
| FAM214B | SNV | Missense_Mutation | rs150303642 | c.1436N>A | p.Arg479His | p.R479H | Q7L5A3 | protein_coding | deleterious(0.01) | possibly_damaging(0.643) | TCGA-D8-A1J8-01 | Breast | breast invasive carcinoma | Female | >=65 | I/II | Hormone Therapy | nolvadex | SD |
| FAM214B | SNV | Missense_Mutation | rs764022442 | c.787N>T | p.Arg263Trp | p.R263W | Q7L5A3 | protein_coding | deleterious(0) | benign(0.386) | TCGA-HM-A4S6-01 | Cervix | cervical & endocervical cancer | Female | <65 | III/IV | Chemotherapy | cisplatin | CR |
| FAM214B | SNV | Missense_Mutation | c.1495C>A | p.Leu499Met | p.L499M | Q7L5A3 | protein_coding | deleterious(0) | probably_damaging(0.999) | TCGA-AA-3713-01 | Colorectum | colon adenocarcinoma | Male | >=65 | III/IV | Chemotherapy | 5-fluorouracil | PR | |
| FAM214B | SNV | Missense_Mutation | c.191N>T | p.Arg64Met | p.R64M | Q7L5A3 | protein_coding | deleterious_low_confidence(0) | probably_damaging(0.97) | TCGA-AA-A02R-01 | Colorectum | colon adenocarcinoma | Female | >=65 | I/II | Unknown | Unknown | PD | |
| FAM214B | SNV | Missense_Mutation | rs752543450 | c.793C>T | p.Arg265Cys | p.R265C | Q7L5A3 | protein_coding | deleterious(0.03) | benign(0) | TCGA-AZ-4313-01 | Colorectum | colon adenocarcinoma | Female | <65 | I/II | Unknown | Unknown | SD |
| FAM214B | SNV | Missense_Mutation | novel | c.782N>A | p.Ala261Asp | p.A261D | Q7L5A3 | protein_coding | deleterious(0.01) | benign(0.019) | TCGA-AZ-4315-01 | Colorectum | colon adenocarcinoma | Male | <65 | I/II | Unknown | Unknown | SD |
| FAM214B | SNV | Missense_Mutation | novel | c.890T>C | p.Val297Ala | p.V297A | Q7L5A3 | protein_coding | tolerated(1) | benign(0) | TCGA-CA-6717-01 | Colorectum | colon adenocarcinoma | Male | <65 | I/II | Chemotherapy | oxaliplatin | CR |
| FAM214B | SNV | Missense_Mutation | c.293C>A | p.Thr98Asn | p.T98N | Q7L5A3 | protein_coding | tolerated_low_confidence(0.24) | benign(0.062) | TCGA-D5-6930-01 | Colorectum | colon adenocarcinoma | Male | >=65 | I/II | Unknown | Unknown | SD |
| Page: 1 2 3 4 5 6 |
Top |
Related drugs of malignant transformation related genes |
| Identification of chemicals and drugs interact with genes involved in malignant transfromation |
| (DGIdb 4.0) |
| Entrez ID | Symbol | Category | Interaction Types | Drug Claim Name | Drug Name | PMIDs |
| Page: 1 |

Copyright 2023-Present -The University of Texas Health Science Center at Houston |