
|
|||||
|
 | |
| |
| |
| |
| |
| |
|
Gene: FAM210B |
Gene summary for FAM210B |
| Gene information | Species | Human | Gene symbol | FAM210B | Gene ID | 116151 |
| Gene name | family with sequence similarity 210 member B | |
| Gene Alias | 5A3 | |
| Cytomap | 20q13.2 | |
| Gene Type | protein-coding | GO ID | GO:0002262 | UniProtAcc | Q96KR6 |
Top |
Malignant transformation analysis |
| Identification of the aberrant gene expression in precancerous and cancerous lesions by comparing the gene expression of stem-like cells in diseased tissues with normal stem cells |
| Entrez ID | Symbol | Replicates | Species | Organ | Tissue | Adj P-value | Log2FC | Malignancy |
| 116151 | FAM210B | GSM4909281 | Human | Breast | IDC | 8.09e-04 | 2.91e-01 | 0.21 |
| 116151 | FAM210B | GSM4909282 | Human | Breast | IDC | 1.29e-10 | 3.81e-01 | -0.0288 |
| 116151 | FAM210B | GSM4909286 | Human | Breast | IDC | 1.13e-04 | 3.02e-01 | 0.1081 |
| 116151 | FAM210B | GSM4909296 | Human | Breast | IDC | 4.38e-03 | -7.38e-02 | 0.1524 |
| 116151 | FAM210B | GSM4909298 | Human | Breast | IDC | 3.51e-10 | 4.44e-01 | 0.1551 |
| 116151 | FAM210B | GSM4909301 | Human | Breast | IDC | 2.58e-09 | 5.13e-01 | 0.1577 |
| 116151 | FAM210B | GSM4909304 | Human | Breast | IDC | 1.04e-10 | 4.43e-01 | 0.1636 |
| 116151 | FAM210B | GSM4909311 | Human | Breast | IDC | 3.34e-09 | -1.13e-01 | 0.1534 |
| 116151 | FAM210B | GSM4909317 | Human | Breast | IDC | 3.86e-72 | 1.22e+00 | 0.1355 |
| 116151 | FAM210B | GSM4909318 | Human | Breast | IDC | 5.11e-31 | 1.34e+00 | 0.2031 |
| 116151 | FAM210B | GSM4909319 | Human | Breast | IDC | 5.09e-12 | -8.70e-02 | 0.1563 |
| 116151 | FAM210B | GSM4909321 | Human | Breast | IDC | 9.18e-04 | 2.84e-02 | 0.1559 |
| 116151 | FAM210B | NCCBC14 | Human | Breast | DCIS | 3.06e-04 | -5.25e-04 | 0.2021 |
| 116151 | FAM210B | NCCBC2 | Human | Breast | DCIS | 2.42e-03 | 3.94e-01 | 0.1554 |
| 116151 | FAM210B | NCCBC5 | Human | Breast | DCIS | 7.22e-03 | -4.10e-02 | 0.2046 |
| 116151 | FAM210B | P1 | Human | Breast | IDC | 6.93e-07 | 6.49e-03 | 0.1527 |
| 116151 | FAM210B | DCIS2 | Human | Breast | DCIS | 2.19e-61 | 3.94e-01 | 0.0085 |
| 116151 | FAM210B | HTA11_2487_2000001011 | Human | Colorectum | SER | 1.78e-02 | 1.78e-01 | -0.1808 |
| 116151 | FAM210B | HTA11_1938_2000001011 | Human | Colorectum | AD | 4.69e-08 | 3.53e-01 | -0.0811 |
| 116151 | FAM210B | HTA11_78_2000001011 | Human | Colorectum | AD | 1.37e-09 | 3.24e-01 | -0.1088 |
| Page: 1 2 3 4 5 6 7 8 9 |
| Tissue | Expression Dynamics | Abbreviation |
| Breast |  | IDC: Invasive ductal carcinoma |
| DCIS: Ductal carcinoma in situ | ||
| Precancer(BRCA1-mut): Precancerous lesion from BRCA1 mutation carriers | ||
| Colorectum (GSE201348) |  | FAP: Familial adenomatous polyposis |
| CRC: Colorectal cancer | ||
| Colorectum (HTA11) |  | AD: Adenomas |
| SER: Sessile serrated lesions | ||
| MSI-H: Microsatellite-high colorectal cancer | ||
| MSS: Microsatellite stable colorectal cancer | ||
| Esophagus |  | ESCC: Esophageal squamous cell carcinoma |
| HGIN: High-grade intraepithelial neoplasias | ||
| LGIN: Low-grade intraepithelial neoplasias | ||
| Liver | 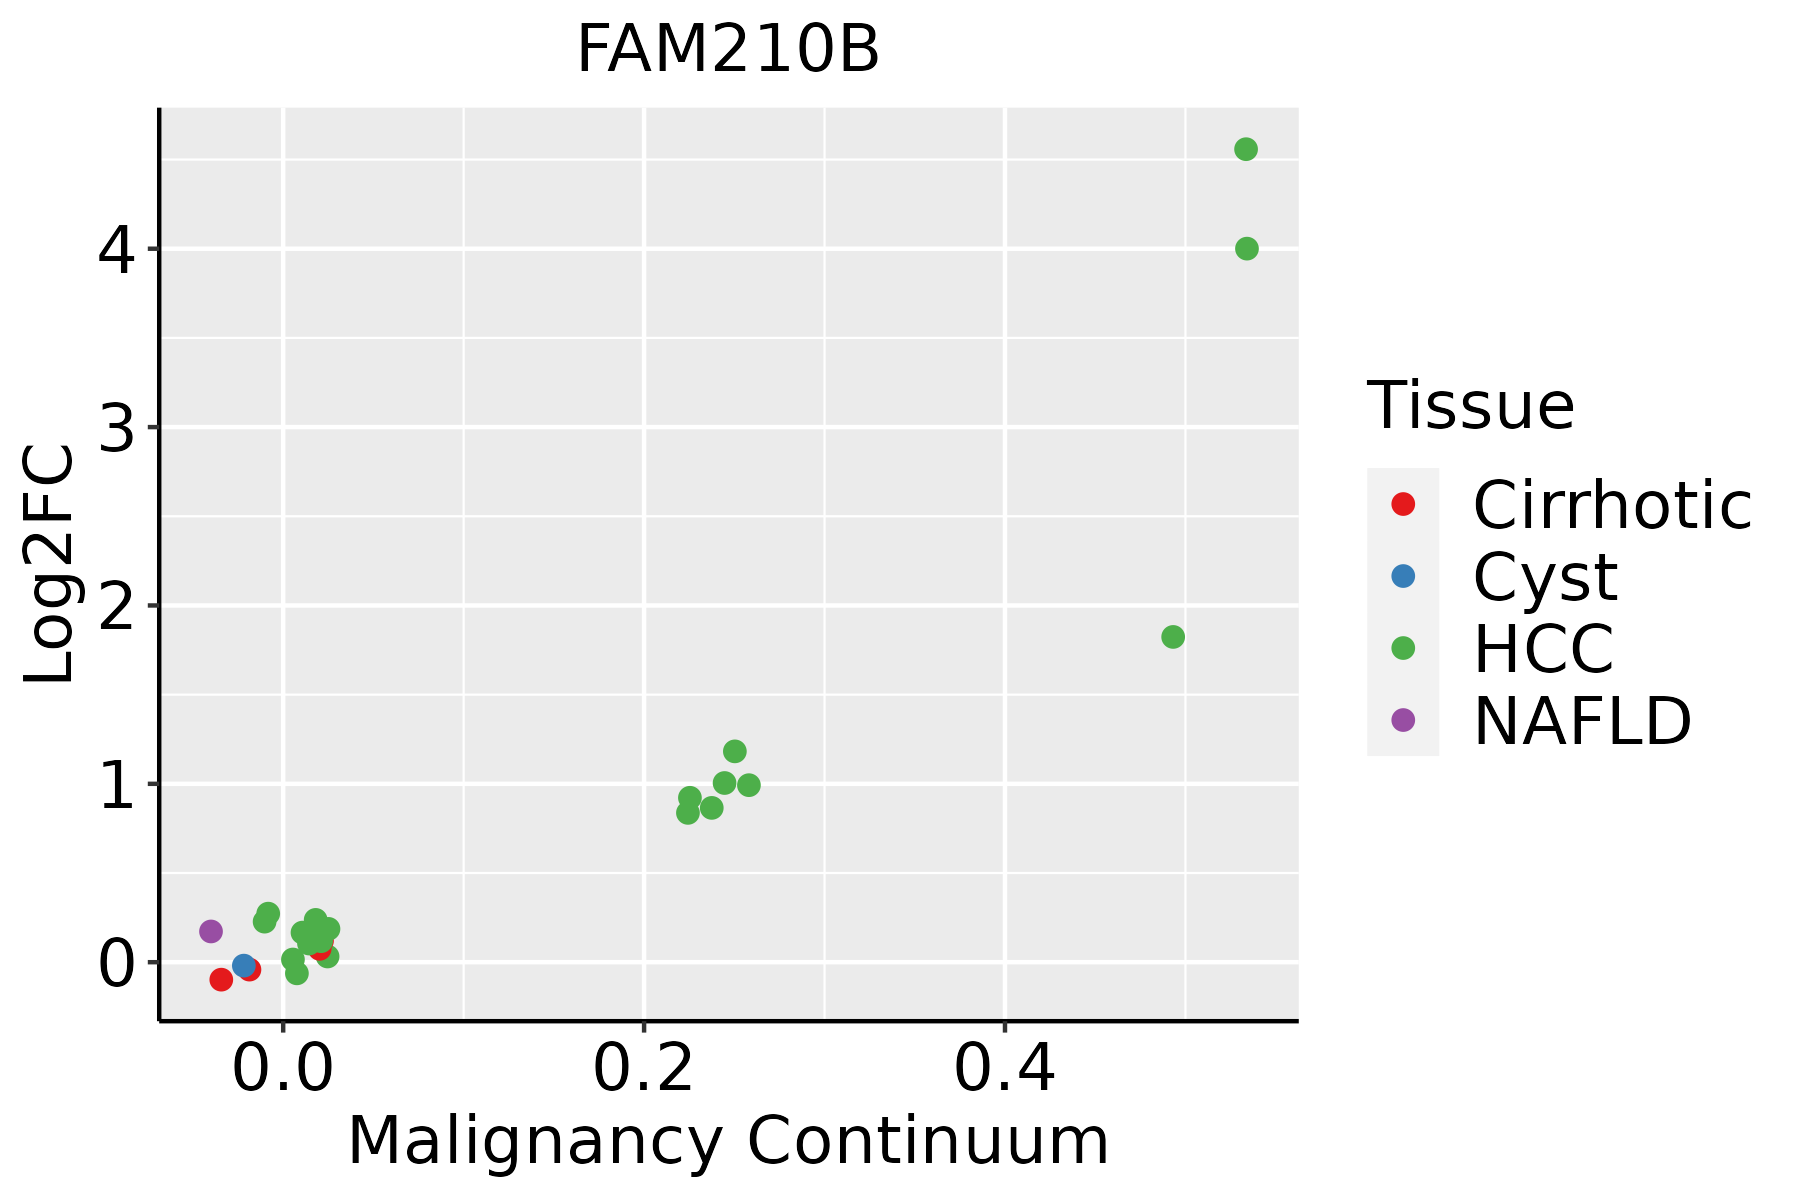 | HCC: Hepatocellular carcinoma |
| NAFLD: Non-alcoholic fatty liver disease | ||
| Oral Cavity | 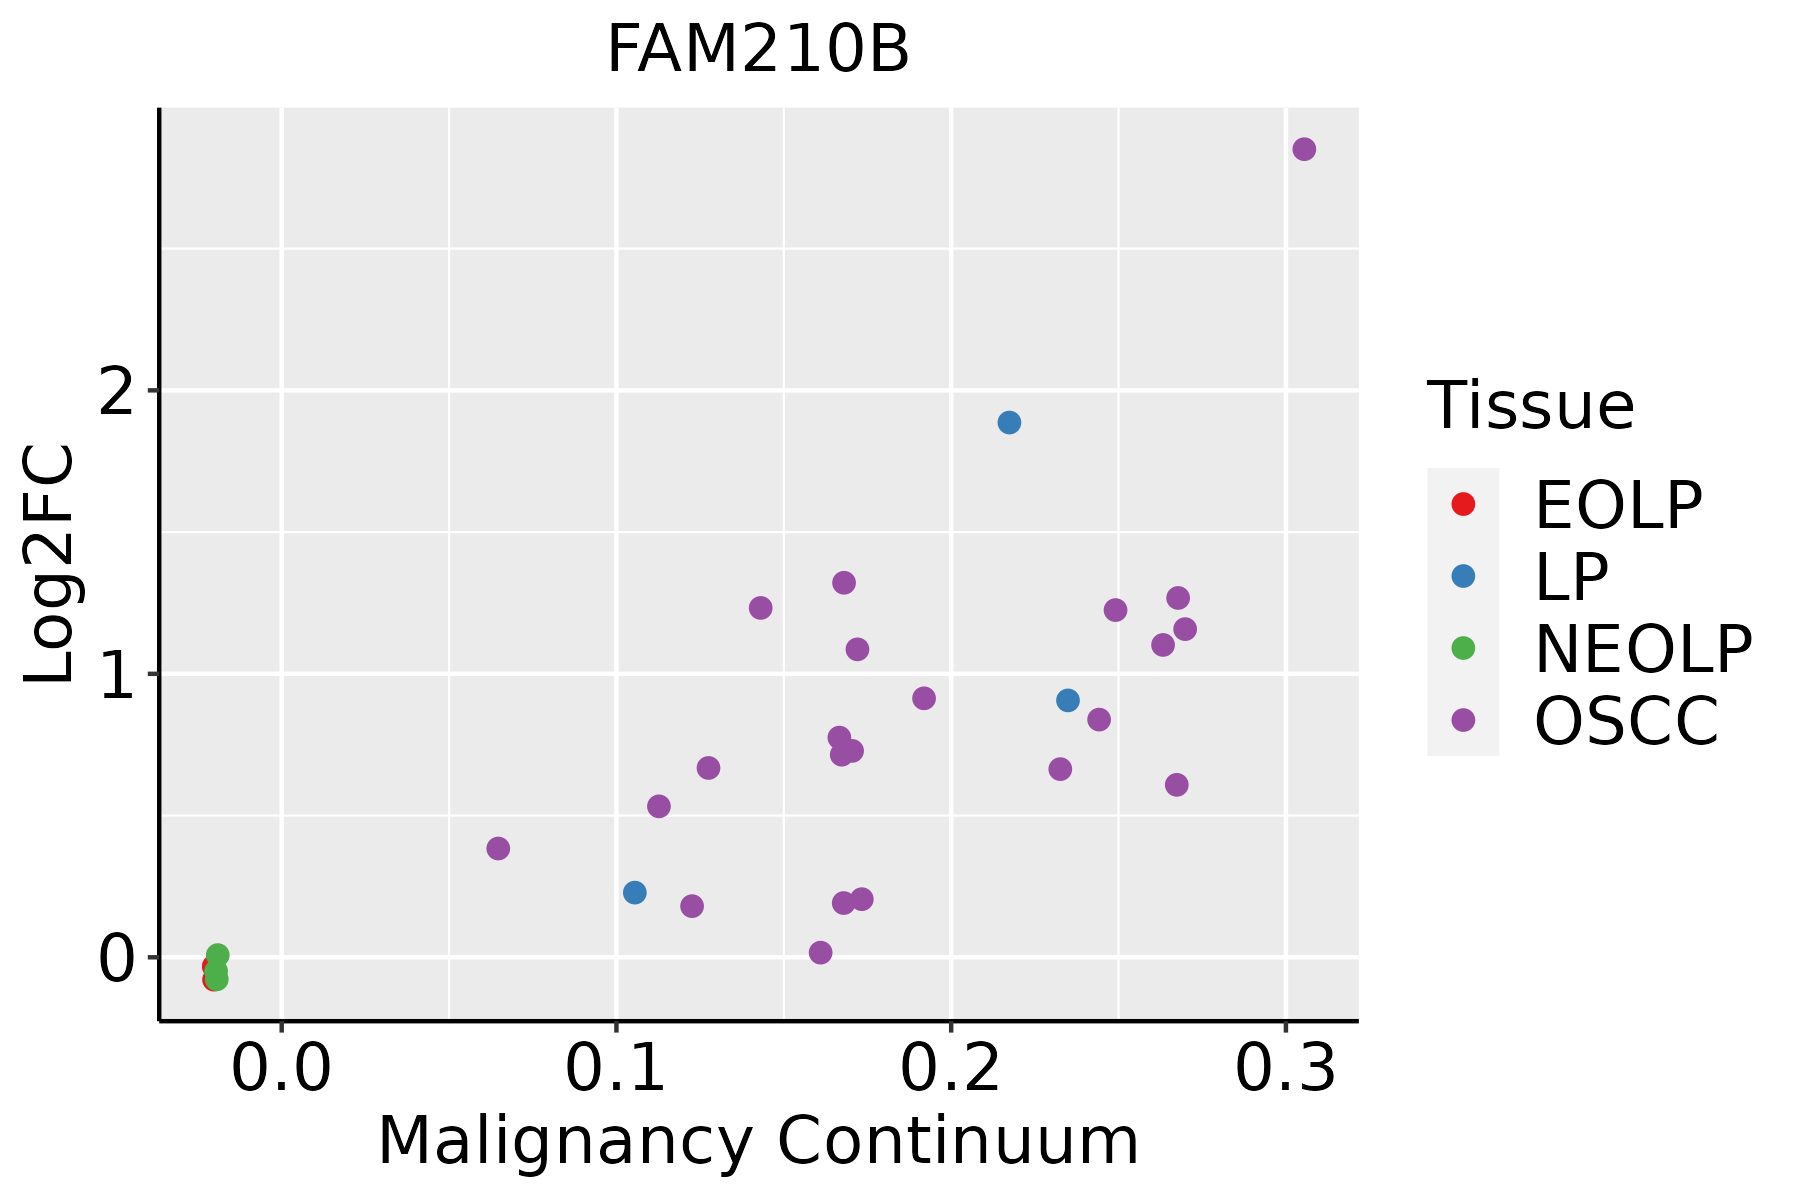 | EOLP: Erosive Oral lichen planus |
| LP: leukoplakia | ||
| NEOLP: Non-erosive oral lichen planus | ||
| OSCC: Oral squamous cell carcinoma | ||
| Prostate | 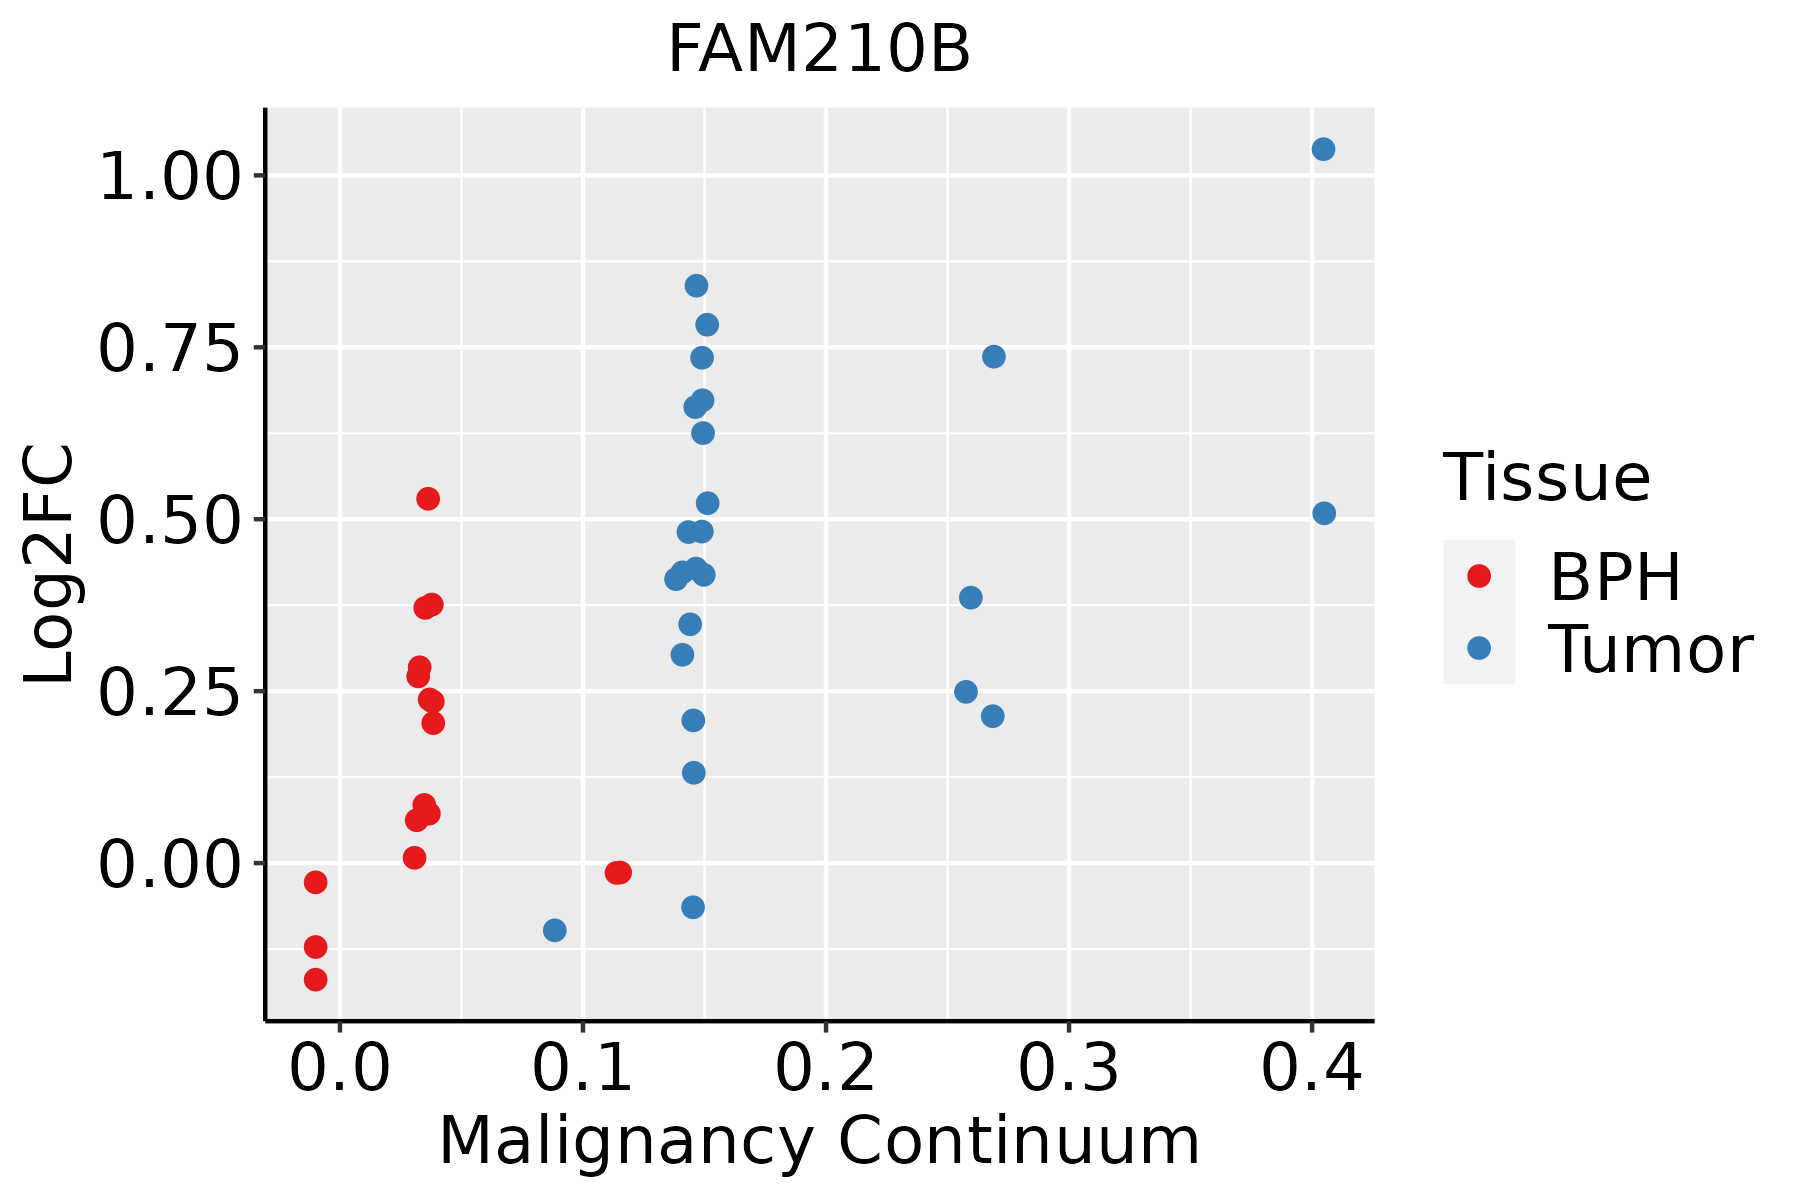 | BPH: Benign Prostatic Hyperplasia |
| Skin | 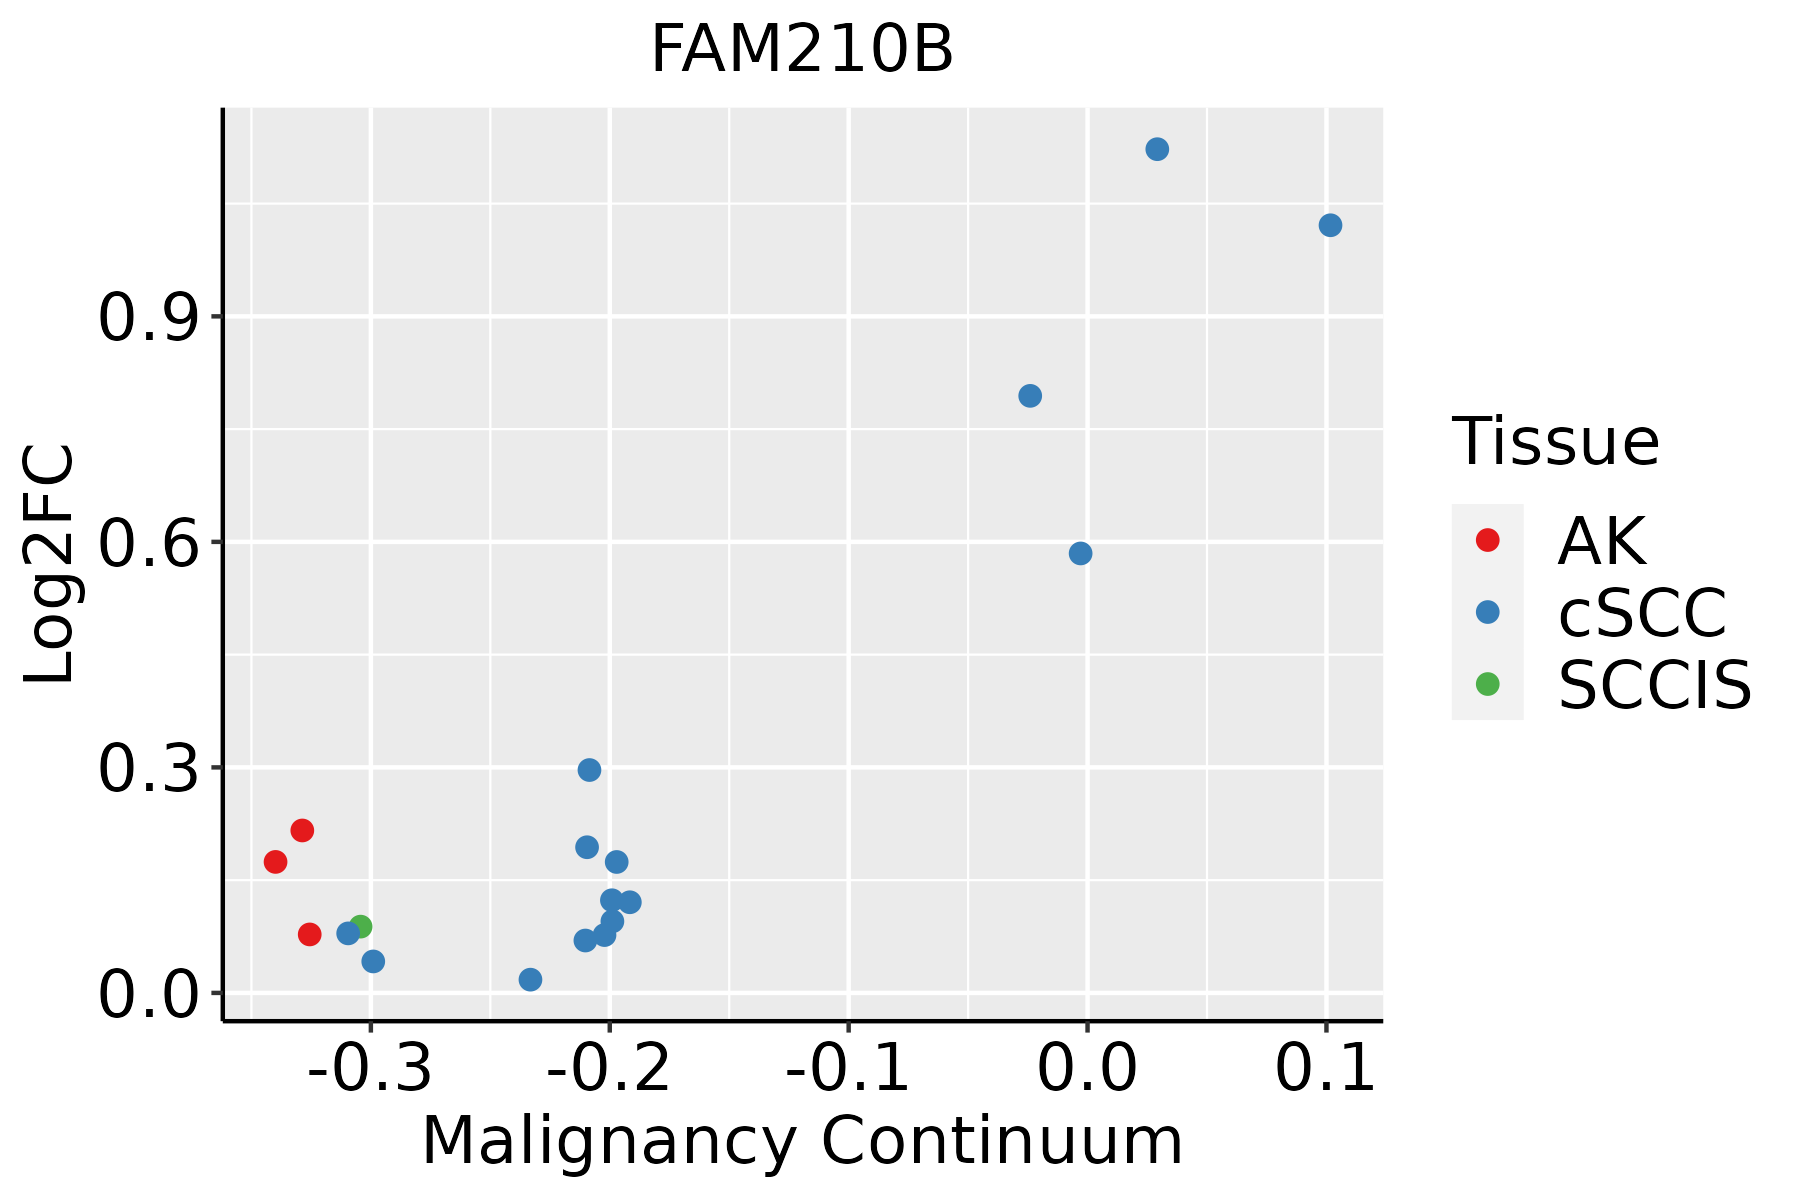 | AK: Actinic keratosis |
| cSCC: Cutaneous squamous cell carcinoma | ||
| SCCIS:squamous cell carcinoma in situ | ||
| Thyroid | 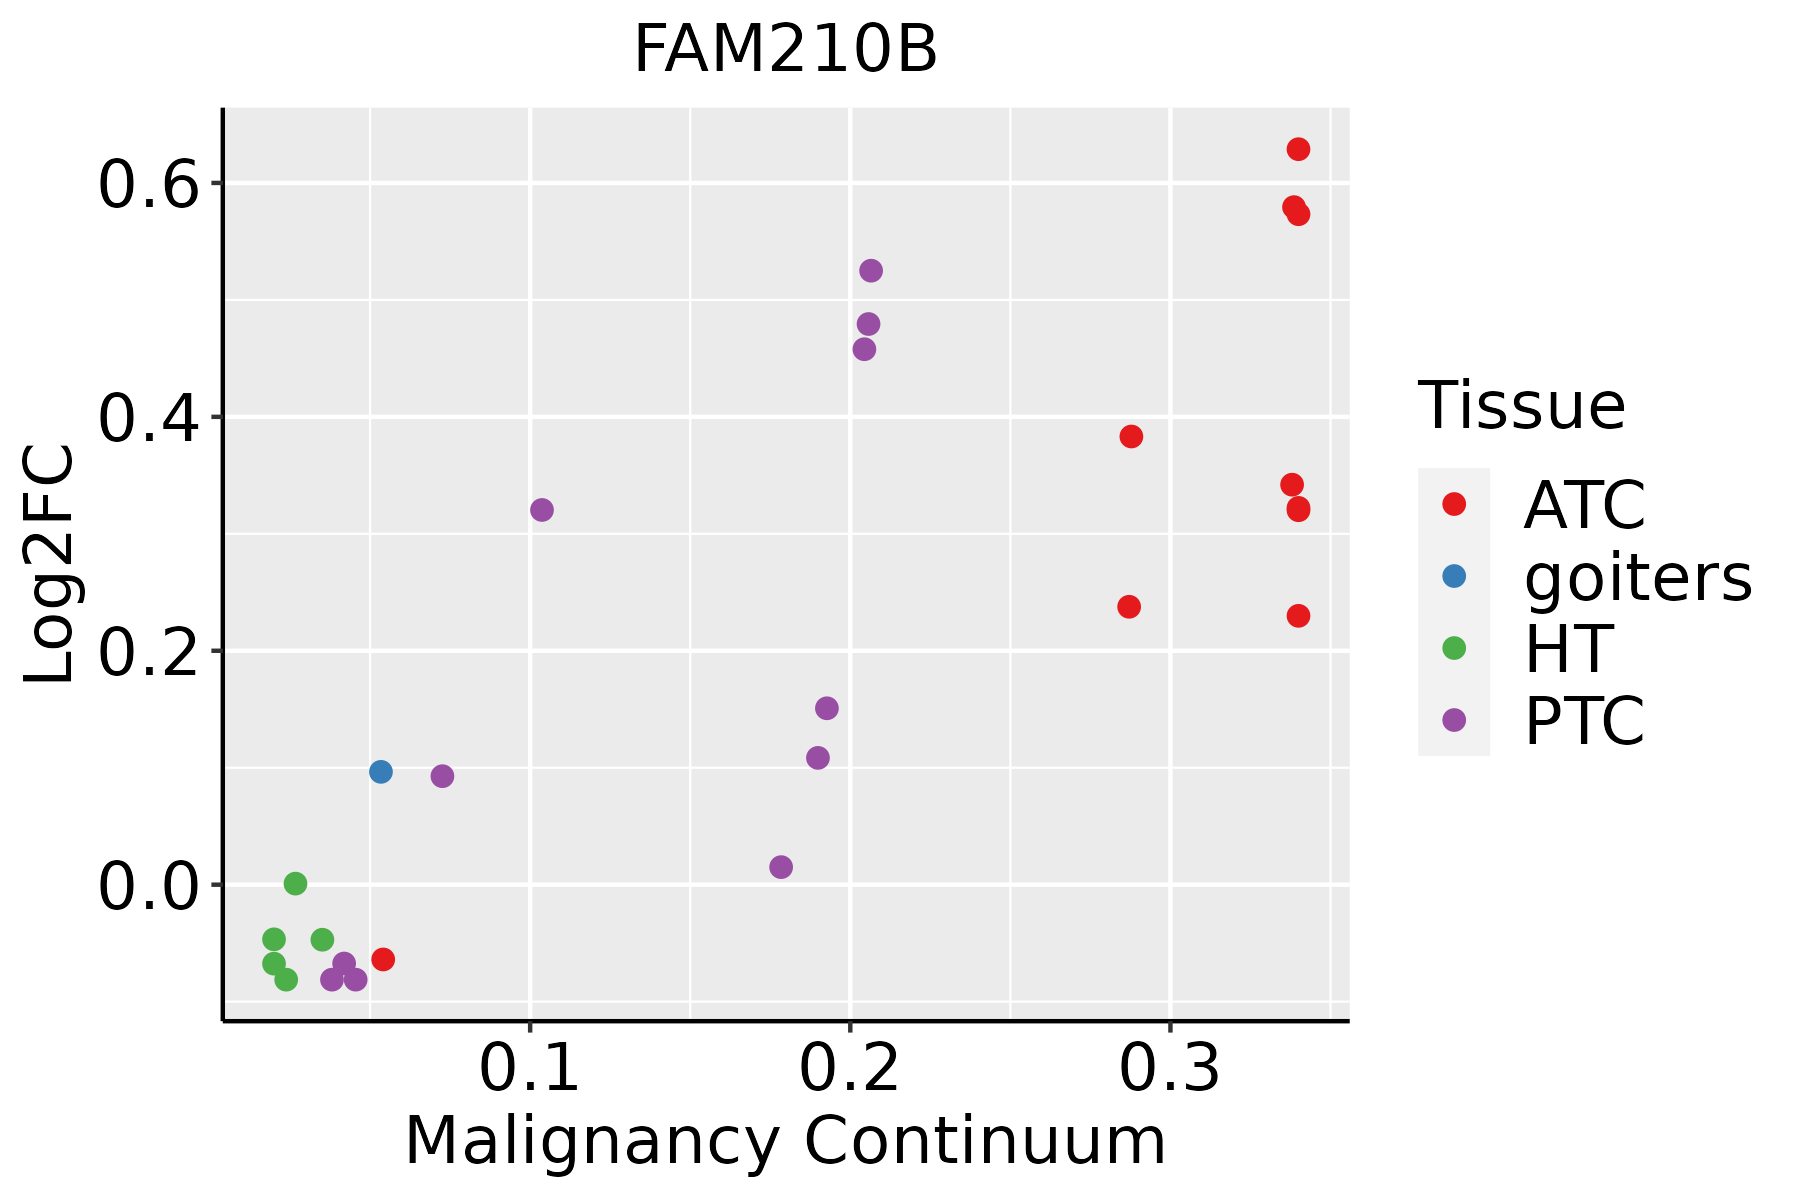 | ATC: Anaplastic thyroid cancer |
| HT: Hashimoto's thyroiditis | ||
| PTC: Papillary thyroid cancer |
| ∗log2FC in expression of this searched gene in stem-like cells from each diseased tissue sample relative to stem-like cells in normal samples in each tissue plotted against the malignancy continuum. Samples are colored based on if they are from different disease stage. |
Top |
Malignant transformation related pathway analysis |
| Find out the enriched GO biological processes and KEGG pathways involved in transition from healthy to precancer to cancer |
| Tissue | Disease Stage | Enriched GO biological Processes |
| Colorectum | AD |  |
| Colorectum | SER |  |
| Colorectum | MSS |  |
| Colorectum | MSI-H |  |
| Colorectum | FAP |  |
| ∗Top 15 enriched GO BP terms are showed in the bar plot of each disease state in each tissue. Each row represents a significant GO biological process which is colored according to the -log10(p.adjust). |
| Page: 1 2 3 4 5 6 7 8 9 |
| GO ID | Tissue | Disease Stage | Description | Gene Ratio | Bg Ratio | pvalue | p.adjust | Count |
| GO:003410114 | Breast | IDC | erythrocyte homeostasis | 27/1434 | 129/18723 | 1.34e-06 | 5.75e-05 | 27 |
| GO:000226214 | Breast | IDC | myeloid cell homeostasis | 30/1434 | 157/18723 | 2.64e-06 | 1.01e-04 | 30 |
| GO:003235512 | Breast | IDC | response to estradiol | 27/1434 | 141/18723 | 7.87e-06 | 2.35e-04 | 27 |
| GO:003009914 | Breast | IDC | myeloid cell differentiation | 54/1434 | 381/18723 | 8.07e-06 | 2.39e-04 | 54 |
| GO:190370612 | Breast | IDC | regulation of hemopoiesis | 49/1434 | 367/18723 | 9.74e-05 | 1.86e-03 | 49 |
| GO:003021814 | Breast | IDC | erythrocyte differentiation | 22/1434 | 120/18723 | 1.04e-04 | 1.97e-03 | 22 |
| GO:004563714 | Breast | IDC | regulation of myeloid cell differentiation | 32/1434 | 210/18723 | 1.41e-04 | 2.50e-03 | 32 |
| GO:004564613 | Breast | IDC | regulation of erythrocyte differentiation | 12/1434 | 47/18723 | 1.63e-04 | 2.78e-03 | 12 |
| GO:004563912 | Breast | IDC | positive regulation of myeloid cell differentiation | 18/1434 | 103/18723 | 7.77e-04 | 9.37e-03 | 18 |
| GO:004887214 | Breast | IDC | homeostasis of number of cells | 36/1434 | 272/18723 | 9.10e-04 | 1.04e-02 | 36 |
| GO:0045648 | Breast | IDC | positive regulation of erythrocyte differentiation | 8/1434 | 33/18723 | 2.85e-03 | 2.49e-02 | 8 |
| GO:003410124 | Breast | DCIS | erythrocyte homeostasis | 27/1390 | 129/18723 | 7.31e-07 | 3.06e-05 | 27 |
| GO:000226224 | Breast | DCIS | myeloid cell homeostasis | 30/1390 | 157/18723 | 1.39e-06 | 5.33e-05 | 30 |
| GO:003009924 | Breast | DCIS | myeloid cell differentiation | 55/1390 | 381/18723 | 1.50e-06 | 5.68e-05 | 55 |
| GO:004563722 | Breast | DCIS | regulation of myeloid cell differentiation | 34/1390 | 210/18723 | 1.33e-05 | 3.32e-04 | 34 |
| GO:003235521 | Breast | DCIS | response to estradiol | 26/1390 | 141/18723 | 1.34e-05 | 3.33e-04 | 26 |
| GO:190370622 | Breast | DCIS | regulation of hemopoiesis | 50/1390 | 367/18723 | 2.21e-05 | 5.23e-04 | 50 |
| GO:003021823 | Breast | DCIS | erythrocyte differentiation | 22/1390 | 120/18723 | 6.60e-05 | 1.31e-03 | 22 |
| GO:004564621 | Breast | DCIS | regulation of erythrocyte differentiation | 12/1390 | 47/18723 | 1.22e-04 | 2.11e-03 | 12 |
| GO:004563921 | Breast | DCIS | positive regulation of myeloid cell differentiation | 19/1390 | 103/18723 | 1.86e-04 | 3.03e-03 | 19 |
| Page: 1 2 3 4 5 6 7 8 |
| Pathway ID | Tissue | Disease Stage | Description | Gene Ratio | Bg Ratio | pvalue | p.adjust | qvalue | Count |
| Page: 1 |
Top |
Cell-cell communication analysis |
| Identification of potential cell-cell interactions between two cell types and their ligand-receptor pairs for different disease states |
| Ligand | Receptor | LRpair | Pathway | Tissue | Disease Stage |
| Page: 1 |
Top |
Single-cell gene regulatory network inference analysis |
| Find out the significant the regulons (TFs) and the target genes of each regulon across cell types for different disease states |
| TF | Cell Type | Tissue | Disease Stage | Target Gene | RSS | Regulon Activity |
| ∗The dot plots of a searched regulon are shown for all cell subpopulations in each disease state of each tissue based on the regulon specific score inferred using pySCENIC and by calculating the average expression. |
| Page: 1 |
Top |
Somatic mutation of malignant transformation related genes |
| Annotation of somatic variants for genes involved in malignant transformation |
| Hugo Symbol | Variant Class | Variant Classification | dbSNP RS | HGVSc | HGVSp | HGVSp Short | SWISSPROT | BIOTYPE | SIFT | PolyPhen | Tumor Sample Barcode | Tissue | Histology | Sex | Age | Stage | Therapy Types | Drugs | Outcome |
| FAM210B | SNV | Missense_Mutation | c.342A>G | p.Ile114Met | p.I114M | Q96KR6 | protein_coding | tolerated(0.26) | benign(0.125) | TCGA-AC-A3TN-01 | Breast | breast invasive carcinoma | Female | >=65 | I/II | Hormone Therapy | arimidex | SD | |
| FAM210B | SNV | Missense_Mutation | c.491G>C | p.Arg164Thr | p.R164T | Q96KR6 | protein_coding | deleterious(0) | probably_damaging(1) | TCGA-E2-A10C-01 | Breast | breast invasive carcinoma | Female | <65 | I/II | Chemotherapy | cytoxan | SD | |
| FAM210B | SNV | Missense_Mutation | novel | c.235G>A | p.Glu79Lys | p.E79K | Q96KR6 | protein_coding | tolerated(0.27) | benign(0.01) | TCGA-GM-A2DI-01 | Breast | breast invasive carcinoma | Female | <65 | I/II | Chemotherapy | taxotere | CR |
| FAM210B | SNV | Missense_Mutation | rs201707629 | c.415N>T | p.Val139Leu | p.V139L | Q96KR6 | protein_coding | tolerated(0.31) | benign(0.115) | TCGA-A5-A1OF-01 | Endometrium | uterine corpus endometrioid carcinoma | Female | <65 | I/II | Unknown | Unknown | SD |
| FAM210B | insertion | Frame_Shift_Ins | novel | c.274_275insT | p.Gln94SerfsTer42 | p.Q94Sfs*42 | Q96KR6 | protein_coding | TCGA-AJ-A3BH-01 | Endometrium | uterine corpus endometrioid carcinoma | Female | Unknown | I/II | Unknown | Unknown | SD | ||
| FAM210B | insertion | Frame_Shift_Ins | novel | c.362_362+1insTGGTGTGGACATGCCT | p.Ala127TrpfsTer14 | p.A127Wfs*14 | Q96KR6 | protein_coding | TCGA-22-5492-01 | Lung | lung squamous cell carcinoma | Female | >=65 | III/IV | Unknown | Unknown | SD | ||
| FAM210B | SNV | Missense_Mutation | rs534520658 | c.451N>A | p.Val151Met | p.V151M | Q96KR6 | protein_coding | deleterious(0.01) | probably_damaging(0.992) | TCGA-QK-A6VB-01 | Oral cavity | head & neck squamous cell carcinoma | Male | >=65 | I/II | Unknown | Unknown | PD |
| Page: 1 |
Top |
Related drugs of malignant transformation related genes |
| Identification of chemicals and drugs interact with genes involved in malignant transfromation |
| (DGIdb 4.0) |
| Entrez ID | Symbol | Category | Interaction Types | Drug Claim Name | Drug Name | PMIDs |
| Page: 1 |

Copyright 2023-Present -The University of Texas Health Science Center at Houston |