
|
|||||
|
 | |
| |
| |
| |
| |
| |
|
Gene: FAM20C |
Gene summary for FAM20C |
| Gene information | Species | Human | Gene symbol | FAM20C | Gene ID | 56975 |
| Gene name | FAM20C golgi associated secretory pathway kinase | |
| Gene Alias | DMP-4 | |
| Cytomap | 7p22.3 | |
| Gene Type | protein-coding | GO ID | GO:0002065 | UniProtAcc | Q8IXL6 |
Top |
Malignant transformation analysis |
| Identification of the aberrant gene expression in precancerous and cancerous lesions by comparing the gene expression of stem-like cells in diseased tissues with normal stem cells |
| Entrez ID | Symbol | Replicates | Species | Organ | Tissue | Adj P-value | Log2FC | Malignancy |
| 56975 | FAM20C | HCC1_Meng | Human | Liver | HCC | 3.49e-19 | 2.10e-02 | 0.0246 |
| 56975 | FAM20C | HCC2_Meng | Human | Liver | HCC | 5.72e-09 | 5.83e-02 | 0.0107 |
| 56975 | FAM20C | HCC1 | Human | Liver | HCC | 1.02e-08 | 3.35e+00 | 0.5336 |
| 56975 | FAM20C | HCC2 | Human | Liver | HCC | 7.61e-12 | 3.12e+00 | 0.5341 |
| 56975 | FAM20C | S014 | Human | Liver | HCC | 5.86e-07 | 3.98e-01 | 0.2254 |
| 56975 | FAM20C | S015 | Human | Liver | HCC | 3.22e-03 | 4.10e-01 | 0.2375 |
| 56975 | FAM20C | S016 | Human | Liver | HCC | 7.73e-09 | 5.00e-01 | 0.2243 |
| 56975 | FAM20C | S027 | Human | Liver | HCC | 5.10e-05 | 6.72e-01 | 0.2446 |
| 56975 | FAM20C | S028 | Human | Liver | HCC | 2.84e-13 | 7.89e-01 | 0.2503 |
| 56975 | FAM20C | S029 | Human | Liver | HCC | 5.40e-12 | 6.59e-01 | 0.2581 |
| 56975 | FAM20C | male-WTA | Human | Thyroid | PTC | 5.92e-18 | 2.22e-01 | 0.1037 |
| 56975 | FAM20C | PTC01 | Human | Thyroid | PTC | 2.68e-03 | 1.24e-01 | 0.1899 |
| 56975 | FAM20C | PTC04 | Human | Thyroid | PTC | 3.57e-03 | 1.64e-01 | 0.1927 |
| 56975 | FAM20C | PTC05 | Human | Thyroid | PTC | 7.29e-09 | 3.76e-01 | 0.2065 |
| 56975 | FAM20C | PTC06 | Human | Thyroid | PTC | 5.56e-29 | 6.46e-01 | 0.2057 |
| 56975 | FAM20C | PTC07 | Human | Thyroid | PTC | 3.40e-20 | 2.57e-01 | 0.2044 |
| 56975 | FAM20C | ATC09 | Human | Thyroid | ATC | 7.41e-11 | 3.88e-01 | 0.2871 |
| 56975 | FAM20C | ATC12 | Human | Thyroid | ATC | 3.99e-40 | 1.09e+00 | 0.34 |
| 56975 | FAM20C | ATC13 | Human | Thyroid | ATC | 8.40e-31 | 5.94e-01 | 0.34 |
| 56975 | FAM20C | ATC1 | Human | Thyroid | ATC | 3.33e-12 | 3.25e-01 | 0.2878 |
| Page: 1 2 |
| Tissue | Expression Dynamics | Abbreviation |
| Liver | 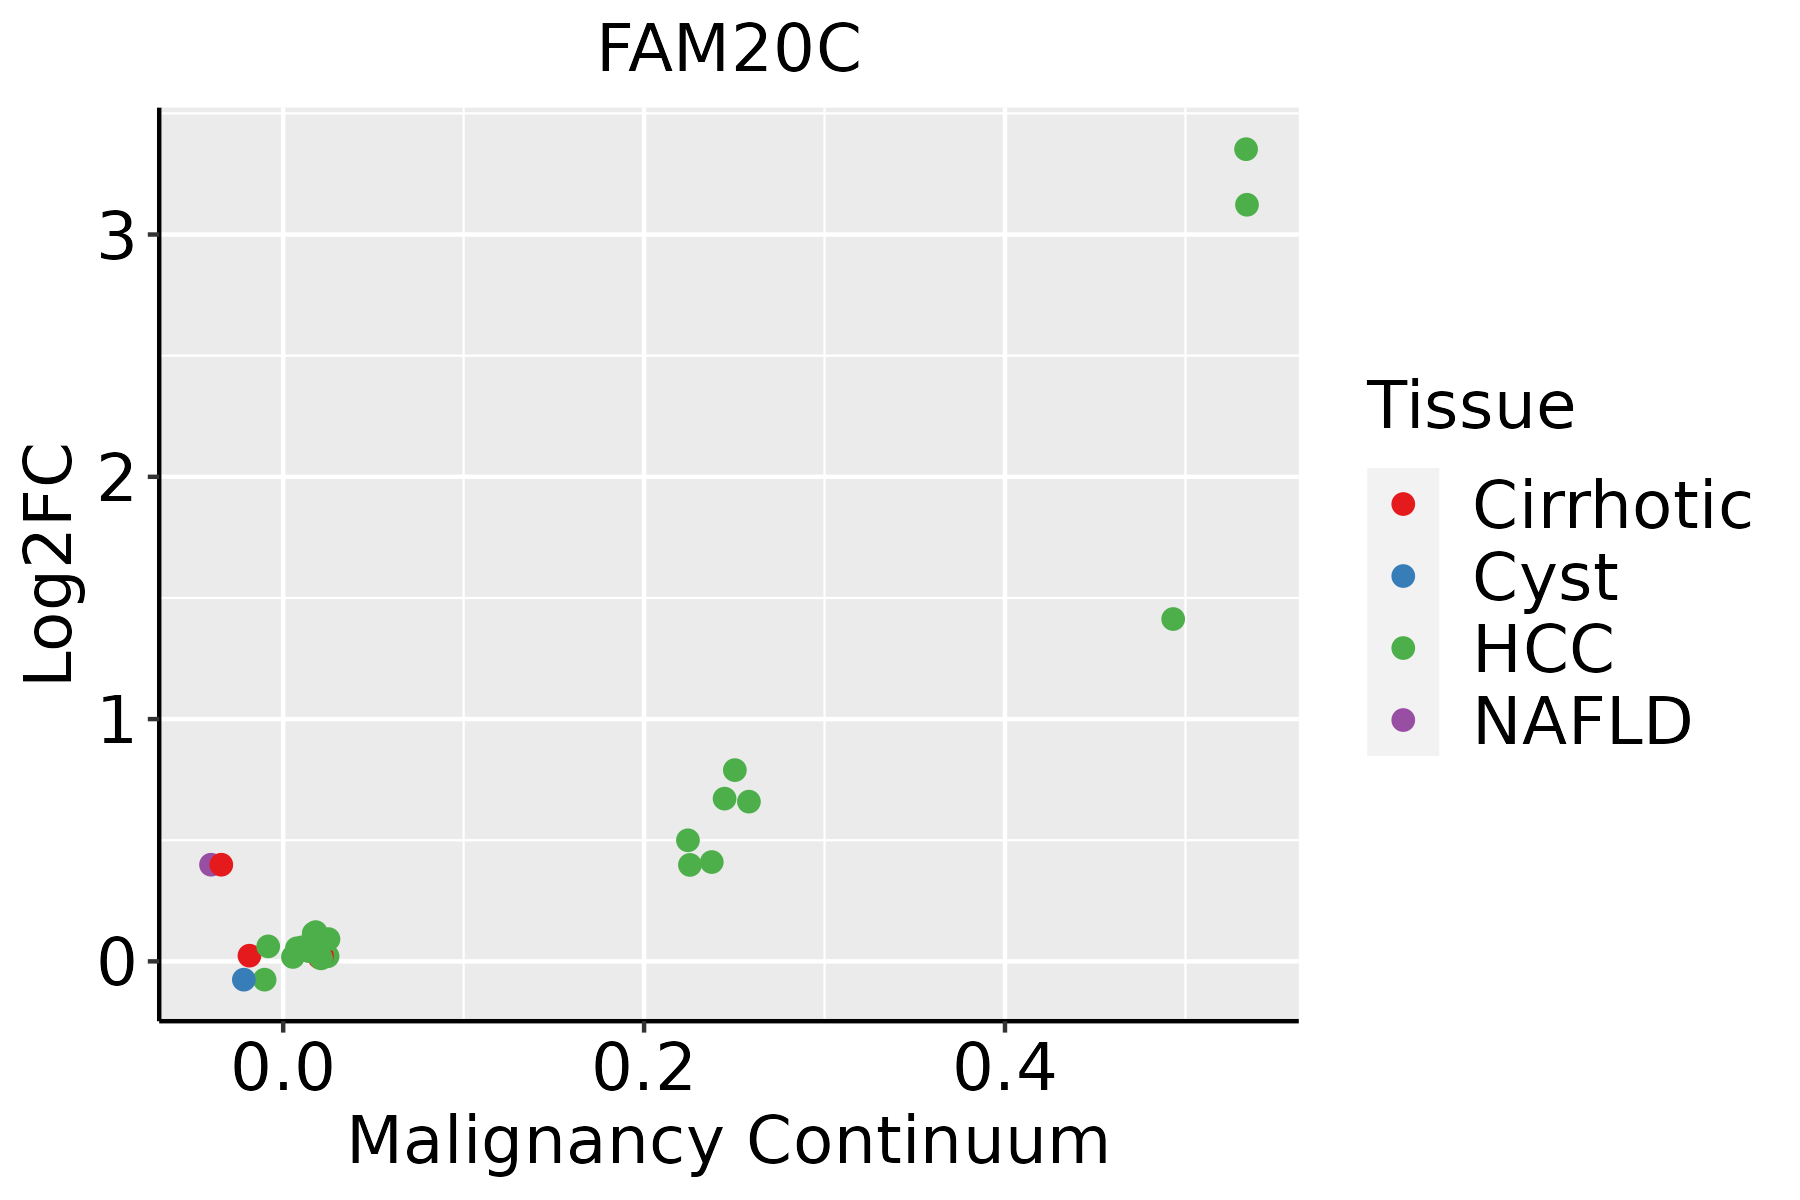 | HCC: Hepatocellular carcinoma |
| NAFLD: Non-alcoholic fatty liver disease | ||
| Thyroid | 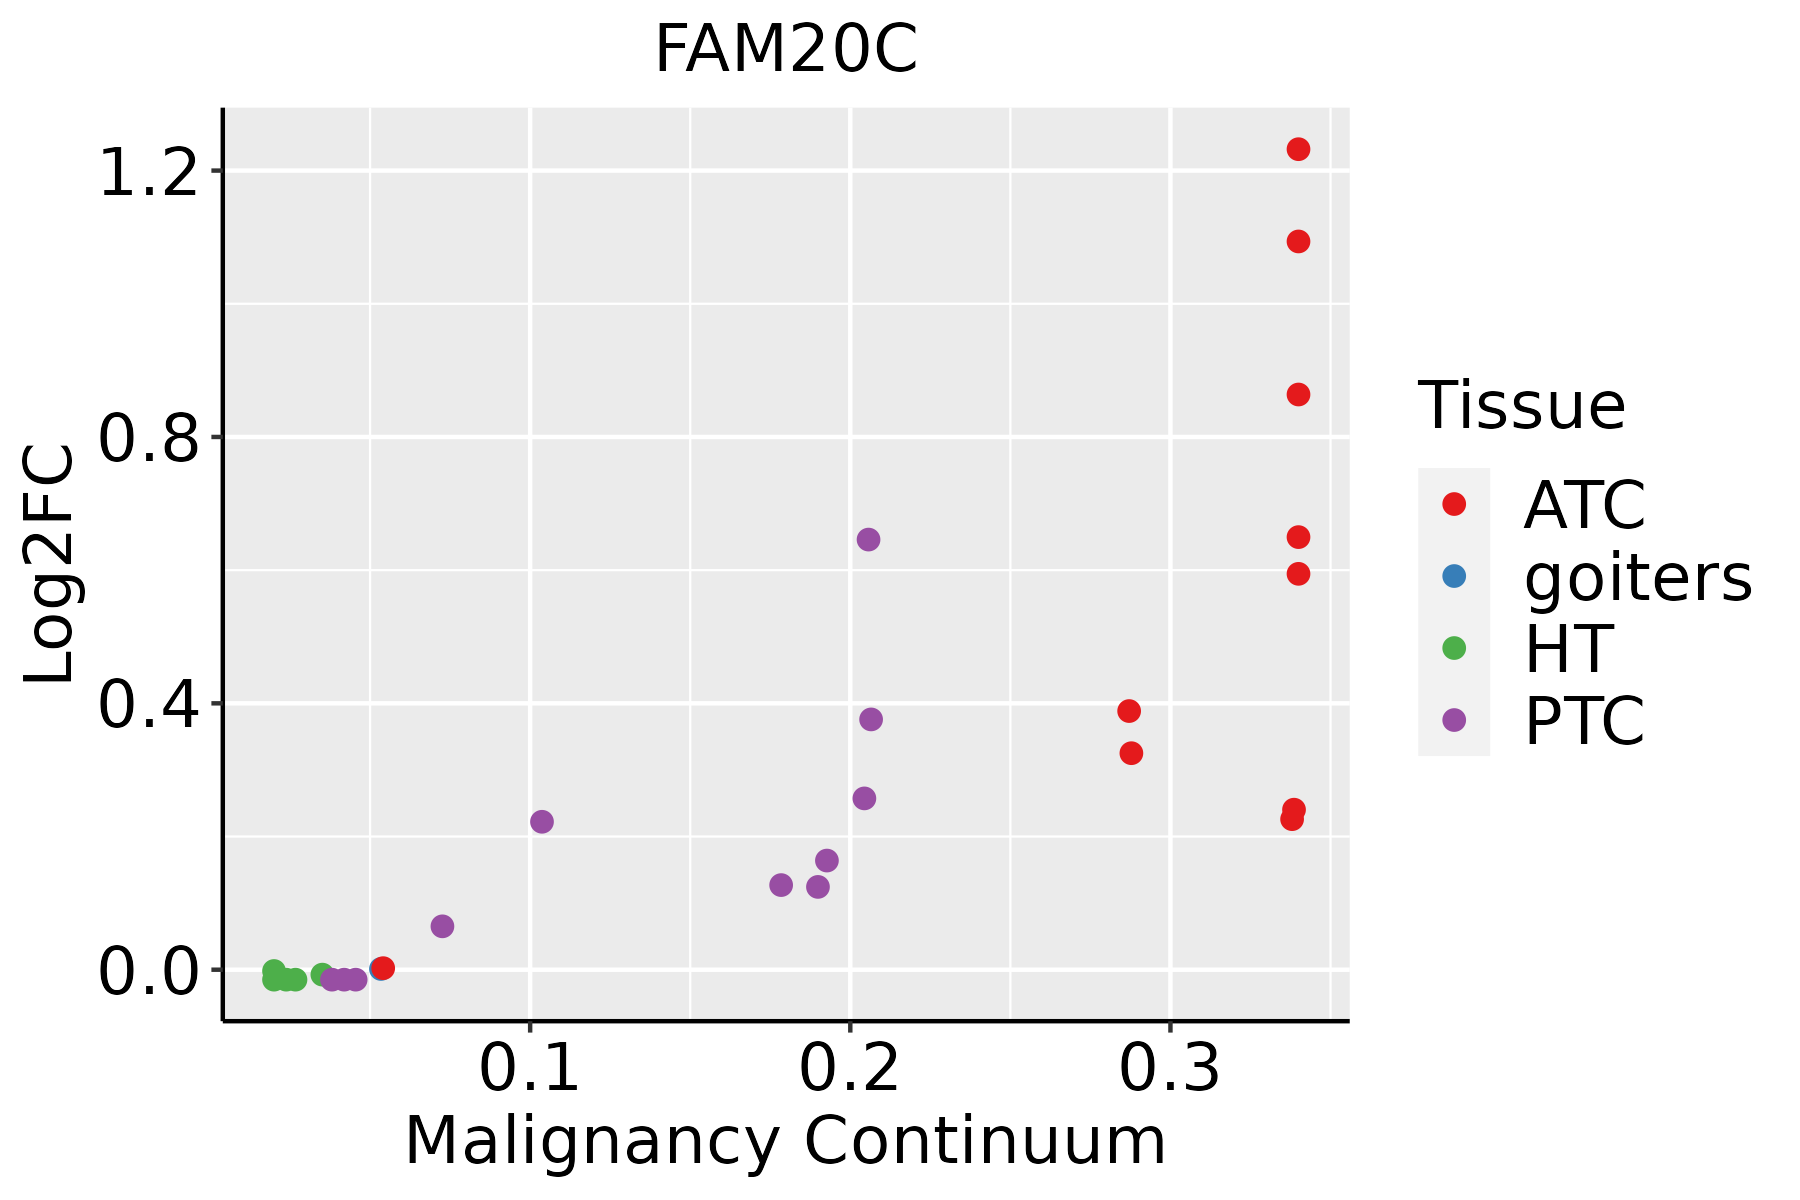 | ATC: Anaplastic thyroid cancer |
| HT: Hashimoto's thyroiditis | ||
| PTC: Papillary thyroid cancer |
| ∗log2FC in expression of this searched gene in stem-like cells from each diseased tissue sample relative to stem-like cells in normal samples in each tissue plotted against the malignancy continuum. Samples are colored based on if they are from different disease stage. |
Top |
Malignant transformation related pathway analysis |
| Find out the enriched GO biological processes and KEGG pathways involved in transition from healthy to precancer to cancer |
| Tissue | Disease Stage | Enriched GO biological Processes |
| Colorectum | AD |  |
| Colorectum | SER |  |
| Colorectum | MSS |  |
| Colorectum | MSI-H |  |
| Colorectum | FAP |  |
| ∗Top 15 enriched GO BP terms are showed in the bar plot of each disease state in each tissue. Each row represents a significant GO biological process which is colored according to the -log10(p.adjust). |
| Page: 1 2 3 4 5 6 7 8 9 |
| GO ID | Tissue | Disease Stage | Description | Gene Ratio | Bg Ratio | pvalue | p.adjust | Count |
| GO:004603422 | Liver | HCC | ATP metabolic process | 198/7958 | 277/18723 | 8.30e-23 | 1.55e-20 | 198 |
| GO:0043687 | Liver | HCC | post-translational protein modification | 24/7958 | 37/18723 | 5.03e-03 | 2.11e-02 | 24 |
| GO:0046034113 | Thyroid | PTC | ATP metabolic process | 167/5968 | 277/18723 | 1.18e-22 | 2.66e-20 | 167 |
| GO:004603434 | Thyroid | ATC | ATP metabolic process | 167/6293 | 277/18723 | 5.60e-20 | 8.64e-18 | 167 |
| Page: 1 |
| Pathway ID | Tissue | Disease Stage | Description | Gene Ratio | Bg Ratio | pvalue | p.adjust | qvalue | Count |
| Page: 1 |
Top |
Cell-cell communication analysis |
| Identification of potential cell-cell interactions between two cell types and their ligand-receptor pairs for different disease states |
| Ligand | Receptor | LRpair | Pathway | Tissue | Disease Stage |
| Page: 1 |
Top |
Single-cell gene regulatory network inference analysis |
| Find out the significant the regulons (TFs) and the target genes of each regulon across cell types for different disease states |
| TF | Cell Type | Tissue | Disease Stage | Target Gene | RSS | Regulon Activity |
| ∗The dot plots of a searched regulon are shown for all cell subpopulations in each disease state of each tissue based on the regulon specific score inferred using pySCENIC and by calculating the average expression. |
| Page: 1 |
Top |
Somatic mutation of malignant transformation related genes |
| Annotation of somatic variants for genes involved in malignant transformation |
| Hugo Symbol | Variant Class | Variant Classification | dbSNP RS | HGVSc | HGVSp | HGVSp Short | SWISSPROT | BIOTYPE | SIFT | PolyPhen | Tumor Sample Barcode | Tissue | Histology | Sex | Age | Stage | Therapy Types | Drugs | Outcome |
| FAM20C | SNV | Missense_Mutation | c.1594G>C | p.Asp532His | p.D532H | Q8IXL6 | protein_coding | deleterious(0) | probably_damaging(0.992) | TCGA-A2-A0CV-01 | Breast | breast invasive carcinoma | Female | <65 | I/II | Chemotherapy | cytoxan | SD | |
| FAM20C | SNV | Missense_Mutation | c.1479N>G | p.Ile493Met | p.I493M | Q8IXL6 | protein_coding | deleterious(0) | probably_damaging(0.983) | TCGA-C8-A275-01 | Breast | breast invasive carcinoma | Female | <65 | I/II | Unknown | Unknown | SD | |
| FAM20C | SNV | Missense_Mutation | novel | c.1171N>C | p.Phe391Leu | p.F391L | Q8IXL6 | protein_coding | tolerated(0.21) | benign(0.166) | TCGA-LL-A6FQ-01 | Breast | breast invasive carcinoma | Female | >=65 | III/IV | Unknown | Unknown | SD |
| FAM20C | SNV | Missense_Mutation | rs775983050 | c.1118C>T | p.Thr373Met | p.T373M | Q8IXL6 | protein_coding | deleterious(0.03) | probably_damaging(0.999) | TCGA-5M-AAT4-01 | Colorectum | colon adenocarcinoma | Male | >=65 | III/IV | Unknown | Unknown | PD |
| FAM20C | SNV | Missense_Mutation | c.715T>C | p.Tyr239His | p.Y239H | Q8IXL6 | protein_coding | deleterious(0) | probably_damaging(0.999) | TCGA-CM-5861-01 | Colorectum | colon adenocarcinoma | Female | <65 | I/II | Unknown | Unknown | PD | |
| FAM20C | SNV | Missense_Mutation | novel | c.989C>T | p.Ala330Val | p.A330V | Q8IXL6 | protein_coding | tolerated(0.62) | benign(0.068) | TCGA-A5-A0G1-01 | Endometrium | uterine corpus endometrioid carcinoma | Female | >=65 | I/II | Unknown | Unknown | SD |
| FAM20C | SNV | Missense_Mutation | novel | c.1531C>A | p.Leu511Met | p.L511M | Q8IXL6 | protein_coding | deleterious(0) | probably_damaging(0.999) | TCGA-A5-A1OF-01 | Endometrium | uterine corpus endometrioid carcinoma | Female | <65 | I/II | Unknown | Unknown | SD |
| FAM20C | SNV | Missense_Mutation | novel | c.794N>T | p.Ser265Leu | p.S265L | Q8IXL6 | protein_coding | tolerated(0.11) | benign(0.308) | TCGA-AJ-A3EL-01 | Endometrium | uterine corpus endometrioid carcinoma | Female | <65 | I/II | Unknown | Unknown | SD |
| FAM20C | SNV | Missense_Mutation | novel | c.1528N>T | p.Arg510Cys | p.R510C | Q8IXL6 | protein_coding | deleterious(0.01) | probably_damaging(0.999) | TCGA-AJ-A3OJ-01 | Endometrium | uterine corpus endometrioid carcinoma | Female | <65 | I/II | Chemotherapy | carboplatin | CR |
| FAM20C | SNV | Missense_Mutation | novel | c.92N>A | p.Pro31His | p.P31H | Q8IXL6 | protein_coding | deleterious_low_confidence(0) | possibly_damaging(0.879) | TCGA-AP-A1DK-01 | Endometrium | uterine corpus endometrioid carcinoma | Female | <65 | I/II | Unknown | Unknown | SD |
| Page: 1 2 3 |
Top |
Related drugs of malignant transformation related genes |
| Identification of chemicals and drugs interact with genes involved in malignant transfromation |
| (DGIdb 4.0) |
| Entrez ID | Symbol | Category | Interaction Types | Drug Claim Name | Drug Name | PMIDs |
| Page: 1 |

Copyright 2023-Present -The University of Texas Health Science Center at Houston |