
|
|||||
|
 | |
| |
| |
| |
| |
| |
|
Gene: FAM20A |
Gene summary for FAM20A |
| Gene information | Species | Human | Gene symbol | FAM20A | Gene ID | 54757 |
| Gene name | FAM20A golgi associated secretory pathway pseudokinase | |
| Gene Alias | AI1G | |
| Cytomap | 17q24.2 | |
| Gene Type | protein-coding | GO ID | GO:0001932 | UniProtAcc | B7Z4Y3 |
Top |
Malignant transformation analysis |
| Identification of the aberrant gene expression in precancerous and cancerous lesions by comparing the gene expression of stem-like cells in diseased tissues with normal stem cells |
| Entrez ID | Symbol | Replicates | Species | Organ | Tissue | Adj P-value | Log2FC | Malignancy |
| 54757 | FAM20A | RNA-P10T2-P10T2-4 | Human | Lung | AAH | 4.25e-03 | 7.57e-01 | -0.138 |
| 54757 | FAM20A | RNA-P25T1-P25T1-1 | Human | Lung | AIS | 5.52e-11 | 5.61e-01 | -0.2116 |
| 54757 | FAM20A | RNA-P25T1-P25T1-3 | Human | Lung | AIS | 2.84e-04 | 5.87e-01 | -0.2107 |
| 54757 | FAM20A | RNA-P25T1-P25T1-4 | Human | Lung | AIS | 1.64e-09 | 4.78e-01 | -0.2119 |
| 54757 | FAM20A | RNA-P3T-P3T-4 | Human | Lung | IAC | 1.09e-02 | 2.31e-01 | 0.1859 |
| 54757 | FAM20A | RNA-P6T2-P6T2-1 | Human | Lung | IAC | 4.64e-09 | 4.09e-01 | -0.0166 |
| 54757 | FAM20A | RNA-P6T2-P6T2-2 | Human | Lung | IAC | 8.22e-13 | 4.46e-01 | -0.0132 |
| 54757 | FAM20A | RNA-P6T2-P6T2-3 | Human | Lung | IAC | 2.31e-11 | 4.74e-01 | -0.013 |
| 54757 | FAM20A | RNA-P6T2-P6T2-4 | Human | Lung | IAC | 1.26e-10 | 4.62e-01 | -0.0121 |
| 54757 | FAM20A | RNA-P7T1-P7T1-1 | Human | Lung | AIS | 1.14e-04 | 5.45e-01 | -0.0961 |
| 54757 | FAM20A | RNA-P7T1-P7T1-2 | Human | Lung | AIS | 1.71e-10 | 6.87e-01 | -0.0876 |
| 54757 | FAM20A | RNA-P7T1-P7T1-3 | Human | Lung | AIS | 1.24e-04 | 6.50e-01 | -0.0822 |
| 54757 | FAM20A | RNA-P7T1-P7T1-4 | Human | Lung | AIS | 3.51e-05 | 4.89e-01 | -0.0809 |
| 54757 | FAM20A | male-WTA | Human | Thyroid | PTC | 7.30e-12 | 2.54e-01 | 0.1037 |
| 54757 | FAM20A | female-WTA | Human | Thyroid | PTC | 8.84e-09 | 5.19e-01 | 0.0726 |
| 54757 | FAM20A | PTC01 | Human | Thyroid | PTC | 6.92e-24 | 7.31e-01 | 0.1899 |
| 54757 | FAM20A | PTC04 | Human | Thyroid | PTC | 6.92e-24 | 6.12e-01 | 0.1927 |
| 54757 | FAM20A | PTC05 | Human | Thyroid | PTC | 3.34e-30 | 1.07e+00 | 0.2065 |
| 54757 | FAM20A | PTC06 | Human | Thyroid | PTC | 2.10e-38 | 1.11e+00 | 0.2057 |
| 54757 | FAM20A | PTC07 | Human | Thyroid | PTC | 6.59e-21 | 4.77e-01 | 0.2044 |
| Page: 1 2 |
| Tissue | Expression Dynamics | Abbreviation |
| Lung |  | AAH: Atypical adenomatous hyperplasia |
| AIS: Adenocarcinoma in situ | ||
| IAC: Invasive lung adenocarcinoma | ||
| MIA: Minimally invasive adenocarcinoma | ||
| Thyroid | 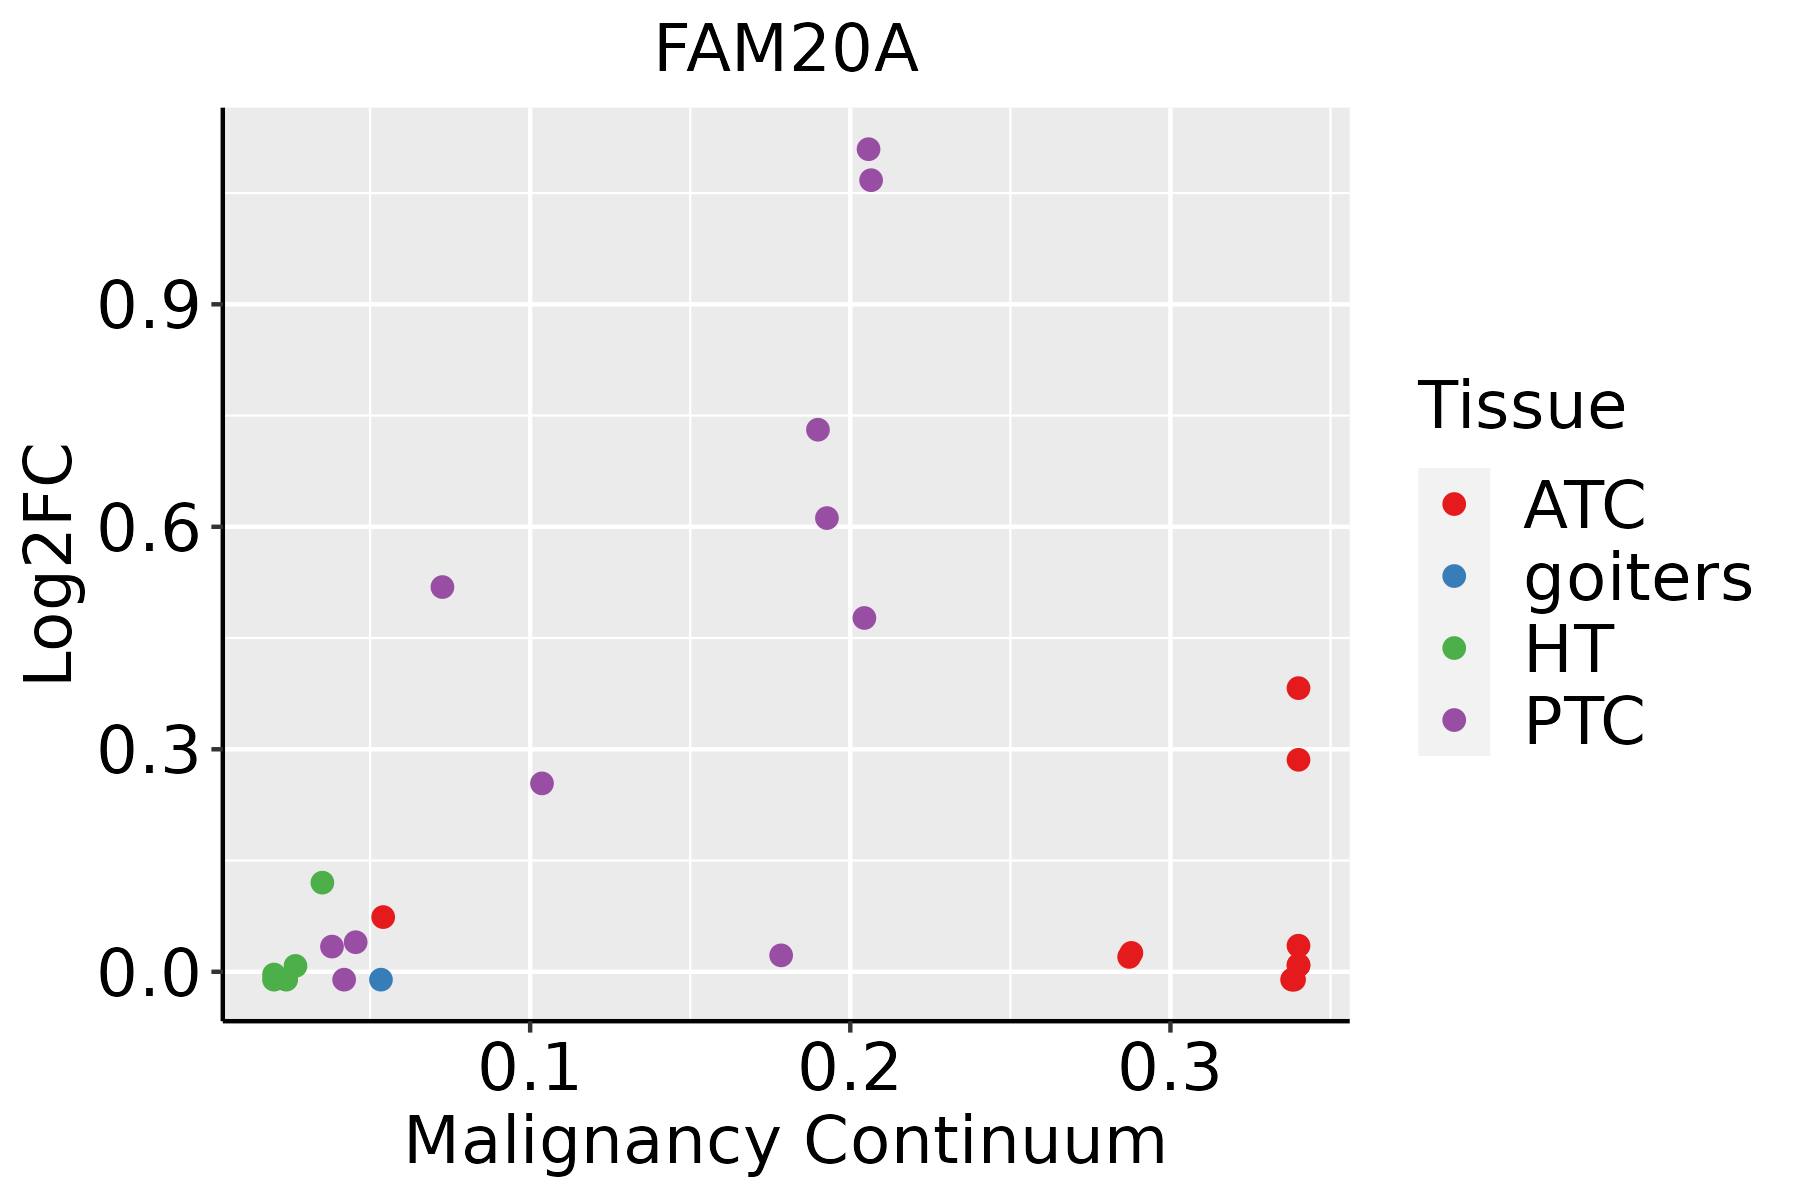 | ATC: Anaplastic thyroid cancer |
| HT: Hashimoto's thyroiditis | ||
| PTC: Papillary thyroid cancer |
| ∗log2FC in expression of this searched gene in stem-like cells from each diseased tissue sample relative to stem-like cells in normal samples in each tissue plotted against the malignancy continuum. Samples are colored based on if they are from different disease stage. |
Top |
Malignant transformation related pathway analysis |
| Find out the enriched GO biological processes and KEGG pathways involved in transition from healthy to precancer to cancer |
| Tissue | Disease Stage | Enriched GO biological Processes |
| Colorectum | AD |  |
| Colorectum | SER |  |
| Colorectum | MSS |  |
| Colorectum | MSI-H |  |
| Colorectum | FAP |  |
| ∗Top 15 enriched GO BP terms are showed in the bar plot of each disease state in each tissue. Each row represents a significant GO biological process which is colored according to the -log10(p.adjust). |
| Page: 1 2 3 4 5 6 7 8 9 |
| GO ID | Tissue | Disease Stage | Description | Gene Ratio | Bg Ratio | pvalue | p.adjust | Count |
| GO:00719006 | Lung | IAC | regulation of protein serine/threonine kinase activity | 71/2061 | 359/18723 | 6.33e-07 | 3.72e-05 | 71 |
| GO:00458607 | Lung | IAC | positive regulation of protein kinase activity | 72/2061 | 386/18723 | 4.89e-06 | 1.96e-04 | 72 |
| GO:00719024 | Lung | IAC | positive regulation of protein serine/threonine kinase activity | 44/2061 | 200/18723 | 5.16e-06 | 2.04e-04 | 44 |
| GO:00336748 | Lung | IAC | positive regulation of kinase activity | 83/2061 | 467/18723 | 6.76e-06 | 2.45e-04 | 83 |
| GO:003367412 | Lung | AIS | positive regulation of kinase activity | 77/1849 | 467/18723 | 4.67e-06 | 2.31e-04 | 77 |
| GO:004586012 | Lung | AIS | positive regulation of protein kinase activity | 65/1849 | 386/18723 | 1.27e-05 | 4.78e-04 | 65 |
| GO:007190012 | Lung | AIS | regulation of protein serine/threonine kinase activity | 61/1849 | 359/18723 | 1.76e-05 | 6.17e-04 | 61 |
| GO:007190211 | Lung | AIS | positive regulation of protein serine/threonine kinase activity | 38/1849 | 200/18723 | 6.00e-05 | 1.65e-03 | 38 |
| GO:003367421 | Lung | AAH | positive regulation of kinase activity | 28/613 | 467/18723 | 1.63e-03 | 3.96e-02 | 28 |
| GO:0045860111 | Thyroid | PTC | positive regulation of protein kinase activity | 176/5968 | 386/18723 | 8.89e-09 | 2.17e-07 | 176 |
| GO:0071900110 | Thyroid | PTC | regulation of protein serine/threonine kinase activity | 164/5968 | 359/18723 | 2.41e-08 | 5.43e-07 | 164 |
| GO:0033674111 | Thyroid | PTC | positive regulation of kinase activity | 201/5968 | 467/18723 | 1.95e-07 | 3.54e-06 | 201 |
| GO:007190210 | Thyroid | PTC | positive regulation of protein serine/threonine kinase activity | 93/5968 | 200/18723 | 1.01e-05 | 1.12e-04 | 93 |
| GO:007190025 | Thyroid | ATC | regulation of protein serine/threonine kinase activity | 176/6293 | 359/18723 | 8.35e-10 | 2.17e-08 | 176 |
| GO:004586026 | Thyroid | ATC | positive regulation of protein kinase activity | 185/6293 | 386/18723 | 3.00e-09 | 7.02e-08 | 185 |
| GO:003367427 | Thyroid | ATC | positive regulation of kinase activity | 212/6293 | 467/18723 | 5.89e-08 | 1.05e-06 | 212 |
| GO:007190215 | Thyroid | ATC | positive regulation of protein serine/threonine kinase activity | 96/6293 | 200/18723 | 1.63e-05 | 1.51e-04 | 96 |
| Page: 1 |
| Pathway ID | Tissue | Disease Stage | Description | Gene Ratio | Bg Ratio | pvalue | p.adjust | qvalue | Count |
| Page: 1 |
Top |
Cell-cell communication analysis |
| Identification of potential cell-cell interactions between two cell types and their ligand-receptor pairs for different disease states |
| Ligand | Receptor | LRpair | Pathway | Tissue | Disease Stage |
| Page: 1 |
Top |
Single-cell gene regulatory network inference analysis |
| Find out the significant the regulons (TFs) and the target genes of each regulon across cell types for different disease states |
| TF | Cell Type | Tissue | Disease Stage | Target Gene | RSS | Regulon Activity |
| ∗The dot plots of a searched regulon are shown for all cell subpopulations in each disease state of each tissue based on the regulon specific score inferred using pySCENIC and by calculating the average expression. |
| Page: 1 |
Top |
Somatic mutation of malignant transformation related genes |
| Annotation of somatic variants for genes involved in malignant transformation |
| Hugo Symbol | Variant Class | Variant Classification | dbSNP RS | HGVSc | HGVSp | HGVSp Short | SWISSPROT | BIOTYPE | SIFT | PolyPhen | Tumor Sample Barcode | Tissue | Histology | Sex | Age | Stage | Therapy Types | Drugs | Outcome |
| FAM20A | SNV | Missense_Mutation | rs147371993 | c.827N>A | p.Arg276Gln | p.R276Q | Q96MK3 | protein_coding | deleterious(0) | probably_damaging(0.994) | TCGA-A2-A0SW-01 | Breast | breast invasive carcinoma | Female | >=65 | III/IV | Hormone Therapy | arimidex | PD |
| FAM20A | SNV | Missense_Mutation | c.1449N>C | p.Glu483Asp | p.E483D | Q96MK3 | protein_coding | tolerated(0.24) | benign(0.007) | TCGA-AN-A0AM-01 | Breast | breast invasive carcinoma | Female | <65 | I/II | Unknown | Unknown | SD | |
| FAM20A | SNV | Missense_Mutation | c.906N>C | p.Gln302His | p.Q302H | Q96MK3 | protein_coding | tolerated(0.37) | possibly_damaging(0.862) | TCGA-C8-A1HM-01 | Breast | breast invasive carcinoma | Female | >=65 | I/II | Chemotherapy | doxorubicin | CR | |
| FAM20A | SNV | Missense_Mutation | c.915C>G | p.Phe305Leu | p.F305L | Q96MK3 | protein_coding | deleterious(0) | probably_damaging(0.978) | TCGA-C8-A275-01 | Breast | breast invasive carcinoma | Female | <65 | I/II | Unknown | Unknown | SD | |
| FAM20A | deletion | Frame_Shift_Del | novel | c.1595delC | p.Pro532GlnfsTer8 | p.P532Qfs*8 | Q96MK3 | protein_coding | TCGA-EW-A2FV-01 | Breast | breast invasive carcinoma | Female | <65 | III/IV | Chemotherapy | docetaxel | SD | ||
| FAM20A | deletion | Frame_Shift_Del | c.1449delA | p.Asp484ThrfsTer23 | p.D484Tfs*23 | Q96MK3 | protein_coding | TCGA-EW-A2FV-01 | Breast | breast invasive carcinoma | Female | <65 | III/IV | Chemotherapy | docetaxel | SD | |||
| FAM20A | SNV | Missense_Mutation | c.422N>C | p.Arg141Thr | p.R141T | Q96MK3 | protein_coding | tolerated(0.48) | benign(0.026) | TCGA-Q1-A73O-01 | Cervix | cervical & endocervical cancer | Female | <65 | I/II | Chemotherapy | cisplatin | CR | |
| FAM20A | SNV | Missense_Mutation | novel | c.905N>G | p.Gln302Arg | p.Q302R | Q96MK3 | protein_coding | tolerated(0.86) | benign(0.023) | TCGA-VS-A9UB-01 | Cervix | cervical & endocervical cancer | Female | <65 | I/II | Chemotherapy | cisplatin | CR |
| FAM20A | SNV | Missense_Mutation | c.948N>A | p.Phe316Leu | p.F316L | Q96MK3 | protein_coding | deleterious(0) | probably_damaging(0.996) | TCGA-AA-3837-01 | Colorectum | colon adenocarcinoma | Male | >=65 | I/II | Unknown | Unknown | SD | |
| FAM20A | SNV | Missense_Mutation | c.753C>A | p.Phe251Leu | p.F251L | Q96MK3 | protein_coding | tolerated(0.19) | benign(0.112) | TCGA-AA-A010-01 | Colorectum | colon adenocarcinoma | Female | <65 | I/II | Chemotherapy | folinic | CR |
| Page: 1 2 3 4 5 |
Top |
Related drugs of malignant transformation related genes |
| Identification of chemicals and drugs interact with genes involved in malignant transfromation |
| (DGIdb 4.0) |
| Entrez ID | Symbol | Category | Interaction Types | Drug Claim Name | Drug Name | PMIDs |
| Page: 1 |

Copyright 2023-Present -The University of Texas Health Science Center at Houston |