
|
|||||
|
 | |
| |
| |
| |
| |
| |
|
Gene: FAM208A |
Gene summary for FAM208A |
| Gene information | Species | Human | Gene symbol | FAM208A | Gene ID | 23272 |
| Gene name | transcription activation suppressor | |
| Gene Alias | C3orf63 | |
| Cytomap | 3p14.3 | |
| Gene Type | protein-coding | GO ID | GO:0000578 | UniProtAcc | Q9UK61 |
Top |
Malignant transformation analysis |
| Identification of the aberrant gene expression in precancerous and cancerous lesions by comparing the gene expression of stem-like cells in diseased tissues with normal stem cells |
| Entrez ID | Symbol | Replicates | Species | Organ | Tissue | Adj P-value | Log2FC | Malignancy |
| 23272 | FAM208A | P1T-E | Human | Esophagus | ESCC | 1.05e-05 | 1.29e-01 | 0.0875 |
| 23272 | FAM208A | P2T-E | Human | Esophagus | ESCC | 9.57e-33 | 5.79e-01 | 0.1177 |
| 23272 | FAM208A | P4T-E | Human | Esophagus | ESCC | 3.48e-16 | 3.68e-01 | 0.1323 |
| 23272 | FAM208A | P5T-E | Human | Esophagus | ESCC | 3.52e-05 | 9.40e-02 | 0.1327 |
| 23272 | FAM208A | P8T-E | Human | Esophagus | ESCC | 2.87e-14 | 1.57e-01 | 0.0889 |
| 23272 | FAM208A | P9T-E | Human | Esophagus | ESCC | 4.63e-16 | 1.34e-01 | 0.1131 |
| 23272 | FAM208A | P10T-E | Human | Esophagus | ESCC | 1.36e-17 | 3.15e-01 | 0.116 |
| 23272 | FAM208A | P11T-E | Human | Esophagus | ESCC | 4.47e-06 | 2.47e-01 | 0.1426 |
| 23272 | FAM208A | P12T-E | Human | Esophagus | ESCC | 2.40e-22 | 3.49e-01 | 0.1122 |
| 23272 | FAM208A | P15T-E | Human | Esophagus | ESCC | 7.46e-09 | 2.66e-01 | 0.1149 |
| 23272 | FAM208A | P16T-E | Human | Esophagus | ESCC | 4.00e-13 | 2.44e-01 | 0.1153 |
| 23272 | FAM208A | P17T-E | Human | Esophagus | ESCC | 2.44e-09 | 3.81e-01 | 0.1278 |
| 23272 | FAM208A | P20T-E | Human | Esophagus | ESCC | 7.75e-18 | 2.89e-01 | 0.1124 |
| 23272 | FAM208A | P21T-E | Human | Esophagus | ESCC | 8.03e-26 | 5.06e-01 | 0.1617 |
| 23272 | FAM208A | P22T-E | Human | Esophagus | ESCC | 9.81e-18 | 3.53e-01 | 0.1236 |
| 23272 | FAM208A | P23T-E | Human | Esophagus | ESCC | 2.92e-16 | 4.34e-01 | 0.108 |
| 23272 | FAM208A | P24T-E | Human | Esophagus | ESCC | 1.23e-18 | 2.98e-01 | 0.1287 |
| 23272 | FAM208A | P26T-E | Human | Esophagus | ESCC | 1.18e-18 | 3.99e-01 | 0.1276 |
| 23272 | FAM208A | P27T-E | Human | Esophagus | ESCC | 2.32e-14 | 2.88e-01 | 0.1055 |
| 23272 | FAM208A | P28T-E | Human | Esophagus | ESCC | 3.71e-11 | 1.93e-01 | 0.1149 |
| Page: 1 2 3 4 5 6 7 |
| Tissue | Expression Dynamics | Abbreviation |
| Esophagus | 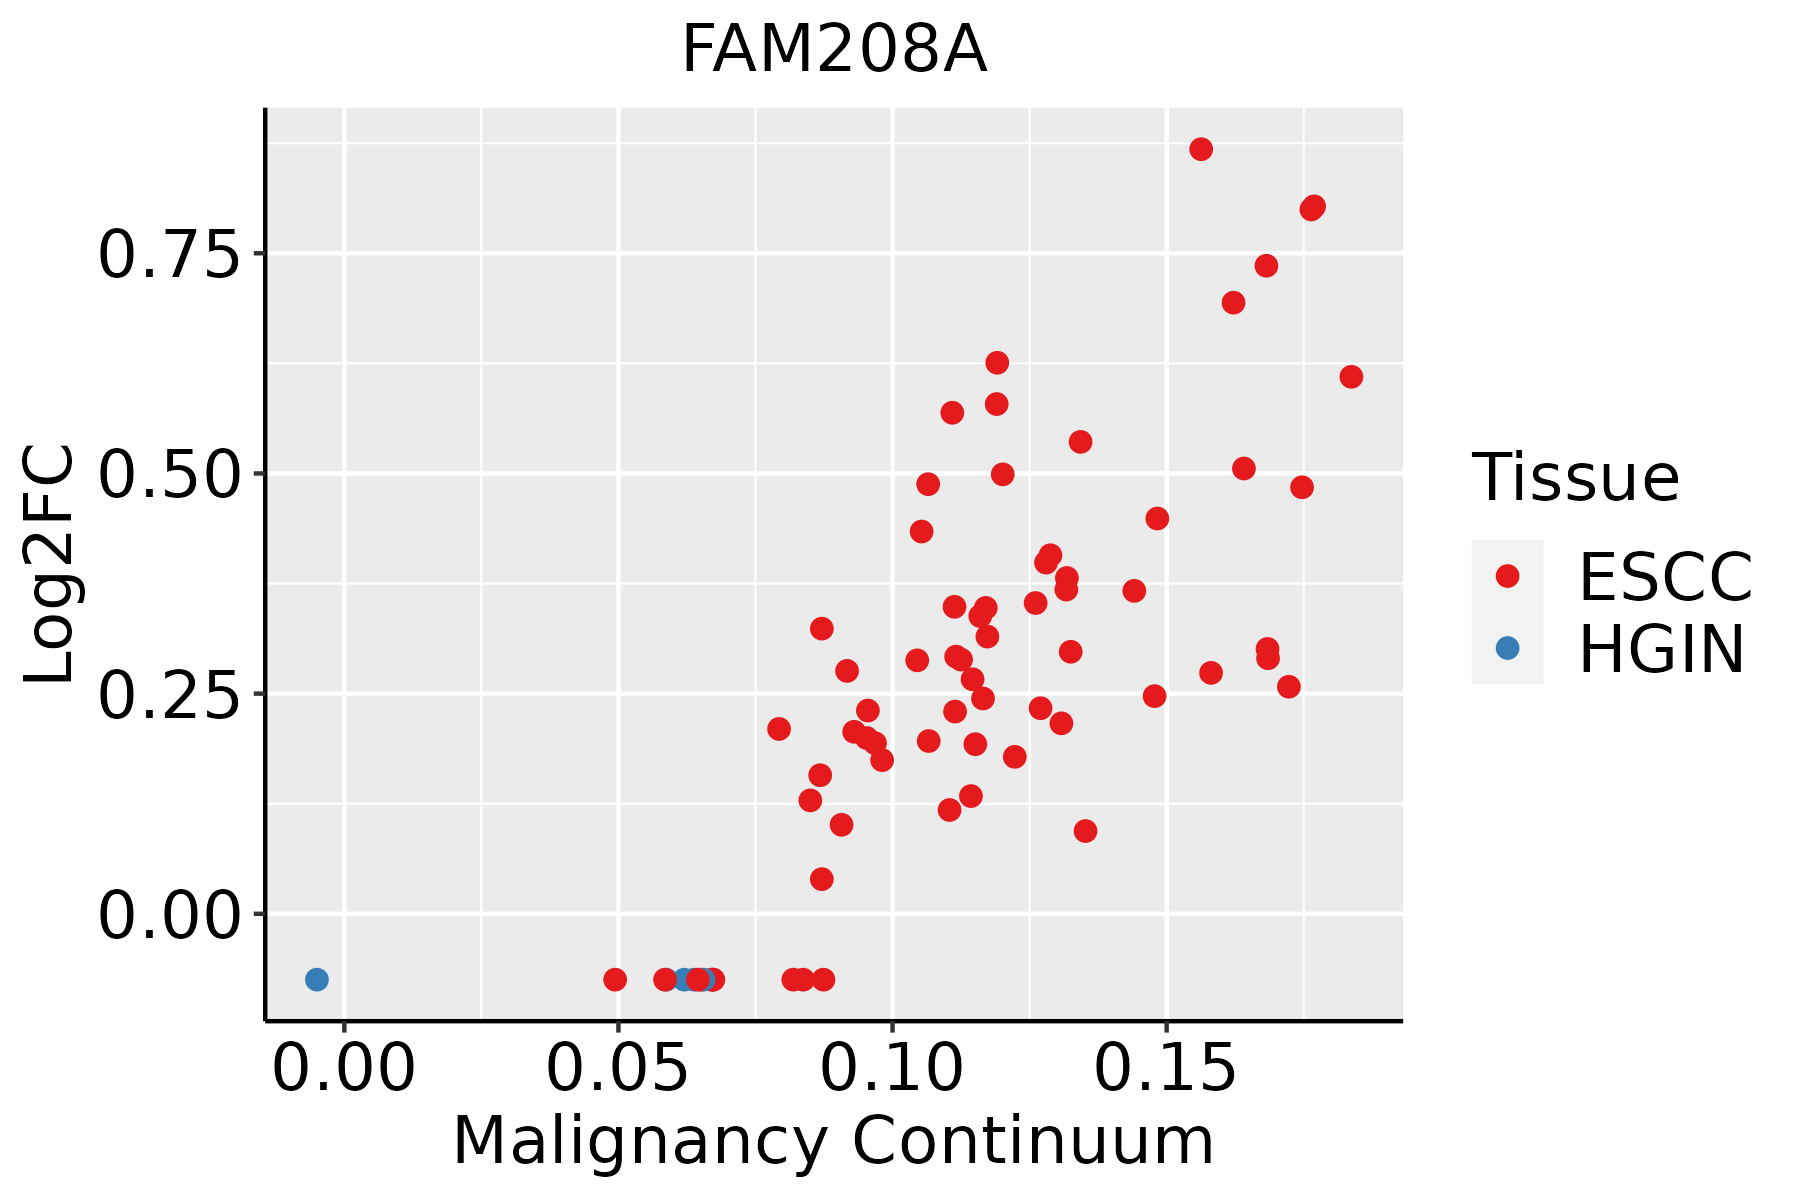 | ESCC: Esophageal squamous cell carcinoma |
| HGIN: High-grade intraepithelial neoplasias | ||
| LGIN: Low-grade intraepithelial neoplasias | ||
| Liver |  | HCC: Hepatocellular carcinoma |
| NAFLD: Non-alcoholic fatty liver disease | ||
| Oral Cavity | 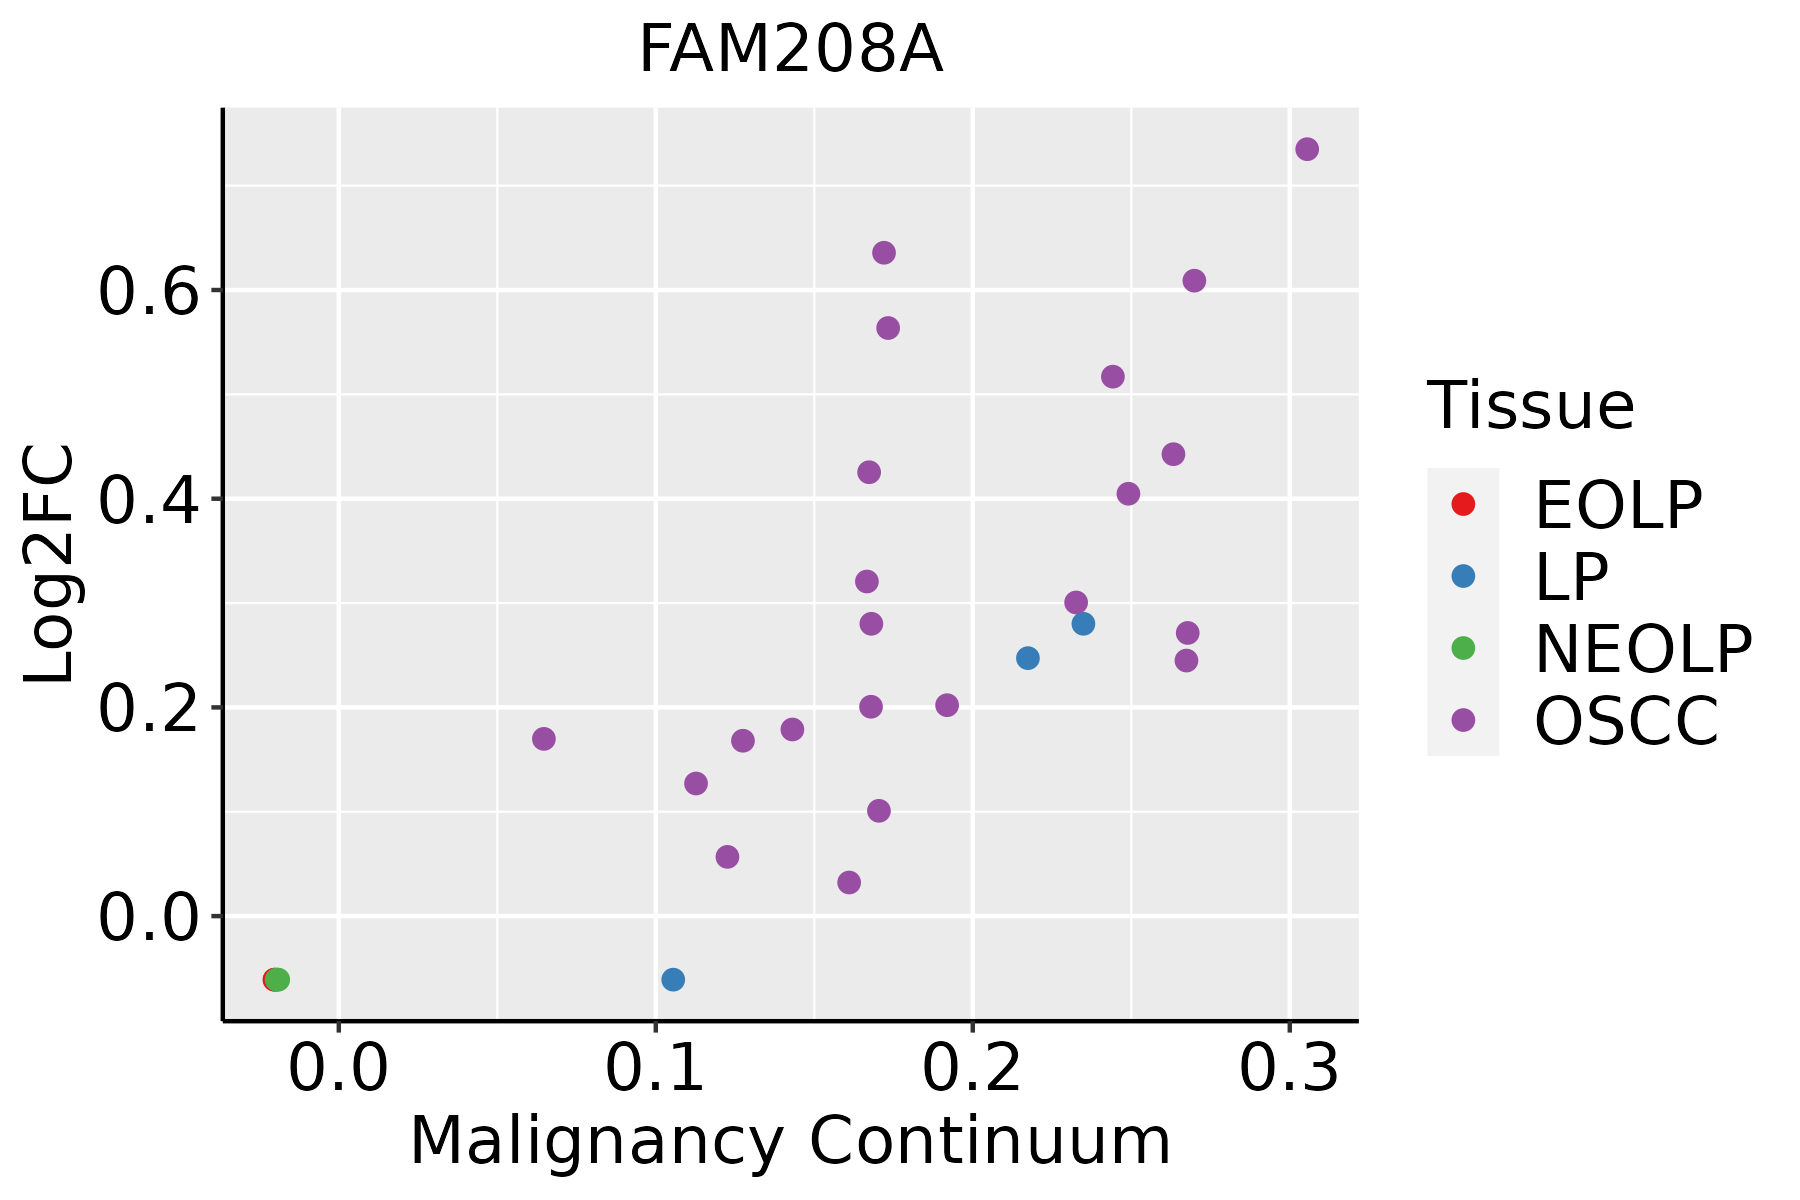 | EOLP: Erosive Oral lichen planus |
| LP: leukoplakia | ||
| NEOLP: Non-erosive oral lichen planus | ||
| OSCC: Oral squamous cell carcinoma | ||
| Prostate | 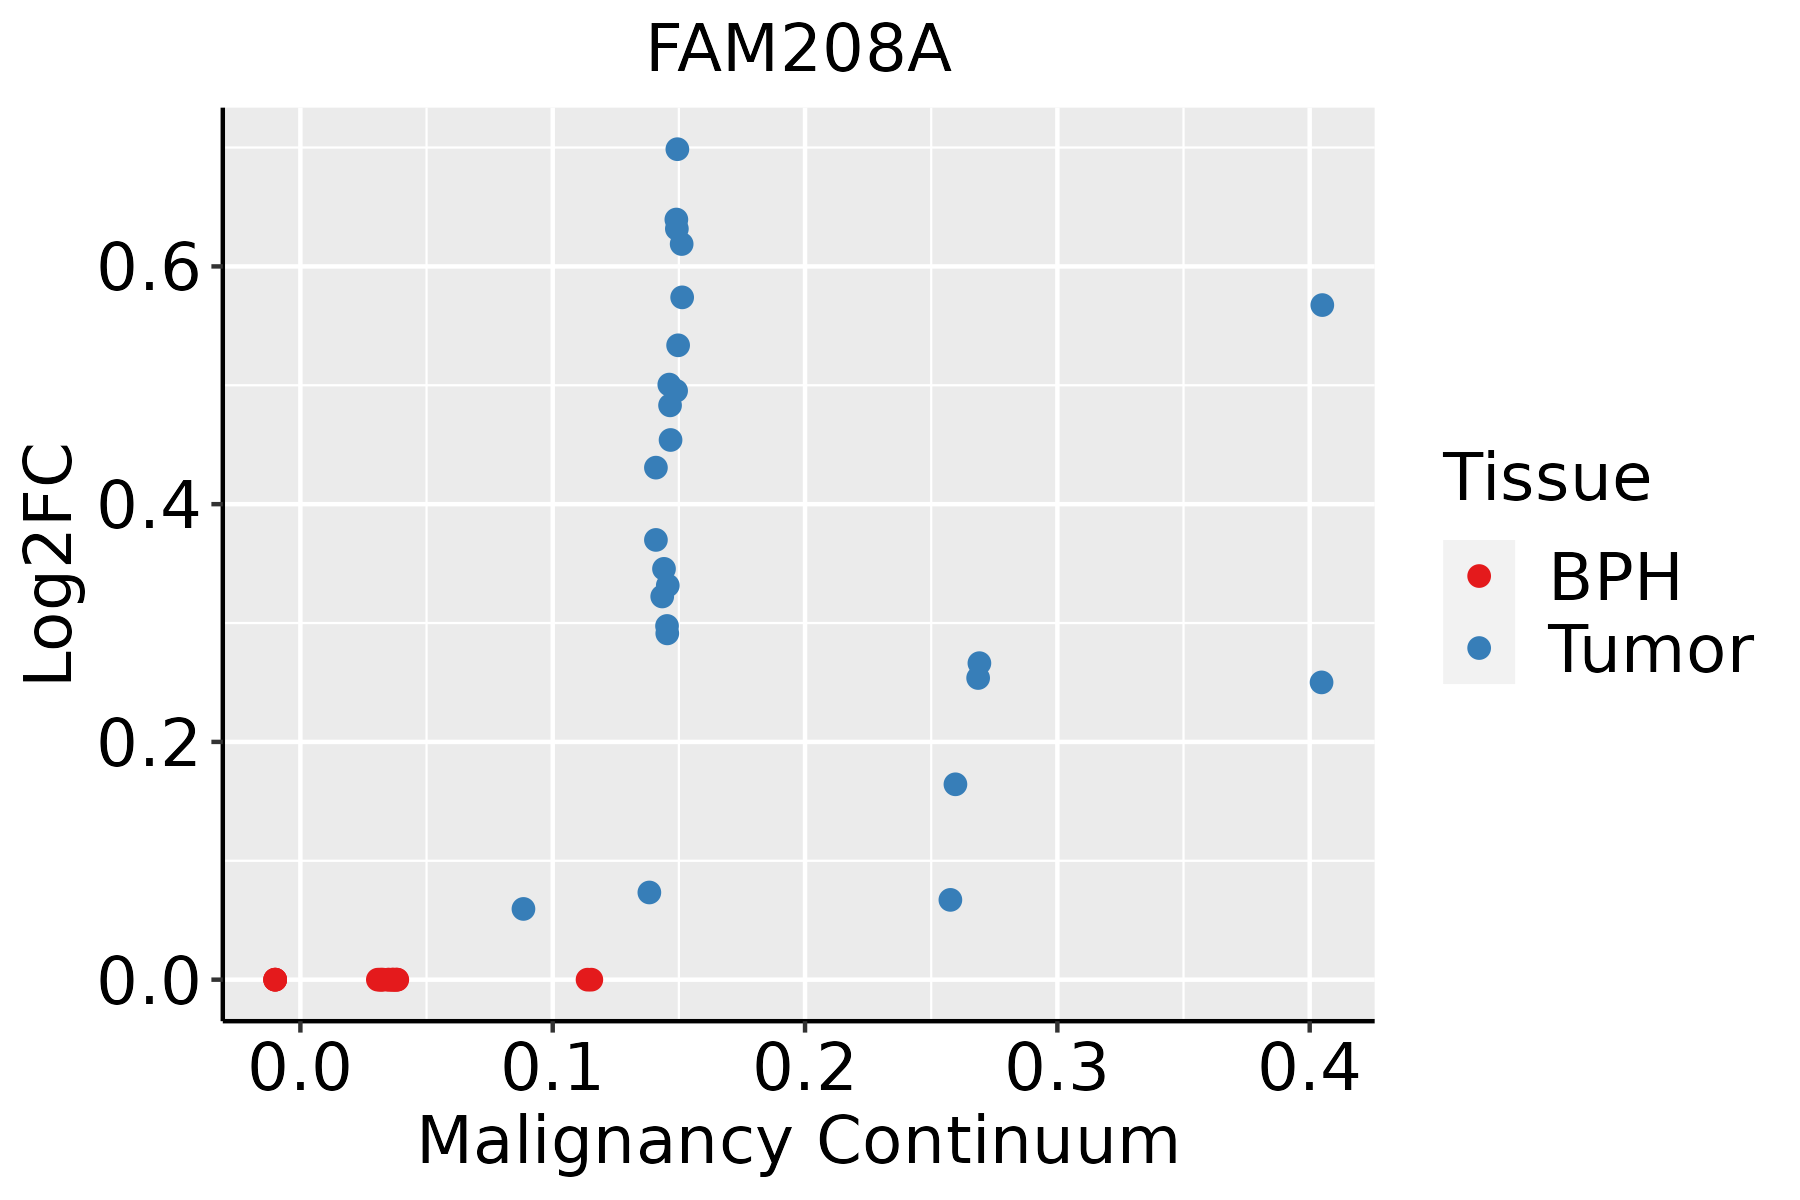 | BPH: Benign Prostatic Hyperplasia |
| Skin | 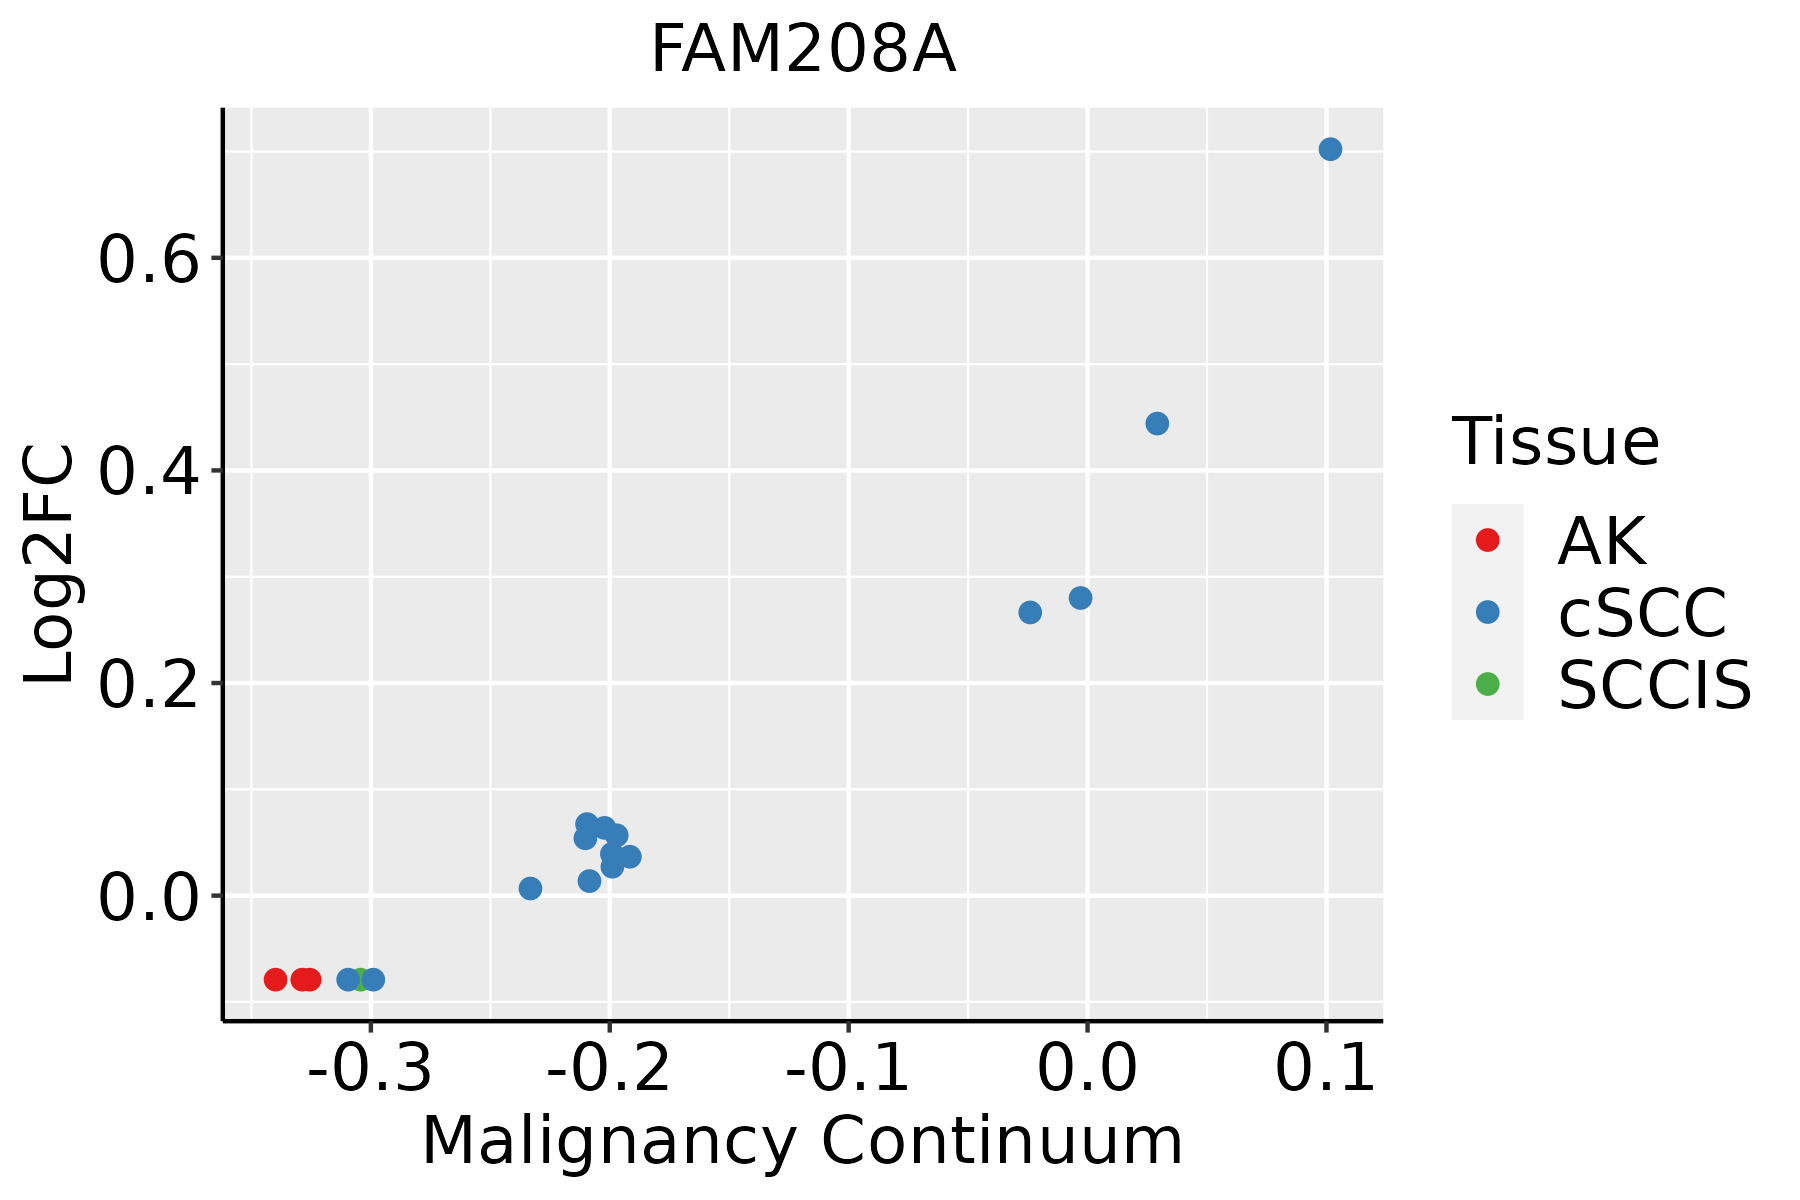 | AK: Actinic keratosis |
| cSCC: Cutaneous squamous cell carcinoma | ||
| SCCIS:squamous cell carcinoma in situ | ||
| Thyroid | 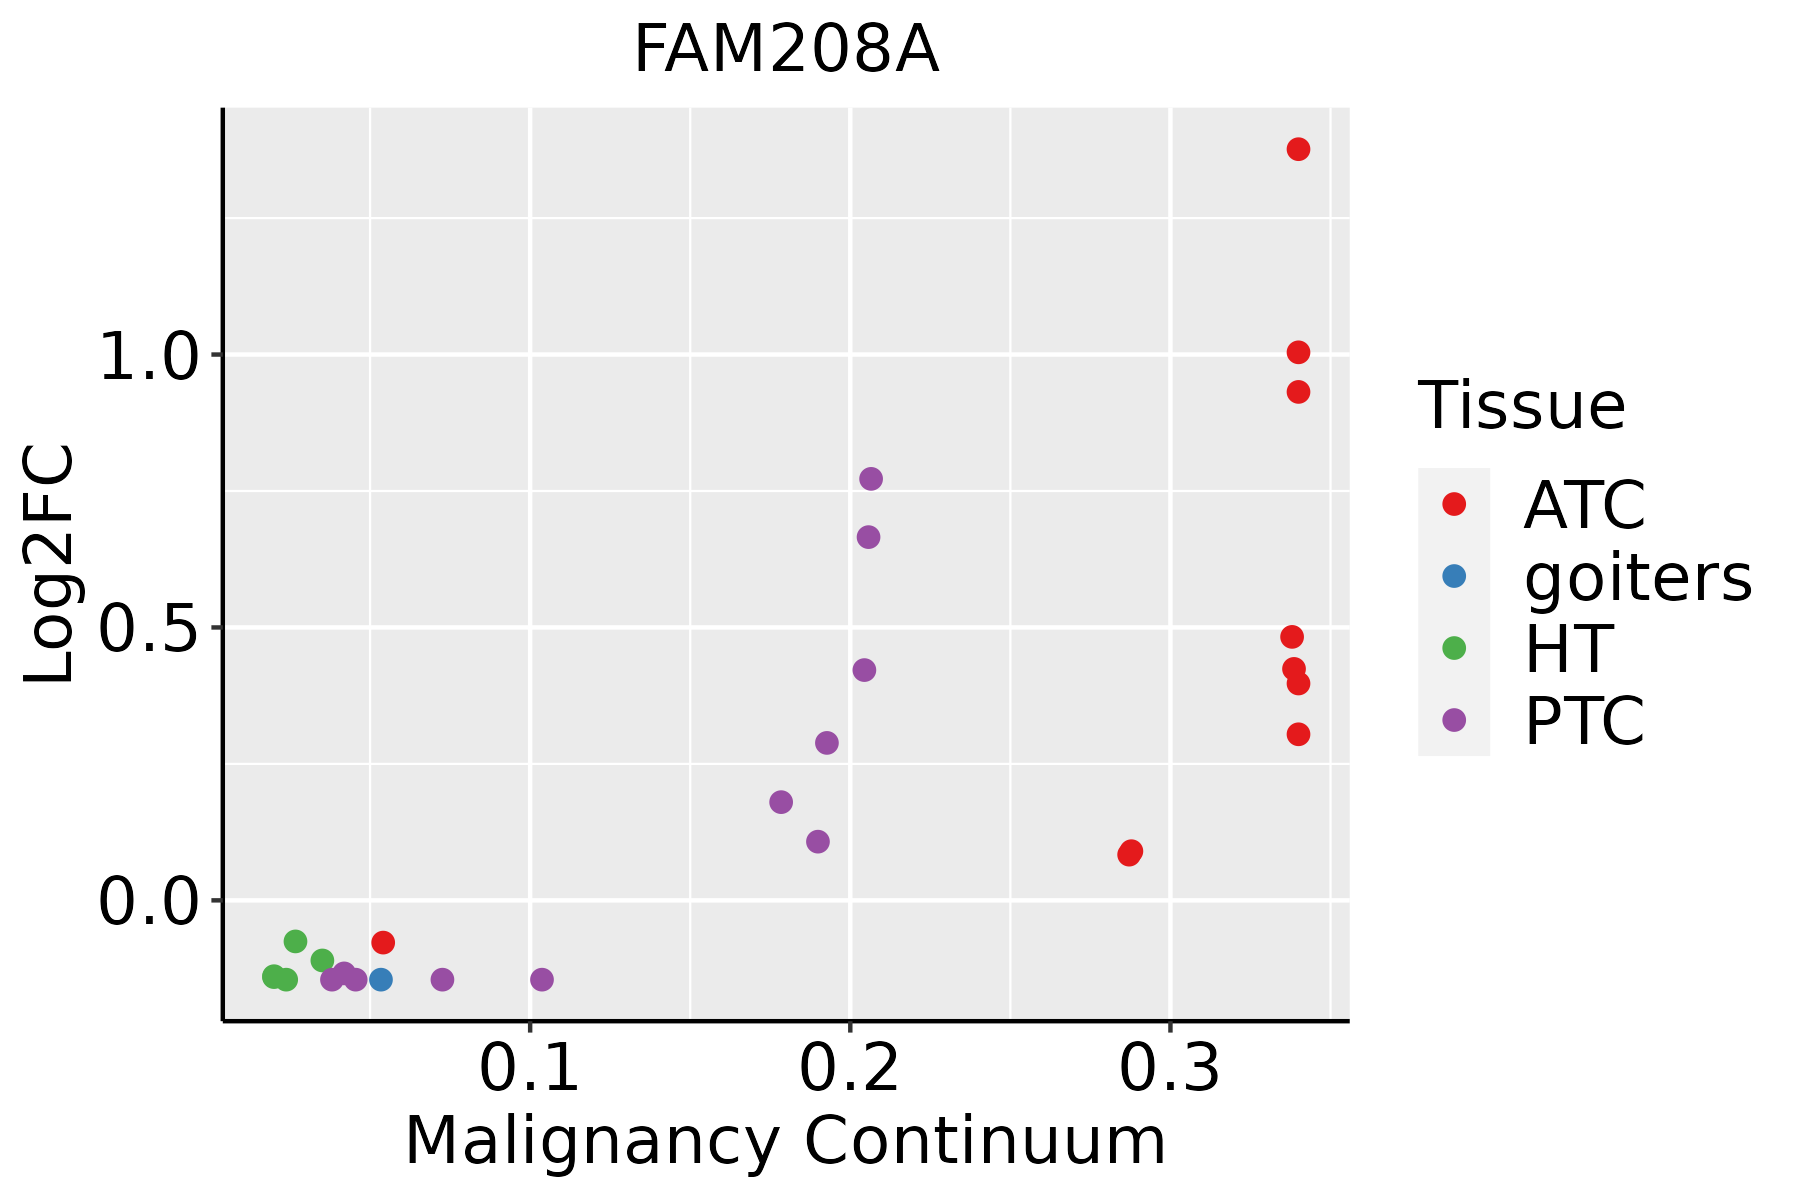 | ATC: Anaplastic thyroid cancer |
| HT: Hashimoto's thyroiditis | ||
| PTC: Papillary thyroid cancer |
| ∗log2FC in expression of this searched gene in stem-like cells from each diseased tissue sample relative to stem-like cells in normal samples in each tissue plotted against the malignancy continuum. Samples are colored based on if they are from different disease stage. |
Top |
Malignant transformation related pathway analysis |
| Find out the enriched GO biological processes and KEGG pathways involved in transition from healthy to precancer to cancer |
| Tissue | Disease Stage | Enriched GO biological Processes |
| Colorectum | AD |  |
| Colorectum | SER |  |
| Colorectum | MSS |  |
| Colorectum | MSI-H |  |
| Colorectum | FAP |  |
| ∗Top 15 enriched GO BP terms are showed in the bar plot of each disease state in each tissue. Each row represents a significant GO biological process which is colored according to the -log10(p.adjust). |
| Page: 1 2 3 4 5 6 7 8 9 |
| GO ID | Tissue | Disease Stage | Description | Gene Ratio | Bg Ratio | pvalue | p.adjust | Count |
| Page: 1 |
| Pathway ID | Tissue | Disease Stage | Description | Gene Ratio | Bg Ratio | pvalue | p.adjust | qvalue | Count |
| Page: 1 |
Top |
Cell-cell communication analysis |
| Identification of potential cell-cell interactions between two cell types and their ligand-receptor pairs for different disease states |
| Ligand | Receptor | LRpair | Pathway | Tissue | Disease Stage |
| Page: 1 |
Top |
Single-cell gene regulatory network inference analysis |
| Find out the significant the regulons (TFs) and the target genes of each regulon across cell types for different disease states |
| TF | Cell Type | Tissue | Disease Stage | Target Gene | RSS | Regulon Activity |
| ∗The dot plots of a searched regulon are shown for all cell subpopulations in each disease state of each tissue based on the regulon specific score inferred using pySCENIC and by calculating the average expression. |
| Page: 1 |
Top |
Somatic mutation of malignant transformation related genes |
| Annotation of somatic variants for genes involved in malignant transformation |
| Hugo Symbol | Variant Class | Variant Classification | dbSNP RS | HGVSc | HGVSp | HGVSp Short | SWISSPROT | BIOTYPE | SIFT | PolyPhen | Tumor Sample Barcode | Tissue | Histology | Sex | Age | Stage | Therapy Types | Drugs | Outcome |
| FAM208A | SNV | Missense_Mutation | novel | c.998N>T | p.Thr333Ile | p.T333I | Q9UK61 | protein_coding | tolerated(0.31) | benign(0.031) | TCGA-A1-A0SN-01 | Breast | breast invasive carcinoma | Female | <65 | I/II | Chemotherapy | ac | SD |
| FAM208A | SNV | Missense_Mutation | novel | c.907N>A | p.Tyr303Asn | p.Y303N | Q9UK61 | protein_coding | deleterious(0) | probably_damaging(0.999) | TCGA-A2-A0EN-01 | Breast | breast invasive carcinoma | Female | >=65 | I/II | Hormone Therapy | tamoxiphen | SD |
| FAM208A | SNV | Missense_Mutation | rs200064504 | c.3226N>A | p.Glu1076Lys | p.E1076K | Q9UK61 | protein_coding | tolerated(0.09) | possibly_damaging(0.846) | TCGA-A8-A06Q-01 | Breast | breast invasive carcinoma | Female | <65 | III/IV | Unknown | Unknown | SD |
| FAM208A | SNV | Missense_Mutation | rs773222959 | c.338N>C | p.Phe113Ser | p.F113S | Q9UK61 | protein_coding | deleterious(0) | probably_damaging(0.948) | TCGA-A8-A09V-01 | Breast | breast invasive carcinoma | Female | <65 | I/II | Hormone Therapy | tamoxiphen | SD |
| FAM208A | SNV | Missense_Mutation | rs765321754 | c.3195N>G | p.Ile1065Met | p.I1065M | Q9UK61 | protein_coding | tolerated(0.07) | benign(0.099) | TCGA-A8-A0A2-01 | Breast | breast invasive carcinoma | Female | >=65 | I/II | Hormone Therapy | tamoxiphen | SD |
| FAM208A | SNV | Missense_Mutation | rs762464476 | c.3371N>T | p.Ser1124Phe | p.S1124F | Q9UK61 | protein_coding | deleterious(0.02) | probably_damaging(0.953) | TCGA-AC-A23H-01 | Breast | breast invasive carcinoma | Female | >=65 | I/II | Unknown | Unknown | PD |
| FAM208A | SNV | Missense_Mutation | novel | c.3699N>C | p.Lys1233Asn | p.K1233N | Q9UK61 | protein_coding | deleterious(0) | probably_damaging(0.993) | TCGA-AN-A046-01 | Breast | breast invasive carcinoma | Female | >=65 | I/II | Unknown | Unknown | SD |
| FAM208A | SNV | Missense_Mutation | rs773222959 | c.338N>C | p.Phe113Ser | p.F113S | Q9UK61 | protein_coding | deleterious(0) | probably_damaging(0.948) | TCGA-AN-A0XR-01 | Breast | breast invasive carcinoma | Female | <65 | III/IV | Unknown | Unknown | SD |
| FAM208A | SNV | Missense_Mutation | c.3403N>A | p.Glu1135Lys | p.E1135K | Q9UK61 | protein_coding | tolerated(0.08) | probably_damaging(0.919) | TCGA-BH-A0HA-01 | Breast | breast invasive carcinoma | Female | <65 | I/II | Unknown | Unknown | SD | |
| FAM208A | SNV | Missense_Mutation | rs773222959 | c.338T>C | p.Phe113Ser | p.F113S | Q9UK61 | protein_coding | deleterious(0) | probably_damaging(0.948) | TCGA-BH-A0W3-01 | Breast | breast invasive carcinoma | Female | <65 | I/II | Unknown | Unknown | SD |
| Page: 1 2 3 4 5 6 7 8 9 10 11 12 13 |
Top |
Related drugs of malignant transformation related genes |
| Identification of chemicals and drugs interact with genes involved in malignant transfromation |
| (DGIdb 4.0) |
| Entrez ID | Symbol | Category | Interaction Types | Drug Claim Name | Drug Name | PMIDs |
| Page: 1 |

Copyright 2023-Present -The University of Texas Health Science Center at Houston |