
|
|||||
|
 | |
| |
| |
| |
| |
| |
|
Gene: FAM200A |
Gene summary for FAM200A |
| Gene information | Species | Human | Gene symbol | FAM200A | Gene ID | 221786 |
| Gene name | family with sequence similarity 200 member A | |
| Gene Alias | C7orf38 | |
| Cytomap | 7q22.1 | |
| Gene Type | protein-coding | GO ID | GO:0005575 | UniProtAcc | Q8TCP9 |
Top |
Malignant transformation analysis |
| Identification of the aberrant gene expression in precancerous and cancerous lesions by comparing the gene expression of stem-like cells in diseased tissues with normal stem cells |
| Entrez ID | Symbol | Replicates | Species | Organ | Tissue | Adj P-value | Log2FC | Malignancy |
| 221786 | FAM200A | LZE24T | Human | Esophagus | ESCC | 7.44e-04 | 2.12e-01 | 0.0596 |
| 221786 | FAM200A | P1T-E | Human | Esophagus | ESCC | 3.95e-04 | 1.90e-01 | 0.0875 |
| 221786 | FAM200A | P2T-E | Human | Esophagus | ESCC | 1.30e-15 | 3.10e-01 | 0.1177 |
| 221786 | FAM200A | P4T-E | Human | Esophagus | ESCC | 1.17e-12 | 3.14e-01 | 0.1323 |
| 221786 | FAM200A | P5T-E | Human | Esophagus | ESCC | 7.10e-07 | 7.97e-02 | 0.1327 |
| 221786 | FAM200A | P8T-E | Human | Esophagus | ESCC | 4.64e-04 | 1.26e-01 | 0.0889 |
| 221786 | FAM200A | P9T-E | Human | Esophagus | ESCC | 1.99e-05 | 1.01e-01 | 0.1131 |
| 221786 | FAM200A | P10T-E | Human | Esophagus | ESCC | 1.53e-19 | 4.43e-01 | 0.116 |
| 221786 | FAM200A | P11T-E | Human | Esophagus | ESCC | 8.57e-07 | 2.66e-01 | 0.1426 |
| 221786 | FAM200A | P12T-E | Human | Esophagus | ESCC | 2.20e-17 | 3.61e-01 | 0.1122 |
| 221786 | FAM200A | P15T-E | Human | Esophagus | ESCC | 7.64e-13 | 2.76e-01 | 0.1149 |
| 221786 | FAM200A | P16T-E | Human | Esophagus | ESCC | 5.17e-27 | 4.75e-01 | 0.1153 |
| 221786 | FAM200A | P17T-E | Human | Esophagus | ESCC | 1.07e-04 | 2.40e-01 | 0.1278 |
| 221786 | FAM200A | P20T-E | Human | Esophagus | ESCC | 4.42e-19 | 4.60e-01 | 0.1124 |
| 221786 | FAM200A | P22T-E | Human | Esophagus | ESCC | 9.74e-24 | 2.12e-01 | 0.1236 |
| 221786 | FAM200A | P23T-E | Human | Esophagus | ESCC | 1.29e-05 | 2.35e-01 | 0.108 |
| 221786 | FAM200A | P24T-E | Human | Esophagus | ESCC | 4.08e-07 | 6.11e-02 | 0.1287 |
| 221786 | FAM200A | P26T-E | Human | Esophagus | ESCC | 1.76e-12 | 2.20e-01 | 0.1276 |
| 221786 | FAM200A | P27T-E | Human | Esophagus | ESCC | 1.11e-14 | 2.12e-01 | 0.1055 |
| 221786 | FAM200A | P28T-E | Human | Esophagus | ESCC | 7.05e-10 | 1.57e-01 | 0.1149 |
| Page: 1 2 3 |
| Tissue | Expression Dynamics | Abbreviation |
| Esophagus | 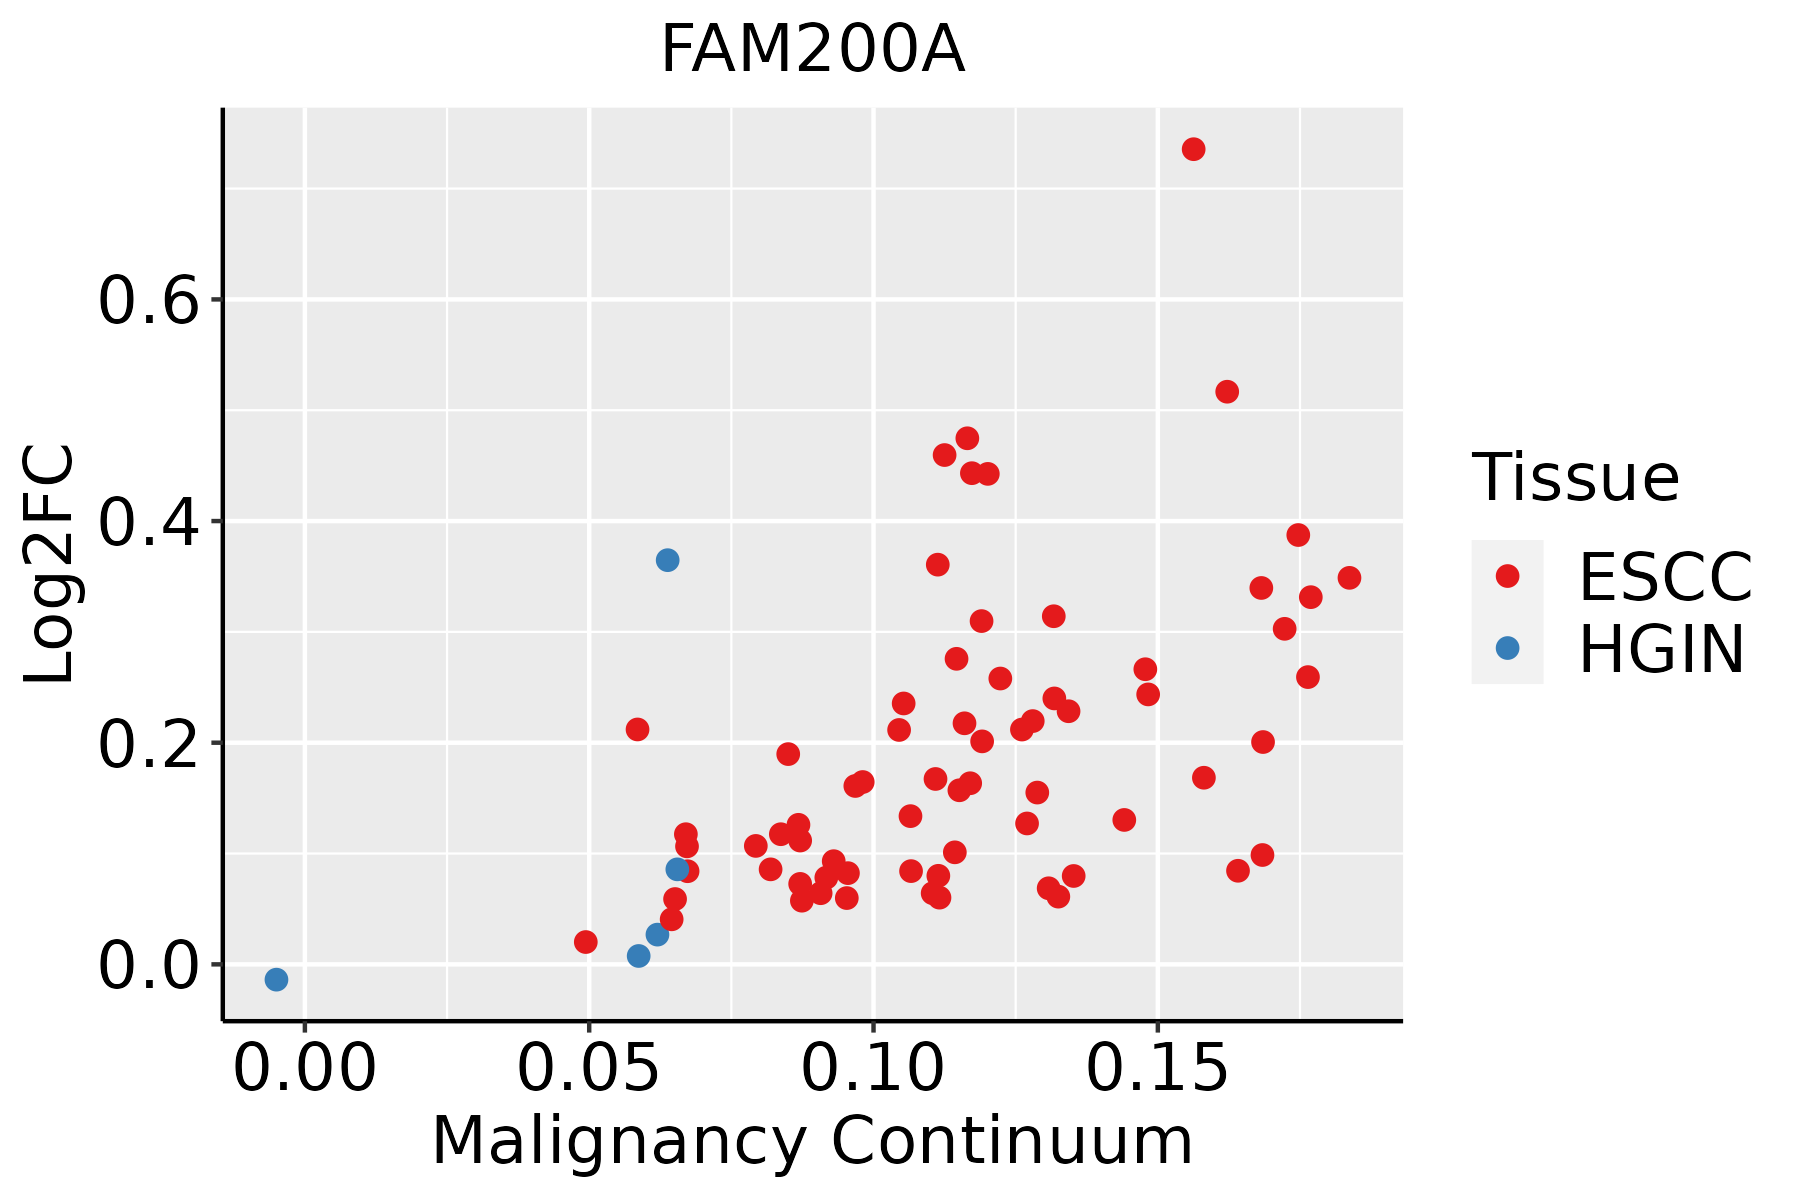 | ESCC: Esophageal squamous cell carcinoma |
| HGIN: High-grade intraepithelial neoplasias | ||
| LGIN: Low-grade intraepithelial neoplasias | ||
| Thyroid | 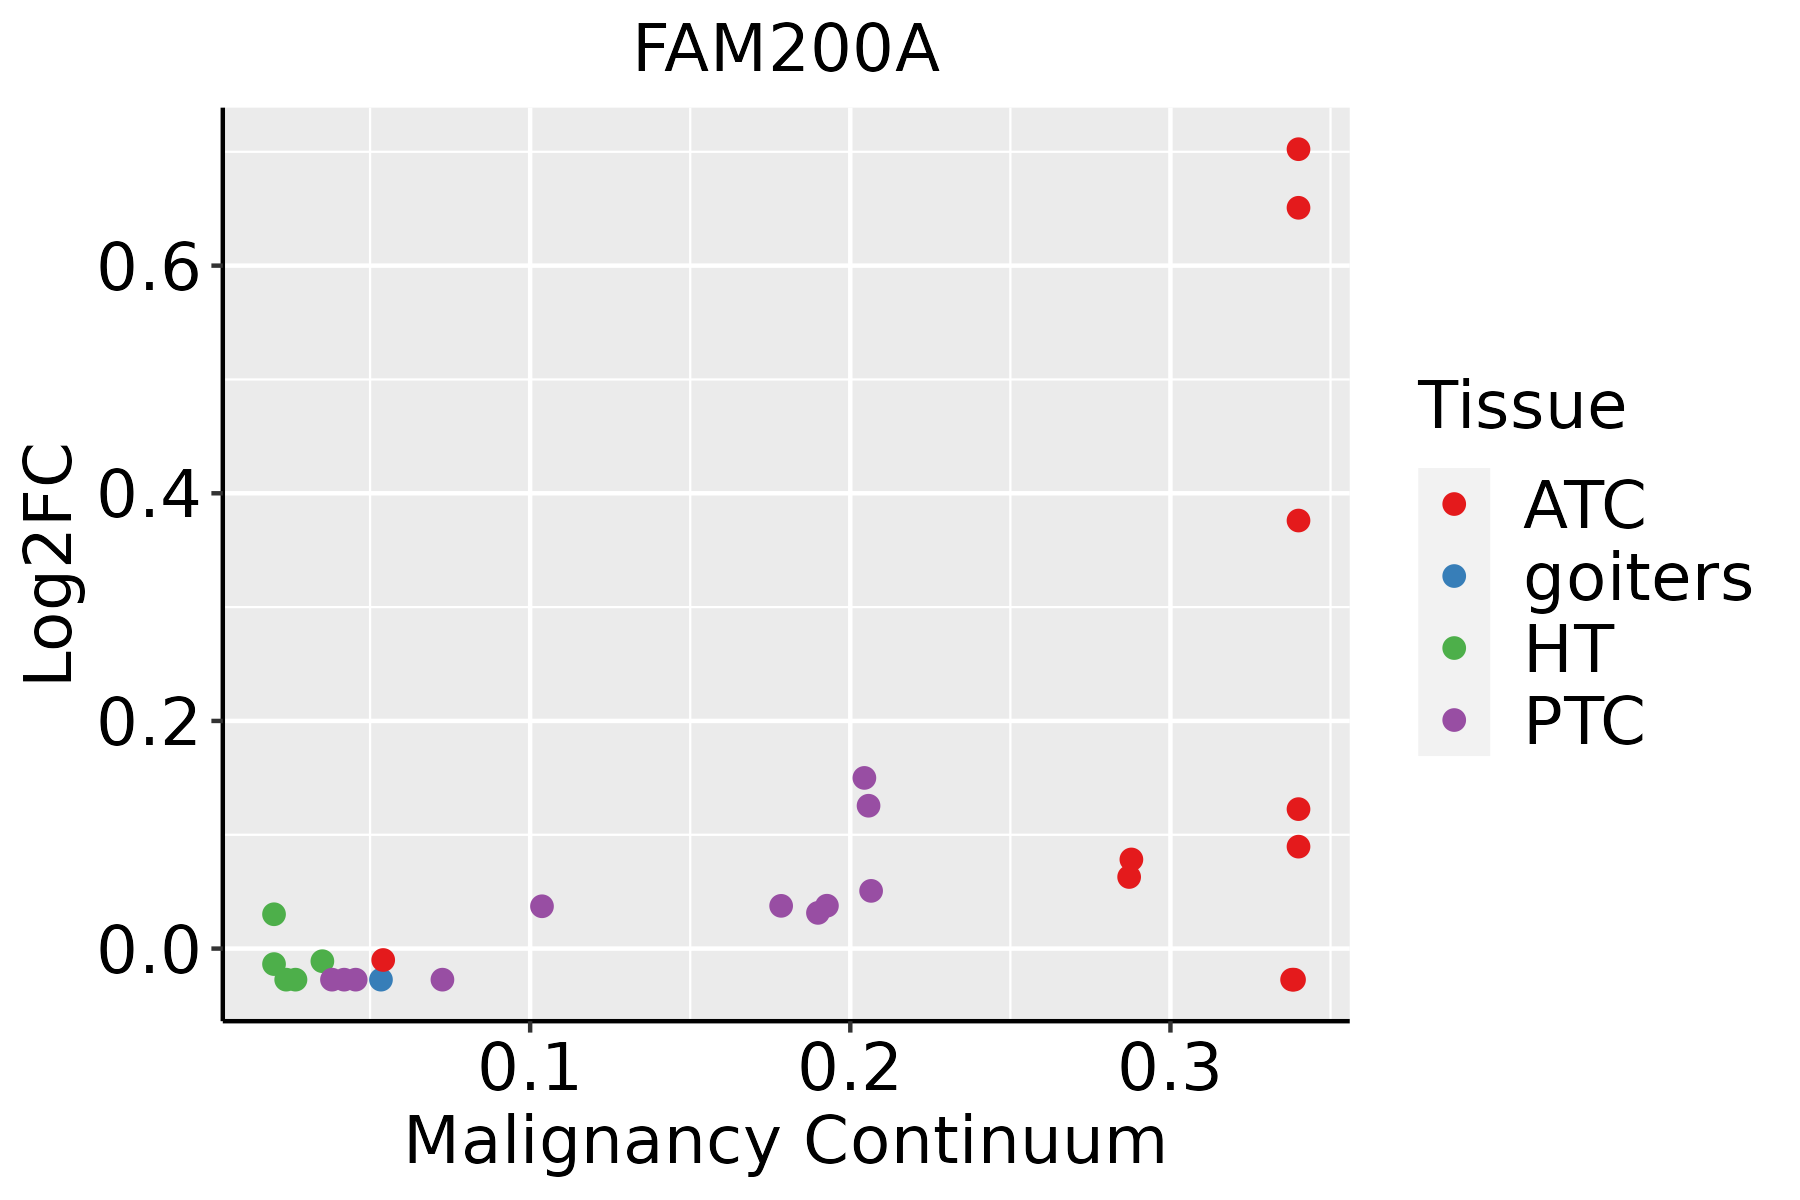 | ATC: Anaplastic thyroid cancer |
| HT: Hashimoto's thyroiditis | ||
| PTC: Papillary thyroid cancer |
| ∗log2FC in expression of this searched gene in stem-like cells from each diseased tissue sample relative to stem-like cells in normal samples in each tissue plotted against the malignancy continuum. Samples are colored based on if they are from different disease stage. |
Top |
Malignant transformation related pathway analysis |
| Find out the enriched GO biological processes and KEGG pathways involved in transition from healthy to precancer to cancer |
| Tissue | Disease Stage | Enriched GO biological Processes |
| Colorectum | AD |  |
| Colorectum | SER |  |
| Colorectum | MSS |  |
| Colorectum | MSI-H |  |
| Colorectum | FAP |  |
| ∗Top 15 enriched GO BP terms are showed in the bar plot of each disease state in each tissue. Each row represents a significant GO biological process which is colored according to the -log10(p.adjust). |
| Page: 1 2 3 4 5 6 7 8 9 |
| GO ID | Tissue | Disease Stage | Description | Gene Ratio | Bg Ratio | pvalue | p.adjust | Count |
| Page: 1 |
| Pathway ID | Tissue | Disease Stage | Description | Gene Ratio | Bg Ratio | pvalue | p.adjust | qvalue | Count |
| Page: 1 |
Top |
Cell-cell communication analysis |
| Identification of potential cell-cell interactions between two cell types and their ligand-receptor pairs for different disease states |
| Ligand | Receptor | LRpair | Pathway | Tissue | Disease Stage |
| Page: 1 |
Top |
Single-cell gene regulatory network inference analysis |
| Find out the significant the regulons (TFs) and the target genes of each regulon across cell types for different disease states |
| TF | Cell Type | Tissue | Disease Stage | Target Gene | RSS | Regulon Activity |
| ∗The dot plots of a searched regulon are shown for all cell subpopulations in each disease state of each tissue based on the regulon specific score inferred using pySCENIC and by calculating the average expression. |
| Page: 1 |
Top |
Somatic mutation of malignant transformation related genes |
| Annotation of somatic variants for genes involved in malignant transformation |
| Hugo Symbol | Variant Class | Variant Classification | dbSNP RS | HGVSc | HGVSp | HGVSp Short | SWISSPROT | BIOTYPE | SIFT | PolyPhen | Tumor Sample Barcode | Tissue | Histology | Sex | Age | Stage | Therapy Types | Drugs | Outcome |
| FAM200A | SNV | Missense_Mutation | c.655N>A | p.Gly219Arg | p.G219R | Q8TCP9 | protein_coding | deleterious(0) | probably_damaging(0.998) | TCGA-A2-A04Y-01 | Breast | breast invasive carcinoma | Female | <65 | I/II | Chemotherapy | cytoxan | SD | |
| FAM200A | SNV | Missense_Mutation | novel | c.759N>G | p.Ile253Met | p.I253M | Q8TCP9 | protein_coding | tolerated(0.51) | benign(0.082) | TCGA-AC-A8OP-01 | Breast | breast invasive carcinoma | Female | >=65 | I/II | Unknown | Unknown | SD |
| FAM200A | SNV | Missense_Mutation | c.1224N>C | p.Glu408Asp | p.E408D | Q8TCP9 | protein_coding | tolerated(0.16) | benign(0.04) | TCGA-D8-A27G-01 | Breast | breast invasive carcinoma | Female | >=65 | I/II | Unknown | Unknown | SD | |
| FAM200A | SNV | Missense_Mutation | novel | c.539C>T | p.Ser180Leu | p.S180L | Q8TCP9 | protein_coding | deleterious(0.02) | benign(0.115) | TCGA-C5-A2LZ-01 | Cervix | cervical & endocervical cancer | Female | >=65 | III/IV | Unknown | Unknown | PD |
| FAM200A | SNV | Missense_Mutation | novel | c.935N>A | p.Arg312Lys | p.R312K | Q8TCP9 | protein_coding | tolerated(0.06) | probably_damaging(0.95) | TCGA-VS-A9U6-01 | Cervix | cervical & endocervical cancer | Female | <65 | I/II | Chemotherapy | cisplatin | PD |
| FAM200A | SNV | Missense_Mutation | novel | c.1599G>C | p.Leu533Phe | p.L533F | Q8TCP9 | protein_coding | tolerated(0.13) | probably_damaging(0.921) | TCGA-ZJ-A8QR-01 | Cervix | cervical & endocervical cancer | Female | <65 | I/II | Unknown | Unknown | SD |
| FAM200A | SNV | Missense_Mutation | rs751434417 | c.191N>T | p.Ser64Leu | p.S64L | Q8TCP9 | protein_coding | deleterious(0) | probably_damaging(0.995) | TCGA-A6-6141-01 | Colorectum | colon adenocarcinoma | Male | <65 | I/II | Chemotherapy | 5-fu | SD |
| FAM200A | SNV | Missense_Mutation | c.889N>C | p.Phe297Leu | p.F297L | Q8TCP9 | protein_coding | tolerated(0.69) | benign(0.011) | TCGA-AA-3811-01 | Colorectum | colon adenocarcinoma | Female | >=65 | III/IV | Unknown | Unknown | PD | |
| FAM200A | SNV | Missense_Mutation | novel | c.628N>G | p.Ser210Ala | p.S210A | Q8TCP9 | protein_coding | tolerated(0.06) | benign(0.017) | TCGA-AZ-4315-01 | Colorectum | colon adenocarcinoma | Male | <65 | I/II | Unknown | Unknown | SD |
| FAM200A | SNV | Missense_Mutation | rs780218510 | c.1316C>T | p.Pro439Leu | p.P439L | Q8TCP9 | protein_coding | deleterious(0) | benign(0.425) | TCGA-AZ-6601-01 | Colorectum | colon adenocarcinoma | Male | >=65 | I/II | Unknown | Unknown | PD |
| Page: 1 2 3 4 5 |
Top |
Related drugs of malignant transformation related genes |
| Identification of chemicals and drugs interact with genes involved in malignant transfromation |
| (DGIdb 4.0) |
| Entrez ID | Symbol | Category | Interaction Types | Drug Claim Name | Drug Name | PMIDs |
| Page: 1 |

Copyright 2023-Present -The University of Texas Health Science Center at Houston |