
|
|||||
|
 | |
| |
| |
| |
| |
| |
|
Gene: FAM198B |
Gene summary for FAM198B |
| Gene information | Species | Human | Gene symbol | FAM198B | Gene ID | 51313 |
| Gene name | golgi associated kinase 1B | |
| Gene Alias | AD021 | |
| Cytomap | 4q32.1 | |
| Gene Type | protein-coding | GO ID | GO:0000139 | UniProtAcc | Q6UWH4 |
Top |
Malignant transformation analysis |
| Identification of the aberrant gene expression in precancerous and cancerous lesions by comparing the gene expression of stem-like cells in diseased tissues with normal stem cells |
| Entrez ID | Symbol | Replicates | Species | Organ | Tissue | Adj P-value | Log2FC | Malignancy |
| 51313 | FAM198B | GSM4909298 | Human | Breast | IDC | 5.80e-22 | 4.09e-01 | 0.1551 |
| 51313 | FAM198B | GSM4909304 | Human | Breast | IDC | 5.74e-24 | 5.25e-01 | 0.1636 |
| 51313 | FAM198B | M5 | Human | Breast | IDC | 6.26e-07 | 6.83e-01 | 0.1598 |
| 51313 | FAM198B | P4T-E | Human | Esophagus | ESCC | 1.43e-04 | 2.60e-01 | 0.1323 |
| 51313 | FAM198B | P5T-E | Human | Esophagus | ESCC | 1.94e-02 | 1.62e-01 | 0.1327 |
| 51313 | FAM198B | P8T-E | Human | Esophagus | ESCC | 3.24e-11 | 3.47e-01 | 0.0889 |
| 51313 | FAM198B | P9T-E | Human | Esophagus | ESCC | 1.66e-04 | 2.95e-01 | 0.1131 |
| 51313 | FAM198B | P11T-E | Human | Esophagus | ESCC | 6.58e-06 | 5.71e-01 | 0.1426 |
| 51313 | FAM198B | P12T-E | Human | Esophagus | ESCC | 7.54e-03 | 1.87e-01 | 0.1122 |
| 51313 | FAM198B | P32T-E | Human | Esophagus | ESCC | 3.81e-04 | 3.19e-01 | 0.1666 |
| 51313 | FAM198B | P37T-E | Human | Esophagus | ESCC | 1.28e-02 | 1.44e-01 | 0.1371 |
| 51313 | FAM198B | P42T-E | Human | Esophagus | ESCC | 3.98e-04 | 5.25e-01 | 0.1175 |
| 51313 | FAM198B | P44T-E | Human | Esophagus | ESCC | 2.76e-05 | 3.02e-01 | 0.1096 |
| 51313 | FAM198B | P61T-E | Human | Esophagus | ESCC | 9.05e-14 | 4.45e-01 | 0.099 |
| 51313 | FAM198B | P79T-E | Human | Esophagus | ESCC | 9.38e-03 | 7.83e-02 | 0.1154 |
| 51313 | FAM198B | P107T-E | Human | Esophagus | ESCC | 2.29e-03 | 1.21e-01 | 0.171 |
| 51313 | FAM198B | ATC12 | Human | Thyroid | ATC | 1.45e-16 | 3.77e-01 | 0.34 |
| 51313 | FAM198B | ATC2 | Human | Thyroid | ATC | 2.12e-15 | 1.65e+00 | 0.34 |
| 51313 | FAM198B | ATC4 | Human | Thyroid | ATC | 1.33e-16 | 4.70e-01 | 0.34 |
| Page: 1 |
| Tissue | Expression Dynamics | Abbreviation |
| Breast | 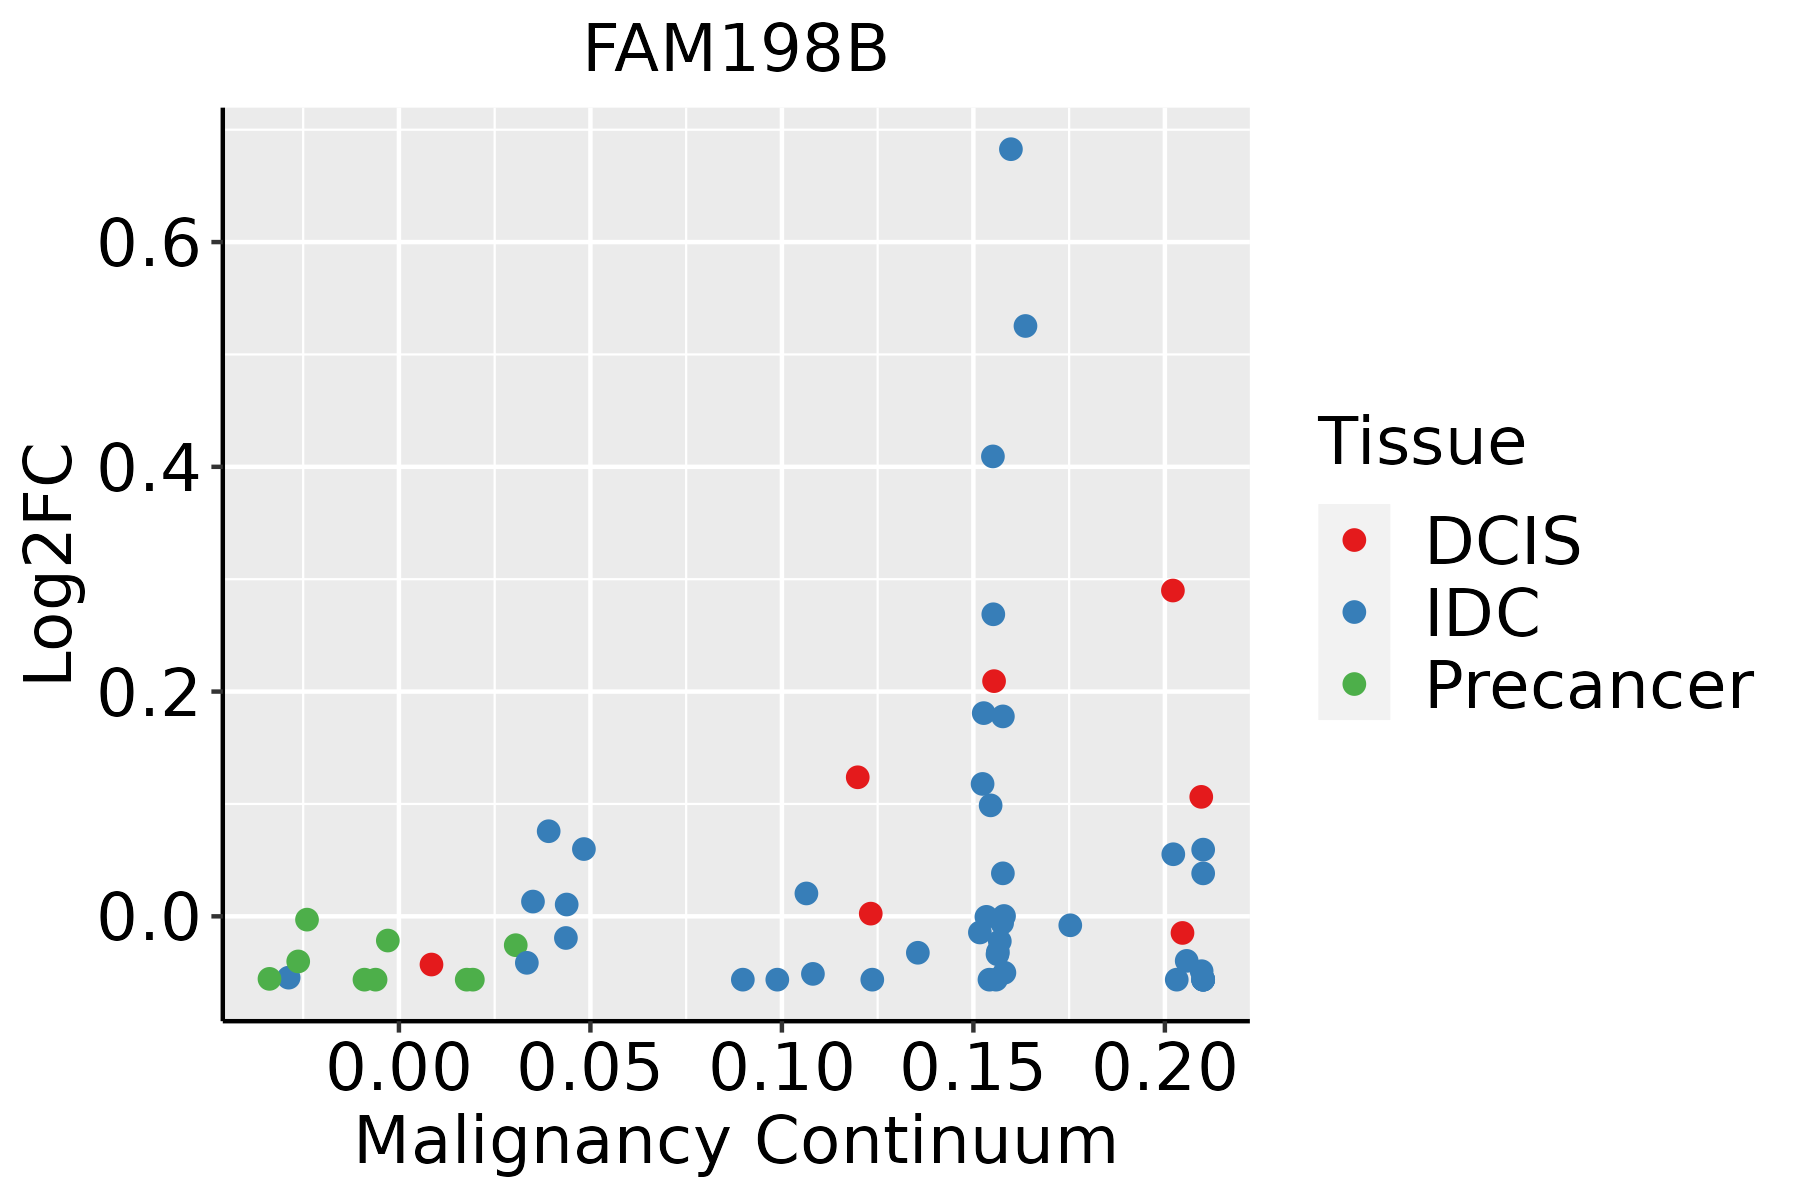 | IDC: Invasive ductal carcinoma |
| DCIS: Ductal carcinoma in situ | ||
| Precancer(BRCA1-mut): Precancerous lesion from BRCA1 mutation carriers | ||
| Esophagus |  | ESCC: Esophageal squamous cell carcinoma |
| HGIN: High-grade intraepithelial neoplasias | ||
| LGIN: Low-grade intraepithelial neoplasias | ||
| Thyroid |  | ATC: Anaplastic thyroid cancer |
| HT: Hashimoto's thyroiditis | ||
| PTC: Papillary thyroid cancer |
| ∗log2FC in expression of this searched gene in stem-like cells from each diseased tissue sample relative to stem-like cells in normal samples in each tissue plotted against the malignancy continuum. Samples are colored based on if they are from different disease stage. |
Top |
Malignant transformation related pathway analysis |
| Find out the enriched GO biological processes and KEGG pathways involved in transition from healthy to precancer to cancer |
| Tissue | Disease Stage | Enriched GO biological Processes |
| Colorectum | AD |  |
| Colorectum | SER |  |
| Colorectum | MSS |  |
| Colorectum | MSI-H |  |
| Colorectum | FAP |  |
| ∗Top 15 enriched GO BP terms are showed in the bar plot of each disease state in each tissue. Each row represents a significant GO biological process which is colored according to the -log10(p.adjust). |
| Page: 1 2 3 4 5 6 7 8 9 |
| GO ID | Tissue | Disease Stage | Description | Gene Ratio | Bg Ratio | pvalue | p.adjust | Count |
| Page: 1 |
| Pathway ID | Tissue | Disease Stage | Description | Gene Ratio | Bg Ratio | pvalue | p.adjust | qvalue | Count |
| Page: 1 |
Top |
Cell-cell communication analysis |
| Identification of potential cell-cell interactions between two cell types and their ligand-receptor pairs for different disease states |
| Ligand | Receptor | LRpair | Pathway | Tissue | Disease Stage |
| Page: 1 |
Top |
Single-cell gene regulatory network inference analysis |
| Find out the significant the regulons (TFs) and the target genes of each regulon across cell types for different disease states |
| TF | Cell Type | Tissue | Disease Stage | Target Gene | RSS | Regulon Activity |
| ∗The dot plots of a searched regulon are shown for all cell subpopulations in each disease state of each tissue based on the regulon specific score inferred using pySCENIC and by calculating the average expression. |
| Page: 1 |
Top |
Somatic mutation of malignant transformation related genes |
| Annotation of somatic variants for genes involved in malignant transformation |
| Hugo Symbol | Variant Class | Variant Classification | dbSNP RS | HGVSc | HGVSp | HGVSp Short | SWISSPROT | BIOTYPE | SIFT | PolyPhen | Tumor Sample Barcode | Tissue | Histology | Sex | Age | Stage | Therapy Types | Drugs | Outcome |
| FAM198B | insertion | Nonsense_Mutation | novel | c.635_636insTGACAGTCAGGCATACTATTAAATAGGTTACTATGGGAGGAAGTA | p.Ala212_Pro213insAspSerGlnAlaTyrTyrTerIleGlyTyrTyrGlyArgLysTyr | p.A212_P213insDSQAYY*IGYYGRKY | Q6UWH4 | protein_coding | TCGA-A8-A07P-01 | Breast | breast invasive carcinoma | Female | >=65 | I/II | Chemotherapy | 5-fluorouracil | SD | ||
| FAM198B | insertion | Nonsense_Mutation | novel | c.1285_1286insTCAAGGTTAACTCAATATCTGTGTGAAAGAGA | p.Asp429ValfsTer9 | p.D429Vfs*9 | Q6UWH4 | protein_coding | TCGA-AN-A0FN-01 | Breast | breast invasive carcinoma | Female | <65 | I/II | Unknown | Unknown | SD | ||
| FAM198B | insertion | In_Frame_Ins | novel | c.1015_1016insTGAGTGAGAACATACGATGTTTGGTTTTCCATT | p.Thr339delinsMetSerGluAsnIleArgCysLeuValPheHisSer | p.T339delinsMSENIRCLVFHS | Q6UWH4 | protein_coding | TCGA-AN-A0FX-01 | Breast | breast invasive carcinoma | Female | <65 | I/II | Unknown | Unknown | SD | ||
| FAM198B | insertion | Frame_Shift_Ins | novel | c.726_727insCTGGGAGGATATGAGAGTTCCAGGGAAATGCTGTATT | p.Gly243LeufsTer33 | p.G243Lfs*33 | Q6UWH4 | protein_coding | TCGA-AO-A0JB-01 | Breast | breast invasive carcinoma | Female | <65 | III/IV | Chemotherapy | cyclophosphamide | SD | ||
| FAM198B | deletion | Frame_Shift_Del | novel | c.852delN | p.Ile285SerfsTer11 | p.I285Sfs*11 | Q6UWH4 | protein_coding | TCGA-D8-A27V-01 | Breast | breast invasive carcinoma | Female | <65 | I/II | Hormone Therapy | tamoxiphen | SD | ||
| FAM198B | SNV | Missense_Mutation | c.214C>A | p.Arg72Ser | p.R72S | Q6UWH4 | protein_coding | tolerated(0.11) | benign(0.196) | TCGA-A6-6141-01 | Colorectum | colon adenocarcinoma | Male | <65 | I/II | Chemotherapy | 5-fu | SD | |
| FAM198B | SNV | Missense_Mutation | novel | c.980T>G | p.Val327Gly | p.V327G | Q6UWH4 | protein_coding | tolerated(0.33) | benign(0) | TCGA-A6-6649-01 | Colorectum | colon adenocarcinoma | Male | >=65 | III/IV | Chemotherapy | fluorouracil | SD |
| FAM198B | SNV | Missense_Mutation | rs762188501 | c.665G>A | p.Arg222Gln | p.R222Q | Q6UWH4 | protein_coding | tolerated(0.59) | benign(0.003) | TCGA-AA-3510-01 | Colorectum | colon adenocarcinoma | Male | >=65 | I/II | Unknown | Unknown | SD |
| FAM198B | SNV | Missense_Mutation | c.697N>A | p.Ala233Thr | p.A233T | Q6UWH4 | protein_coding | tolerated(0.57) | benign(0.005) | TCGA-AA-3672-01 | Colorectum | colon adenocarcinoma | Female | >=65 | III/IV | Unknown | Unknown | SD | |
| FAM198B | SNV | Missense_Mutation | rs376041501 | c.566N>A | p.Arg189Gln | p.R189Q | Q6UWH4 | protein_coding | tolerated(0.6) | benign(0.003) | TCGA-AA-3877-01 | Colorectum | colon adenocarcinoma | Female | >=65 | I/II | Unknown | Unknown | SD |
| Page: 1 2 3 4 5 6 7 8 |
Top |
Related drugs of malignant transformation related genes |
| Identification of chemicals and drugs interact with genes involved in malignant transfromation |
| (DGIdb 4.0) |
| Entrez ID | Symbol | Category | Interaction Types | Drug Claim Name | Drug Name | PMIDs |
| Page: 1 |

Copyright 2023-Present -The University of Texas Health Science Center at Houston |