
|
|||||
|
 | |
| |
| |
| |
| |
| |
|
Gene: FAM193B |
Gene summary for FAM193B |
| Gene information | Species | Human | Gene symbol | FAM193B | Gene ID | 54540 |
| Gene name | family with sequence similarity 193 member B | |
| Gene Alias | IRIZIO | |
| Cytomap | 5q35.3 | |
| Gene Type | protein-coding | GO ID | GO:0005575 | UniProtAcc | Q6IPW0 |
Top |
Malignant transformation analysis |
| Identification of the aberrant gene expression in precancerous and cancerous lesions by comparing the gene expression of stem-like cells in diseased tissues with normal stem cells |
| Entrez ID | Symbol | Replicates | Species | Organ | Tissue | Adj P-value | Log2FC | Malignancy |
| 54540 | FAM193B | NAFLD1 | Human | Liver | NAFLD | 7.30e-06 | 6.39e-01 | -0.04 |
| 54540 | FAM193B | HCC1_Meng | Human | Liver | HCC | 1.95e-13 | -3.30e-02 | 0.0246 |
| 54540 | FAM193B | HCC2 | Human | Liver | HCC | 3.51e-03 | 2.83e+00 | 0.5341 |
| 54540 | FAM193B | 048752_1579-all-cells | Human | Prostate | BPH | 1.63e-13 | 2.94e-01 | 0.1008 |
| 54540 | FAM193B | 052095_1628-all-cells | Human | Prostate | BPH | 2.91e-10 | 2.55e-01 | 0.1032 |
| 54540 | FAM193B | 052097_1595-all-cells | Human | Prostate | BPH | 1.71e-12 | 3.10e-01 | 0.0972 |
| 54540 | FAM193B | 052099_1652-all-cells | Human | Prostate | BPH | 2.02e-10 | 2.52e-01 | 0.1038 |
| 54540 | FAM193B | Dong_P3 | Human | Prostate | Tumor | 6.15e-03 | 8.81e-02 | 0.0278 |
| 54540 | FAM193B | Dong_P5 | Human | Prostate | Tumor | 1.70e-03 | 7.84e-03 | 0.053 |
| 54540 | FAM193B | GSM5353221_PA_PB2A_Pool_1_3_S25_L001 | Human | Prostate | Tumor | 2.03e-10 | 5.30e-01 | 0.1633 |
| 54540 | FAM193B | GSM5353223_PA_PB2B_Pool_2_S26_L001 | Human | Prostate | Tumor | 5.47e-04 | 3.32e-01 | 0.1604 |
| 54540 | FAM193B | GSM5353224_PA_PR5186_Pool_1_2_3_S27_L001 | Human | Prostate | Tumor | 1.59e-03 | 3.06e-01 | 0.1621 |
| 54540 | FAM193B | GSM5353227_PA_PR5199-193K_Pool_1_2_3_S55_L002 | Human | Prostate | Tumor | 4.53e-02 | 3.03e-01 | 0.1602 |
| 54540 | FAM193B | GSM5353236_PA_PR5251_T1_S7_L001 | Human | Prostate | Tumor | 6.21e-05 | 5.28e-01 | 0.1608 |
| 54540 | FAM193B | GSM5353237_PA_PR5251_T2_S8_L001 | Human | Prostate | Tumor | 6.76e-04 | 5.61e-01 | 0.1622 |
| 54540 | FAM193B | GSM5353240_PA_PR5254_T1_S15_L001 | Human | Prostate | Tumor | 1.68e-04 | 3.24e-01 | 0.1575 |
| Page: 1 |
| Tissue | Expression Dynamics | Abbreviation |
| Liver |  | HCC: Hepatocellular carcinoma |
| NAFLD: Non-alcoholic fatty liver disease | ||
| Prostate | 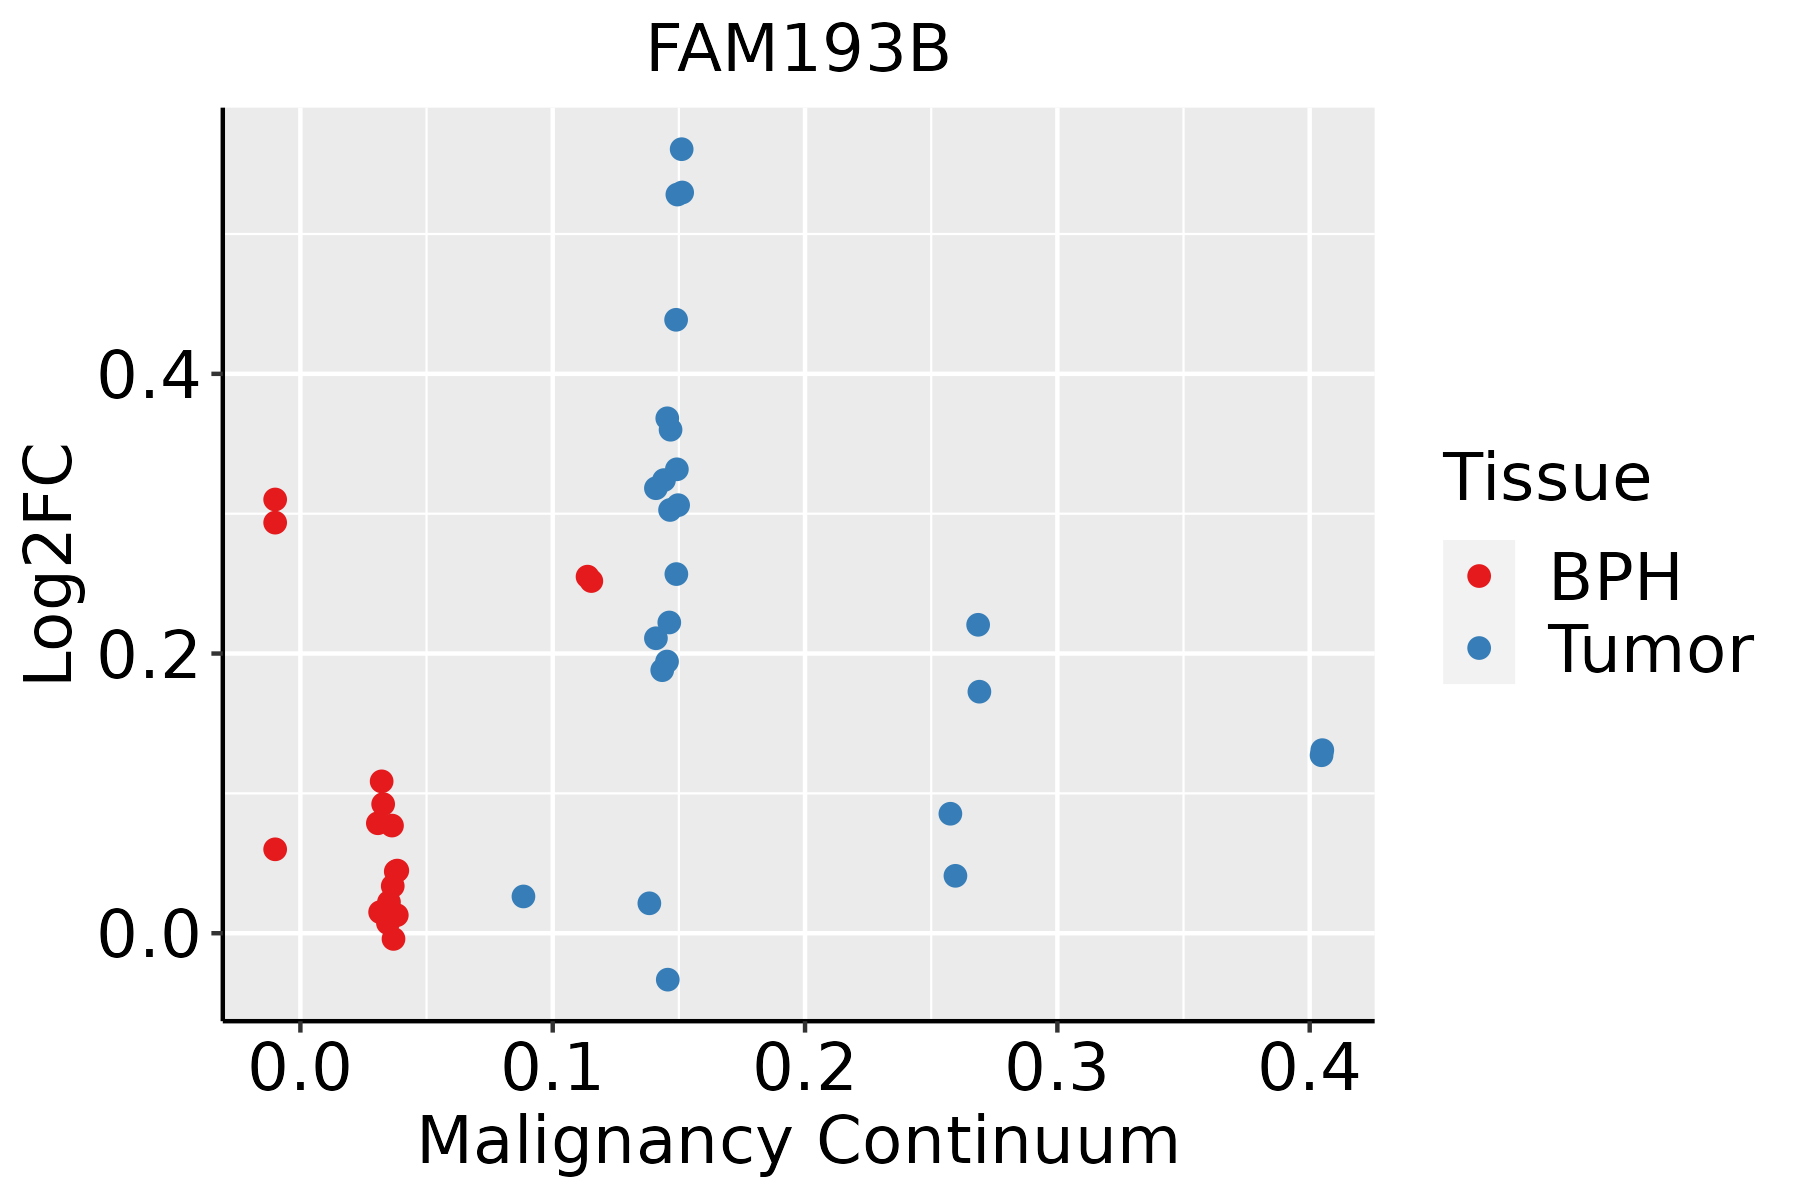 | BPH: Benign Prostatic Hyperplasia |
| ∗log2FC in expression of this searched gene in stem-like cells from each diseased tissue sample relative to stem-like cells in normal samples in each tissue plotted against the malignancy continuum. Samples are colored based on if they are from different disease stage. |
Top |
Malignant transformation related pathway analysis |
| Find out the enriched GO biological processes and KEGG pathways involved in transition from healthy to precancer to cancer |
| Tissue | Disease Stage | Enriched GO biological Processes |
| Colorectum | AD |  |
| Colorectum | SER |  |
| Colorectum | MSS |  |
| Colorectum | MSI-H |  |
| Colorectum | FAP |  |
| ∗Top 15 enriched GO BP terms are showed in the bar plot of each disease state in each tissue. Each row represents a significant GO biological process which is colored according to the -log10(p.adjust). |
| Page: 1 2 3 4 5 6 7 8 9 |
| GO ID | Tissue | Disease Stage | Description | Gene Ratio | Bg Ratio | pvalue | p.adjust | Count |
| Page: 1 |
| Pathway ID | Tissue | Disease Stage | Description | Gene Ratio | Bg Ratio | pvalue | p.adjust | qvalue | Count |
| Page: 1 |
Top |
Cell-cell communication analysis |
| Identification of potential cell-cell interactions between two cell types and their ligand-receptor pairs for different disease states |
| Ligand | Receptor | LRpair | Pathway | Tissue | Disease Stage |
| Page: 1 |
Top |
Single-cell gene regulatory network inference analysis |
| Find out the significant the regulons (TFs) and the target genes of each regulon across cell types for different disease states |
| TF | Cell Type | Tissue | Disease Stage | Target Gene | RSS | Regulon Activity |
| ∗The dot plots of a searched regulon are shown for all cell subpopulations in each disease state of each tissue based on the regulon specific score inferred using pySCENIC and by calculating the average expression. |
| Page: 1 |
Top |
Somatic mutation of malignant transformation related genes |
| Annotation of somatic variants for genes involved in malignant transformation |
| Hugo Symbol | Variant Class | Variant Classification | dbSNP RS | HGVSc | HGVSp | HGVSp Short | SWISSPROT | BIOTYPE | SIFT | PolyPhen | Tumor Sample Barcode | Tissue | Histology | Sex | Age | Stage | Therapy Types | Drugs | Outcome |
| FAM193B | SNV | Missense_Mutation | rs780445851 | c.757N>A | p.Gly253Ser | p.G253S | Q96PV7 | protein_coding | tolerated(0.09) | probably_damaging(0.914) | TCGA-A8-A07R-01 | Breast | breast invasive carcinoma | Female | >=65 | III/IV | Ancillary | zoledronic | SD |
| FAM193B | SNV | Missense_Mutation | c.1993A>G | p.Lys665Glu | p.K665E | Q96PV7 | protein_coding | deleterious(0) | probably_damaging(0.991) | TCGA-BH-A18G-01 | Breast | breast invasive carcinoma | Female | >=65 | I/II | Unknown | Unknown | SD | |
| FAM193B | SNV | Missense_Mutation | novel | c.1563T>G | p.Ser521Arg | p.S521R | Q96PV7 | protein_coding | deleterious(0) | benign(0.033) | TCGA-C8-A26V-01 | Breast | breast invasive carcinoma | Female | <65 | III/IV | Hormone Therapy | tamoxiphen | CR |
| FAM193B | SNV | Missense_Mutation | c.1180A>C | p.Ser394Arg | p.S394R | Q96PV7 | protein_coding | deleterious(0.01) | probably_damaging(0.997) | TCGA-D8-A1XK-01 | Breast | breast invasive carcinoma | Female | <65 | I/II | Chemotherapy | doxorubicine+cyclophosphamide | SD | |
| FAM193B | deletion | Frame_Shift_Del | c.614delN | p.Ser205TrpfsTer57 | p.S205Wfs*57 | Q96PV7 | protein_coding | TCGA-AR-A1AH-01 | Breast | breast invasive carcinoma | Female | <65 | I/II | Unspecific | PD | ||||
| FAM193B | SNV | Missense_Mutation | rs377320546 | c.1190N>A | p.Arg397Gln | p.R397Q | Q96PV7 | protein_coding | deleterious(0.05) | possibly_damaging(0.889) | TCGA-C5-A3HD-01 | Cervix | cervical & endocervical cancer | Female | <65 | I/II | Chemotherapy | cisplatin | SD |
| FAM193B | insertion | Frame_Shift_Ins | novel | c.219_220insCC | p.Ala74ProfsTer50 | p.A74Pfs*50 | Q96PV7 | protein_coding | TCGA-EA-A3HU-01 | Cervix | cervical & endocervical cancer | Female | <65 | I/II | Unknown | Unknown | SD | ||
| FAM193B | SNV | Missense_Mutation | c.452C>T | p.Ala151Val | p.A151V | Q96PV7 | protein_coding | tolerated(0.11) | probably_damaging(0.915) | TCGA-CA-6718-01 | Colorectum | colon adenocarcinoma | Male | <65 | I/II | Unknown | Unknown | PD | |
| FAM193B | SNV | Missense_Mutation | rs144161370 | c.2258N>A | p.Arg753Gln | p.R753Q | Q96PV7 | protein_coding | deleterious(0) | possibly_damaging(0.563) | TCGA-CK-5913-01 | Colorectum | colon adenocarcinoma | Female | <65 | I/II | Unknown | Unknown | SD |
| FAM193B | SNV | Missense_Mutation | rs759146797 | c.1274N>T | p.Ala425Val | p.A425V | Q96PV7 | protein_coding | deleterious(0) | possibly_damaging(0.902) | TCGA-A5-A0VP-01 | Endometrium | uterine corpus endometrioid carcinoma | Female | >=65 | I/II | Unknown | Unknown | SD |
| Page: 1 2 3 4 |
Top |
Related drugs of malignant transformation related genes |
| Identification of chemicals and drugs interact with genes involved in malignant transfromation |
| (DGIdb 4.0) |
| Entrez ID | Symbol | Category | Interaction Types | Drug Claim Name | Drug Name | PMIDs |
| Page: 1 |

Copyright 2023-Present -The University of Texas Health Science Center at Houston |