
|
|||||
|
 | |
| |
| |
| |
| |
| |
|
Gene: FAM189B |
Gene summary for FAM189B |
| Gene information | Species | Human | Gene symbol | FAM189B | Gene ID | 10712 |
| Gene name | family with sequence similarity 189 member B | |
| Gene Alias | C1orf2 | |
| Cytomap | 1q22 | |
| Gene Type | protein-coding | GO ID | GO:0008150 | UniProtAcc | P81408 |
Top |
Malignant transformation analysis |
| Identification of the aberrant gene expression in precancerous and cancerous lesions by comparing the gene expression of stem-like cells in diseased tissues with normal stem cells |
| Entrez ID | Symbol | Replicates | Species | Organ | Tissue | Adj P-value | Log2FC | Malignancy |
| 10712 | FAM189B | LZE2T | Human | Esophagus | ESCC | 3.05e-04 | 7.85e-01 | 0.082 |
| 10712 | FAM189B | LZE4T | Human | Esophagus | ESCC | 3.59e-02 | 9.91e-02 | 0.0811 |
| 10712 | FAM189B | LZE7T | Human | Esophagus | ESCC | 2.01e-06 | 4.29e-01 | 0.0667 |
| 10712 | FAM189B | LZE24T | Human | Esophagus | ESCC | 6.13e-07 | 3.47e-01 | 0.0596 |
| 10712 | FAM189B | LZE21T | Human | Esophagus | ESCC | 3.75e-03 | 1.74e-01 | 0.0655 |
| 10712 | FAM189B | P1T-E | Human | Esophagus | ESCC | 5.53e-06 | 3.16e-01 | 0.0875 |
| 10712 | FAM189B | P2T-E | Human | Esophagus | ESCC | 1.70e-25 | 4.09e-01 | 0.1177 |
| 10712 | FAM189B | P4T-E | Human | Esophagus | ESCC | 3.95e-11 | 1.97e-01 | 0.1323 |
| 10712 | FAM189B | P5T-E | Human | Esophagus | ESCC | 1.41e-11 | 2.76e-01 | 0.1327 |
| 10712 | FAM189B | P8T-E | Human | Esophagus | ESCC | 5.80e-09 | 1.83e-01 | 0.0889 |
| 10712 | FAM189B | P9T-E | Human | Esophagus | ESCC | 1.77e-07 | 2.76e-01 | 0.1131 |
| 10712 | FAM189B | P10T-E | Human | Esophagus | ESCC | 3.80e-18 | 3.04e-01 | 0.116 |
| 10712 | FAM189B | P11T-E | Human | Esophagus | ESCC | 2.90e-12 | 4.46e-01 | 0.1426 |
| 10712 | FAM189B | P12T-E | Human | Esophagus | ESCC | 7.00e-16 | 2.25e-01 | 0.1122 |
| 10712 | FAM189B | P15T-E | Human | Esophagus | ESCC | 5.61e-19 | 4.49e-01 | 0.1149 |
| 10712 | FAM189B | P16T-E | Human | Esophagus | ESCC | 7.47e-22 | 4.66e-01 | 0.1153 |
| 10712 | FAM189B | P17T-E | Human | Esophagus | ESCC | 7.79e-07 | 3.83e-01 | 0.1278 |
| 10712 | FAM189B | P20T-E | Human | Esophagus | ESCC | 1.58e-15 | 3.69e-01 | 0.1124 |
| 10712 | FAM189B | P21T-E | Human | Esophagus | ESCC | 8.90e-20 | 3.77e-01 | 0.1617 |
| 10712 | FAM189B | P22T-E | Human | Esophagus | ESCC | 1.72e-17 | 3.04e-01 | 0.1236 |
| Page: 1 2 3 4 5 |
| Tissue | Expression Dynamics | Abbreviation |
| Esophagus | 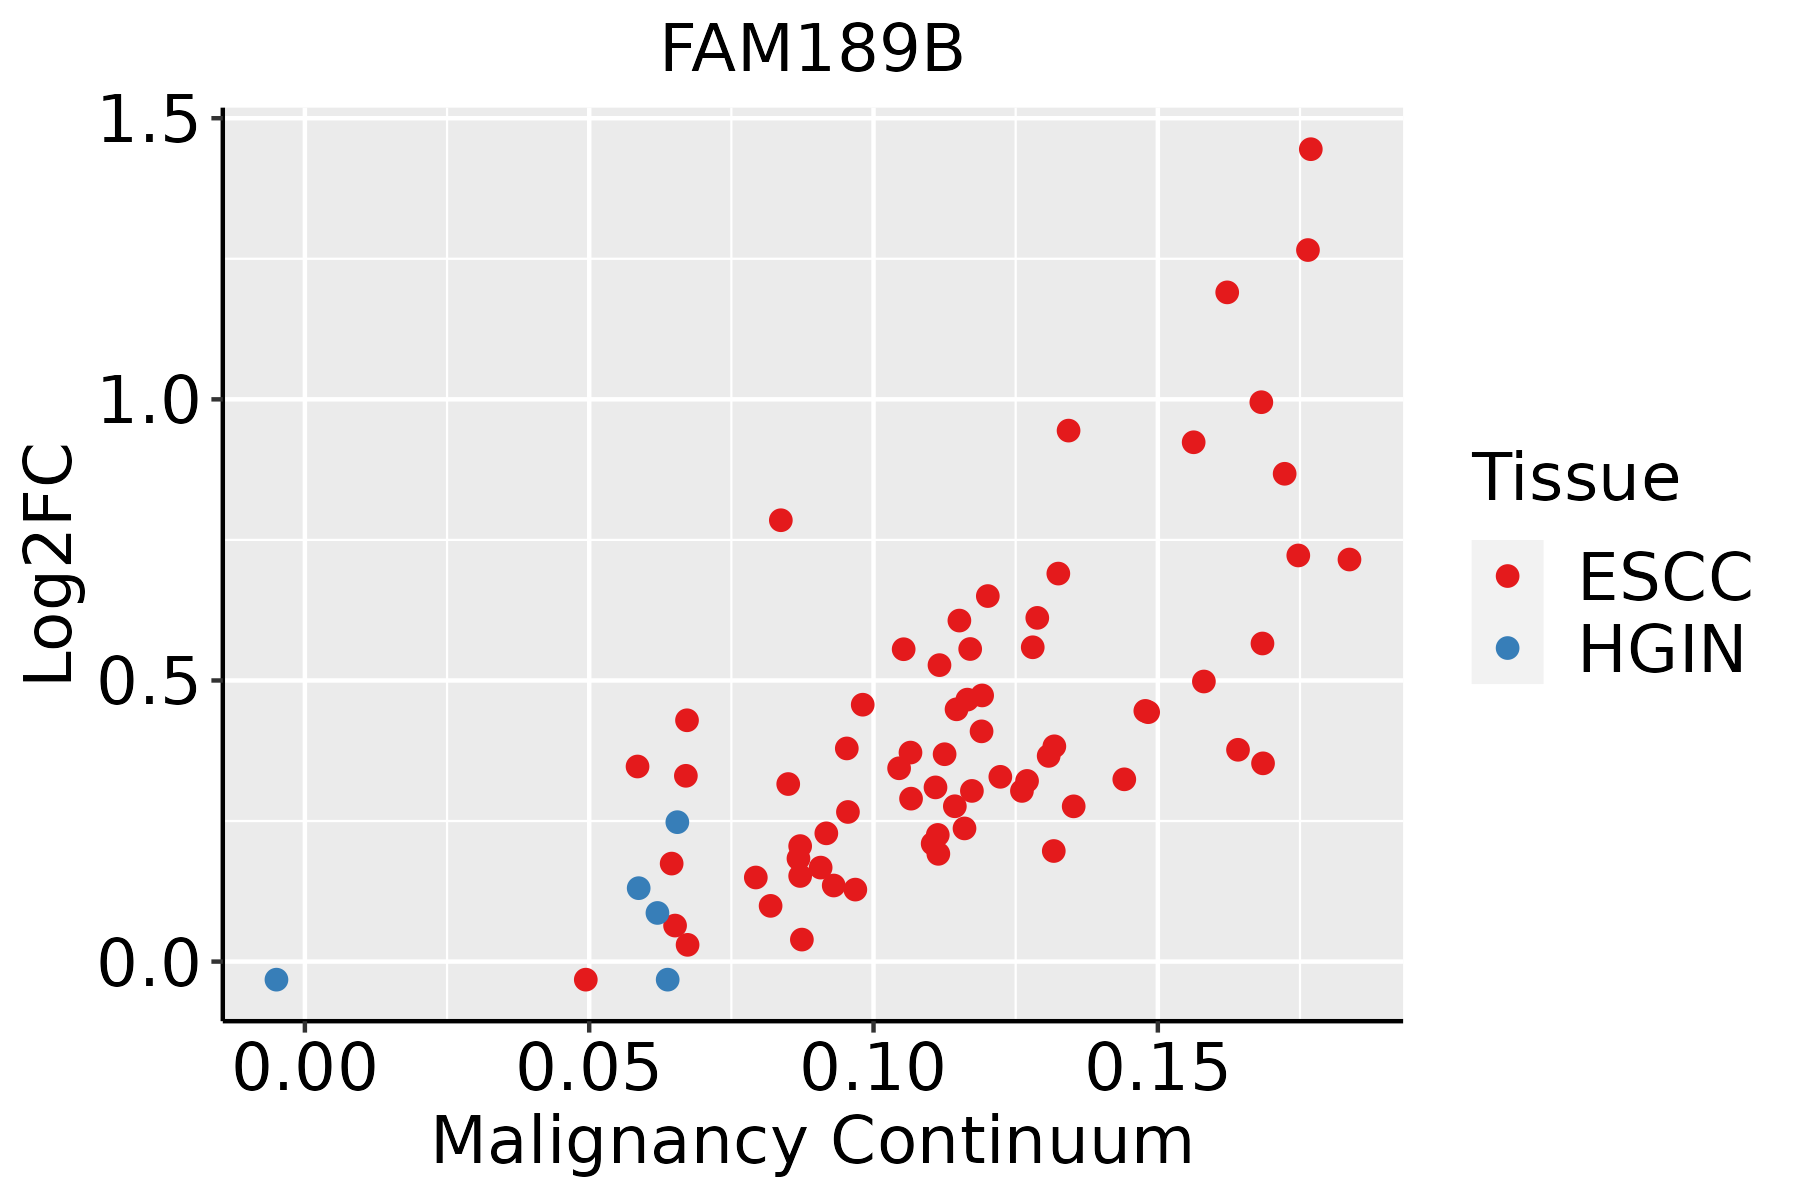 | ESCC: Esophageal squamous cell carcinoma |
| HGIN: High-grade intraepithelial neoplasias | ||
| LGIN: Low-grade intraepithelial neoplasias | ||
| Liver | 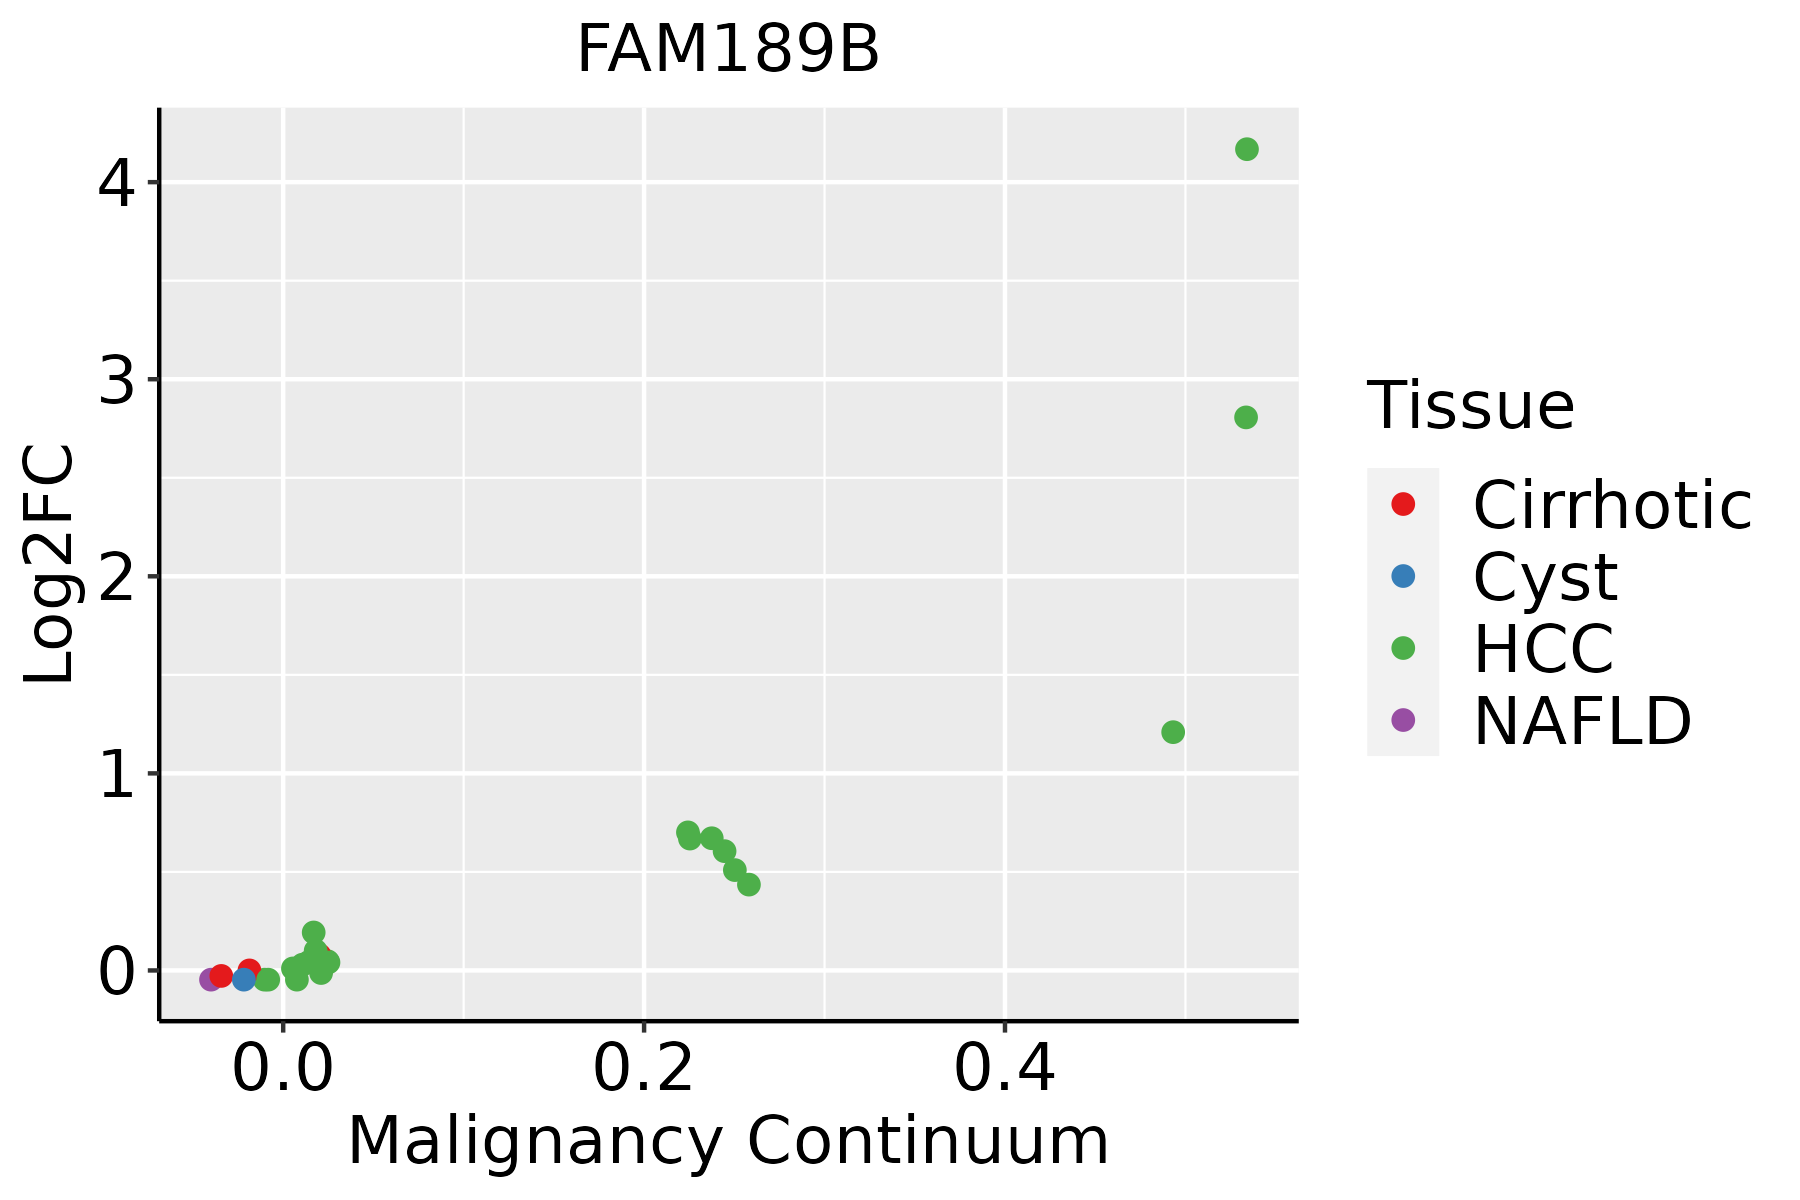 | HCC: Hepatocellular carcinoma |
| NAFLD: Non-alcoholic fatty liver disease | ||
| Oral Cavity | 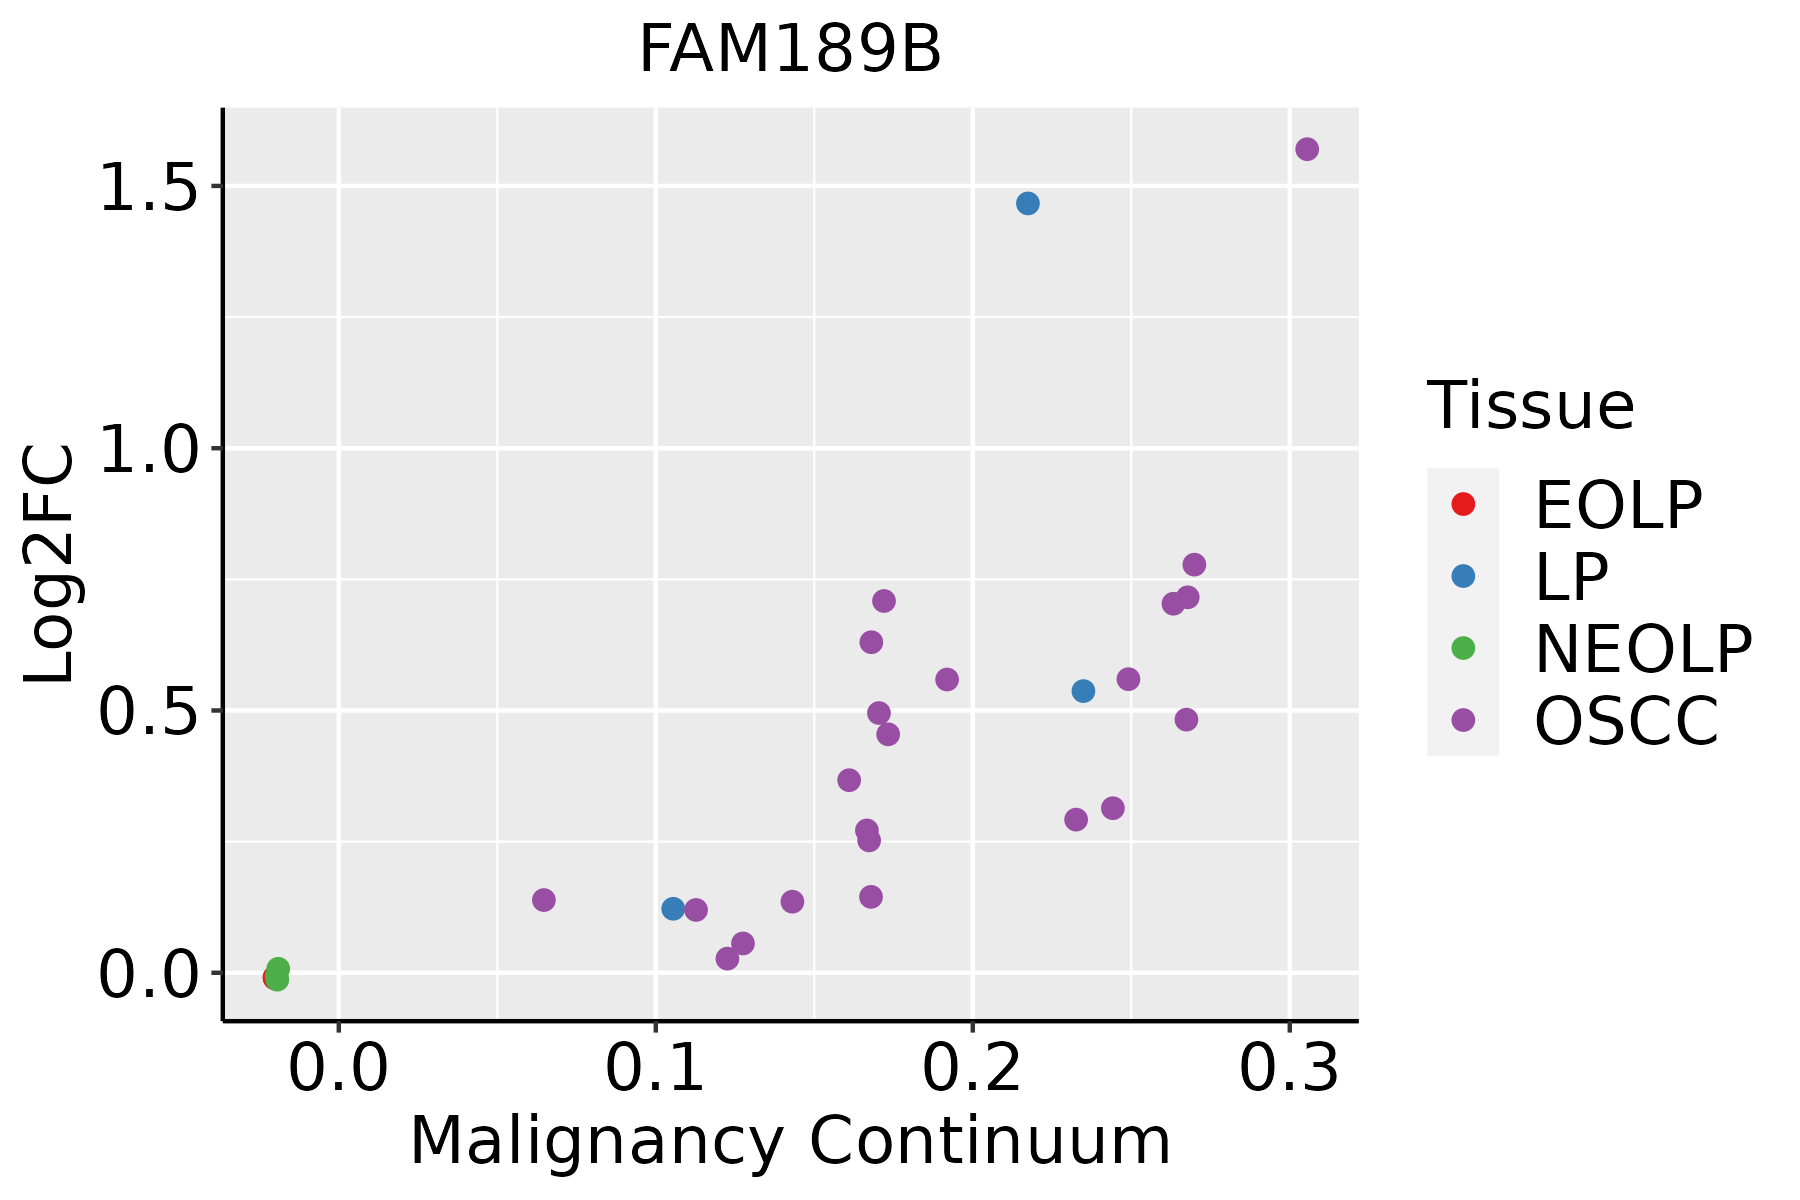 | EOLP: Erosive Oral lichen planus |
| LP: leukoplakia | ||
| NEOLP: Non-erosive oral lichen planus | ||
| OSCC: Oral squamous cell carcinoma |
| ∗log2FC in expression of this searched gene in stem-like cells from each diseased tissue sample relative to stem-like cells in normal samples in each tissue plotted against the malignancy continuum. Samples are colored based on if they are from different disease stage. |
Top |
Malignant transformation related pathway analysis |
| Find out the enriched GO biological processes and KEGG pathways involved in transition from healthy to precancer to cancer |
| Tissue | Disease Stage | Enriched GO biological Processes |
| Colorectum | AD |  |
| Colorectum | SER |  |
| Colorectum | MSS |  |
| Colorectum | MSI-H |  |
| Colorectum | FAP |  |
| ∗Top 15 enriched GO BP terms are showed in the bar plot of each disease state in each tissue. Each row represents a significant GO biological process which is colored according to the -log10(p.adjust). |
| Page: 1 2 3 4 5 6 7 8 9 |
| GO ID | Tissue | Disease Stage | Description | Gene Ratio | Bg Ratio | pvalue | p.adjust | Count |
| Page: 1 |
| Pathway ID | Tissue | Disease Stage | Description | Gene Ratio | Bg Ratio | pvalue | p.adjust | qvalue | Count |
| Page: 1 |
Top |
Cell-cell communication analysis |
| Identification of potential cell-cell interactions between two cell types and their ligand-receptor pairs for different disease states |
| Ligand | Receptor | LRpair | Pathway | Tissue | Disease Stage |
| Page: 1 |
Top |
Single-cell gene regulatory network inference analysis |
| Find out the significant the regulons (TFs) and the target genes of each regulon across cell types for different disease states |
| TF | Cell Type | Tissue | Disease Stage | Target Gene | RSS | Regulon Activity |
| ∗The dot plots of a searched regulon are shown for all cell subpopulations in each disease state of each tissue based on the regulon specific score inferred using pySCENIC and by calculating the average expression. |
| Page: 1 |
Top |
Somatic mutation of malignant transformation related genes |
| Annotation of somatic variants for genes involved in malignant transformation |
| Hugo Symbol | Variant Class | Variant Classification | dbSNP RS | HGVSc | HGVSp | HGVSp Short | SWISSPROT | BIOTYPE | SIFT | PolyPhen | Tumor Sample Barcode | Tissue | Histology | Sex | Age | Stage | Therapy Types | Drugs | Outcome |
| FAM189B | SNV | Missense_Mutation | c.153N>G | p.Phe51Leu | p.F51L | P81408 | protein_coding | tolerated(0.25) | benign(0.246) | TCGA-A1-A0SI-01 | Breast | breast invasive carcinoma | Female | <65 | I/II | Unknown | Unknown | SD | |
| FAM189B | SNV | Missense_Mutation | rs764162205 | c.214N>A | p.Ala72Thr | p.A72T | P81408 | protein_coding | deleterious(0.01) | benign(0.391) | TCGA-A8-A09Z-01 | Breast | breast invasive carcinoma | Female | >=65 | I/II | Unknown | Unknown | SD |
| FAM189B | SNV | Missense_Mutation | novel | c.314G>T | p.Cys105Phe | p.C105F | P81408 | protein_coding | deleterious(0) | probably_damaging(0.987) | TCGA-S3-A6ZH-01 | Breast | breast invasive carcinoma | Female | <65 | III/IV | Chemotherapy | adriamycin | CR |
| FAM189B | insertion | In_Frame_Ins | novel | c.365_366insATG | p.Leu122_Ala123insTrp | p.L122_A123insW | P81408 | protein_coding | TCGA-AC-A3QQ-01 | Breast | breast invasive carcinoma | Female | <65 | I/II | Unknown | Unknown | SD | ||
| FAM189B | insertion | Nonsense_Mutation | novel | c.108_109insGTGGGGTCTTGCTGGGGGAGCTAAGGAAGGGGA | p.Thr36_Leu37insValGlySerCysTrpGlySerTerGlyArgGly | p.T36_L37insVGSCWGS*GRG | P81408 | protein_coding | TCGA-AN-A0FX-01 | Breast | breast invasive carcinoma | Female | <65 | I/II | Unknown | Unknown | SD | ||
| FAM189B | SNV | Missense_Mutation | rs566720731 | c.964G>A | p.Val322Met | p.V322M | P81408 | protein_coding | deleterious(0) | probably_damaging(0.981) | TCGA-2W-A8YY-01 | Cervix | cervical & endocervical cancer | Female | <65 | I/II | Chemotherapy | cisplatin | CR |
| FAM189B | SNV | Missense_Mutation | c.1646N>A | p.Arg549Gln | p.R549Q | P81408 | protein_coding | tolerated(0.39) | benign(0.037) | TCGA-A6-5657-01 | Colorectum | colon adenocarcinoma | Male | >=65 | III/IV | Ancillary | leucovorin | SD | |
| FAM189B | SNV | Missense_Mutation | c.223N>A | p.Ser75Thr | p.S75T | P81408 | protein_coding | tolerated(0.2) | benign(0.02) | TCGA-AD-6895-01 | Colorectum | colon adenocarcinoma | Male | >=65 | III/IV | Unknown | Unknown | SD | |
| FAM189B | SNV | Missense_Mutation | rs774269913 | c.450N>T | p.Glu150Asp | p.E150D | P81408 | protein_coding | tolerated(0.25) | benign(0.003) | TCGA-AY-4070-01 | Colorectum | colon adenocarcinoma | Female | <65 | III/IV | Chemotherapy | 5-fu | PD |
| FAM189B | SNV | Missense_Mutation | c.97N>A | p.Ala33Thr | p.A33T | P81408 | protein_coding | tolerated(0.14) | possibly_damaging(0.624) | TCGA-G4-6320-01 | Colorectum | colon adenocarcinoma | Male | >=65 | III/IV | Chemotherapy | oxaliplatin | SD |
| Page: 1 2 3 4 |
Top |
Related drugs of malignant transformation related genes |
| Identification of chemicals and drugs interact with genes involved in malignant transfromation |
| (DGIdb 4.0) |
| Entrez ID | Symbol | Category | Interaction Types | Drug Claim Name | Drug Name | PMIDs |
| Page: 1 |

Copyright 2023-Present -The University of Texas Health Science Center at Houston |