| Entrez ID | Symbol | Replicates | Species | Organ | Tissue | Adj P-value | Log2FC | Malignancy |
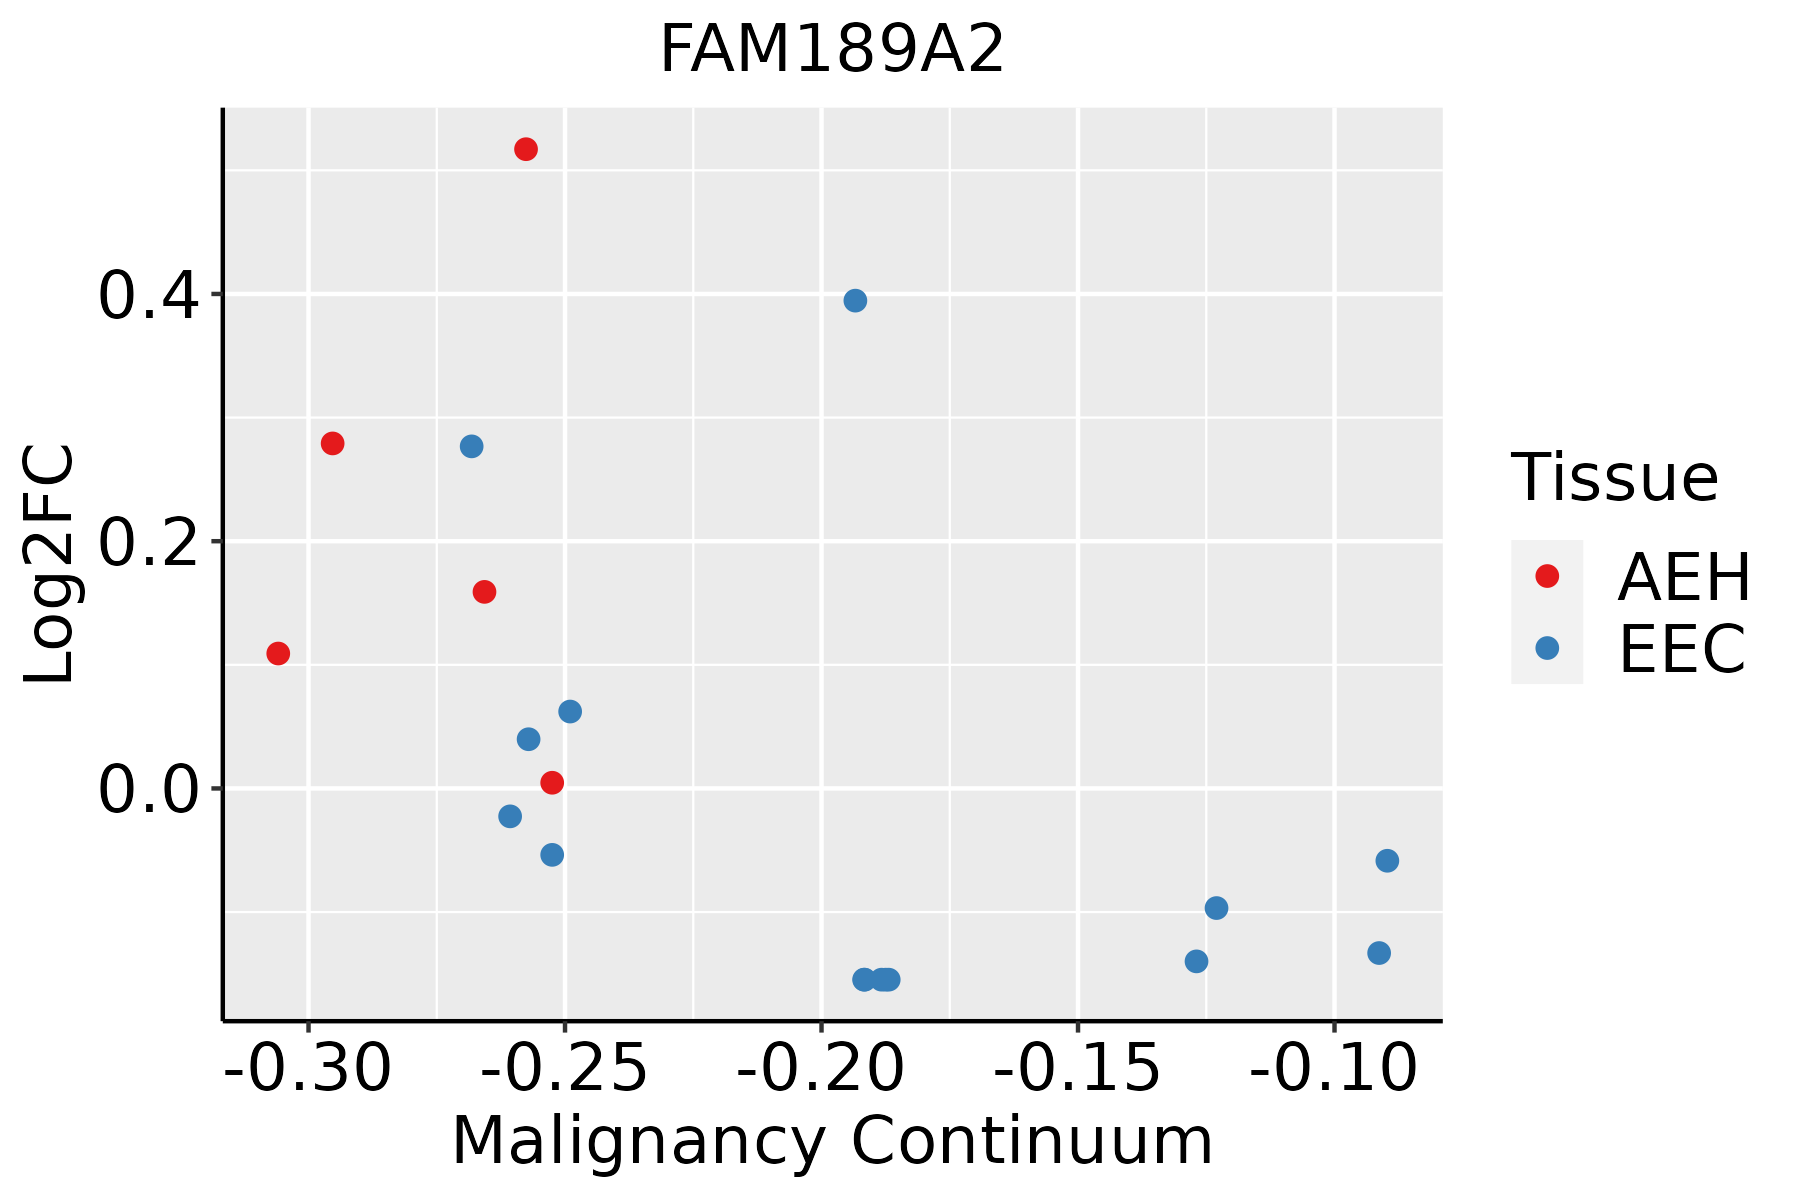
| 9413 | FAM189A2 | AEH-subject3 | Human | Endometrium | AEH | 1.80e-17 | 5.17e-01 | -0.2576 |
| 9413 | FAM189A2 | AEH-subject5 | Human | Endometrium | AEH | 2.38e-04 | 2.79e-01 | -0.2953 |
| 9413 | FAM189A2 | EEC-subject1 | Human | Endometrium | EEC | 6.71e-05 | 2.77e-01 | -0.2682 |
| 9413 | FAM189A2 | GSM6177620_NYU_UCEC1_lib3_lib3 | Human | Endometrium | EEC | 3.38e-02 | -1.55e-01 | -0.1883 |
| 9413 | FAM189A2 | GSM6177621_NYU_UCEC2_lib1_lib1 | Human | Endometrium | EEC | 1.65e-11 | 3.95e-01 | -0.1934 |
| 9413 | FAM189A2 | GSM6177622_NYU_UCEC3_lib1_lib1 | Human | Endometrium | EEC | 3.29e-02 | -1.55e-01 | -0.1917 |
| 9413 | FAM189A2 | GSM6177622_NYU_UCEC3_lib2_lib2 | Human | Endometrium | EEC | 1.03e-03 | -1.55e-01 | -0.1916 |
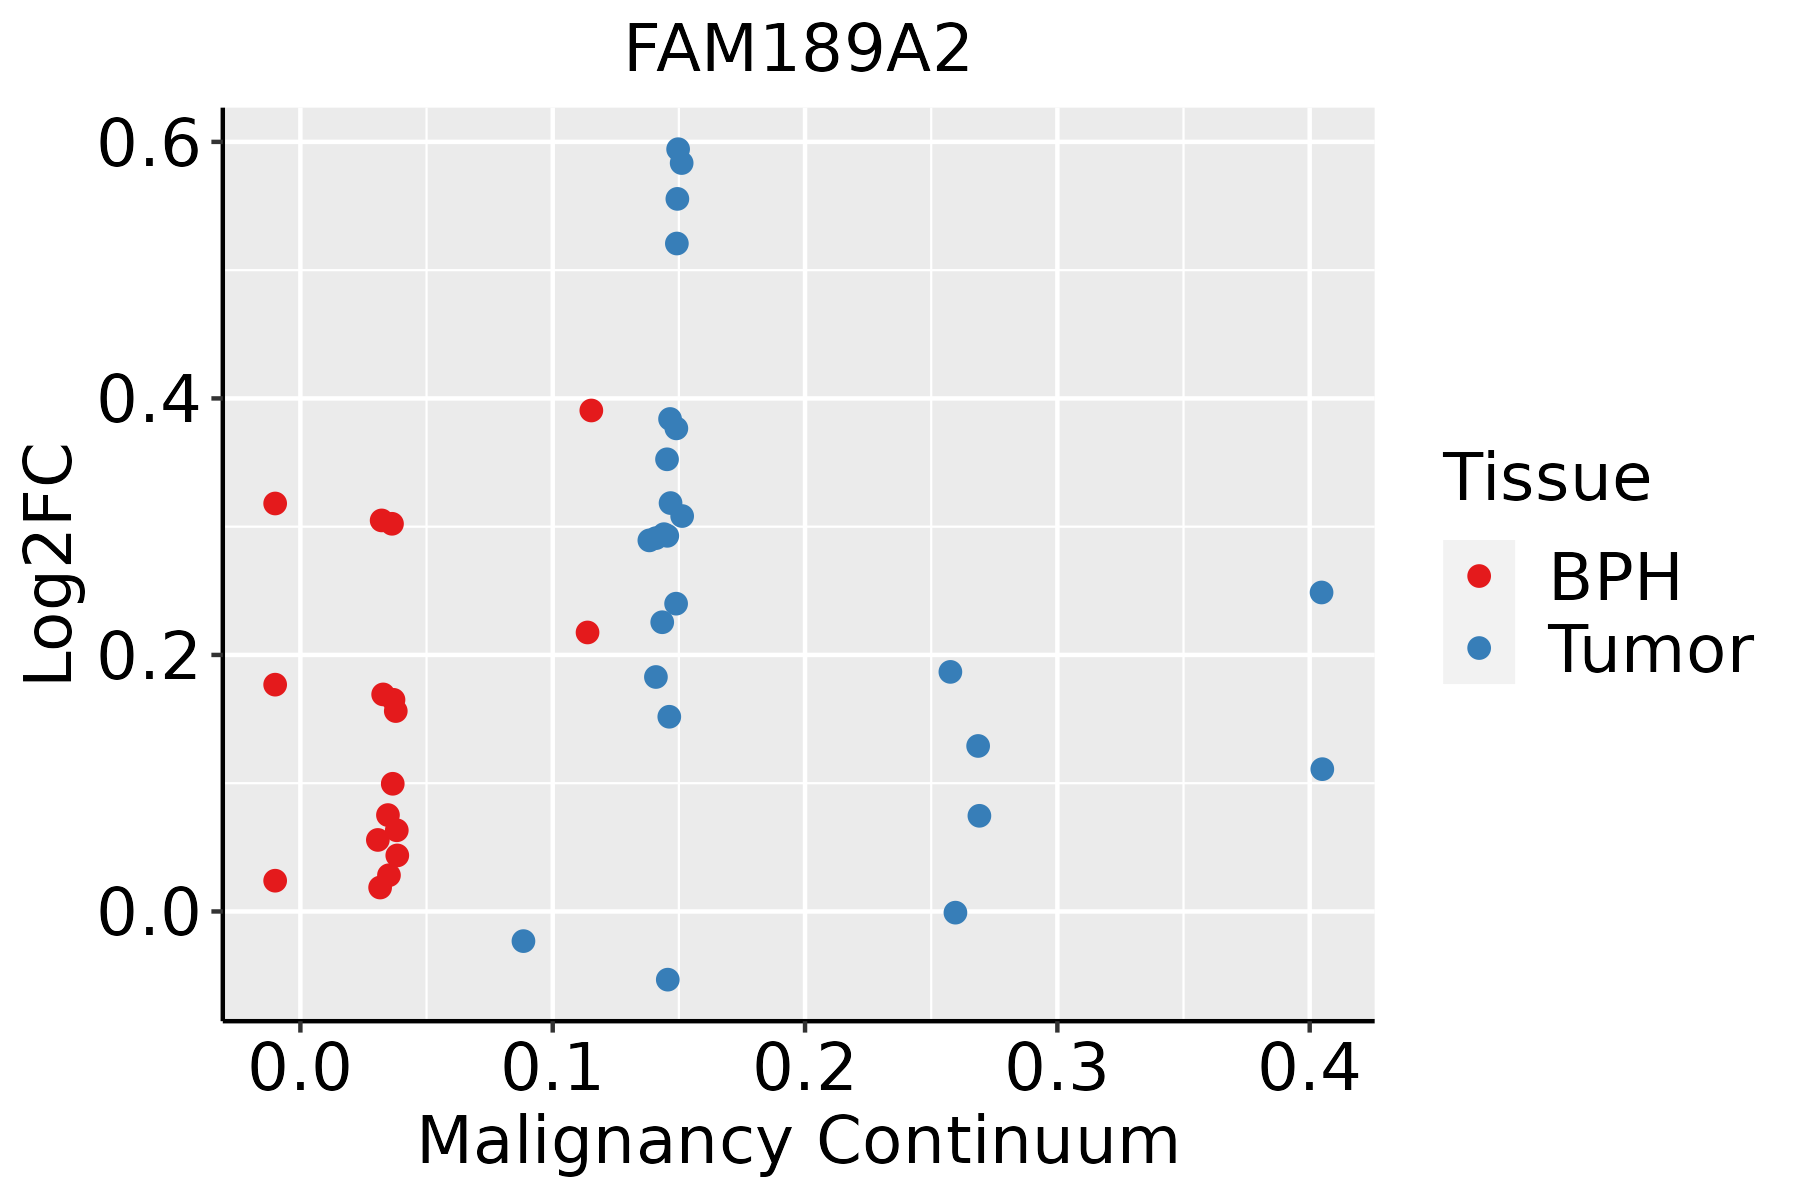
| 9413 | FAM189A2 | GSM5252132_BPH389PrGF | Human | Prostate | BPH | 7.11e-05 | 3.05e-01 | -0.2247 |
| 9413 | FAM189A2 | GSM5252136_BPH556PrGA1_Fcol | Human | Prostate | BPH | 6.98e-04 | 1.56e-01 | -0.23 |
| 9413 | FAM189A2 | GSM5252137_BPH556PrGA2_Fcol | Human | Prostate | BPH | 2.10e-05 | 3.02e-01 | -0.23 |
| 9413 | FAM189A2 | 048752_1579-all-cells | Human | Prostate | BPH | 8.71e-08 | 3.18e-01 | 0.1008 |
| 9413 | FAM189A2 | 052095_1628-all-cells | Human | Prostate | BPH | 3.09e-06 | 2.18e-01 | 0.1032 |
| 9413 | FAM189A2 | 052097_1595-all-cells | Human | Prostate | BPH | 6.41e-04 | 1.77e-01 | 0.0972 |
| 9413 | FAM189A2 | 052099_1652-all-cells | Human | Prostate | BPH | 1.65e-16 | 3.91e-01 | 0.1038 |
| 9413 | FAM189A2 | GSM5353222_PA_PB2B_Pool_1_3_S52_L002 | Human | Prostate | Tumor | 4.13e-05 | 3.77e-01 | 0.1608 |
| 9413 | FAM189A2 | GSM5353223_PA_PB2B_Pool_2_S26_L001 | Human | Prostate | Tumor | 5.45e-09 | 5.21e-01 | 0.1604 |
| 9413 | FAM189A2 | GSM5353224_PA_PR5186_Pool_1_2_3_S27_L001 | Human | Prostate | Tumor | 9.10e-11 | 5.94e-01 | 0.1621 |
| 9413 | FAM189A2 | GSM5353227_PA_PR5199-193K_Pool_1_2_3_S55_L002 | Human | Prostate | Tumor | 1.03e-03 | 3.84e-01 | 0.1602 |
| 9413 | FAM189A2 | GSM5353236_PA_PR5251_T1_S7_L001 | Human | Prostate | Tumor | 3.44e-03 | 5.56e-01 | 0.1608 |
| 9413 | FAM189A2 | GSM5353237_PA_PR5251_T2_S8_L001 | Human | Prostate | Tumor | 2.16e-04 | 5.84e-01 | 0.1622 |
| Hugo Symbol | Variant Class | Variant Classification | dbSNP RS | HGVSc | HGVSp | HGVSp Short | SWISSPROT | BIOTYPE | SIFT | PolyPhen | Tumor Sample Barcode | Tissue | Histology | Sex | Age | Stage | Therapy Types | Drugs | Outcome |
| FAM189A2 | SNV | Missense_Mutation | novel | c.416N>T | p.Pro139Leu | p.P139L | Q15884 | protein_coding | tolerated(0.09) | benign(0.056) | TCGA-AN-A046-01 | Breast | breast invasive carcinoma | Female | >=65 | I/II | Unknown | Unknown | SD |
| FAM189A2 | SNV | Missense_Mutation | | c.266N>A | p.Ala89Asp | p.A89D | Q15884 | protein_coding | deleterious(0) | probably_damaging(0.935) | TCGA-AN-A0FS-01 | Breast | breast invasive carcinoma | Female | <65 | I/II | Unknown | Unknown | SD |
| FAM189A2 | SNV | Missense_Mutation | novel | c.238N>T | p.His80Tyr | p.H80Y | Q15884 | protein_coding | deleterious(0.02) | probably_damaging(0.932) | TCGA-BH-A0WA-01 | Breast | breast invasive carcinoma | Female | >=65 | I/II | Unknown | Unknown | SD |
| FAM189A2 | SNV | Missense_Mutation | | c.187G>C | p.Asp63His | p.D63H | Q15884 | protein_coding | deleterious(0) | possibly_damaging(0.873) | TCGA-C8-A26Y-01 | Breast | breast invasive carcinoma | Female | >=65 | I/II | Unknown | Unknown | SD |
| FAM189A2 | SNV | Missense_Mutation | novel | c.505C>G | p.Pro169Ala | p.P169A | Q15884 | protein_coding | tolerated(0.79) | benign(0.011) | TCGA-S3-AA10-01 | Breast | breast invasive carcinoma | Female | >=65 | I/II | Chemotherapy | cytoxan | CR |
| FAM189A2 | SNV | Missense_Mutation | | c.58N>G | p.Leu20Val | p.L20V | Q15884 | protein_coding | tolerated(0.14) | probably_damaging(0.998) | TCGA-IR-A3LL-01 | Cervix | cervical & endocervical cancer | Female | <65 | I/II | Chemotherapy | cisplatin | CR |
| FAM189A2 | SNV | Missense_Mutation | novel | c.1256C>G | p.Thr419Arg | p.T419R | Q15884 | protein_coding | deleterious(0) | benign(0.075) | TCGA-JW-A5VL-01 | Cervix | cervical & endocervical cancer | Female | <65 | I/II | Unknown | Unknown | SD |
| FAM189A2 | SNV | Missense_Mutation | | c.385N>A | p.Glu129Lys | p.E129K | Q15884 | protein_coding | tolerated(0.14) | benign(0.355) | TCGA-MA-AA41-01 | Cervix | cervical & endocervical cancer | Female | <65 | I/II | Unknown | Unknown | SD |
| FAM189A2 | SNV | Missense_Mutation | novel | c.715N>A | p.Pro239Thr | p.P239T | Q15884 | protein_coding | tolerated(0.11) | benign(0.003) | TCGA-VS-A9UP-01 | Cervix | cervical & endocervical cancer | Female | <65 | I/II | Chemotherapy | cisplatin | PD |
| FAM189A2 | SNV | Missense_Mutation | rs777160692 | c.584C>T | p.Pro195Leu | p.P195L | Q15884 | protein_coding | deleterious(0) | probably_damaging(0.998) | TCGA-XS-A8TJ-01 | Cervix | cervical & endocervical cancer | Female | <65 | I/II | Chemotherapy | cisplatin | SD |