
|
|||||
|
 | |
| |
| |
| |
| |
| |
|
Gene: FAM178B |
Gene summary for FAM178B |
| Gene information | Species | Human | Gene symbol | FAM178B | Gene ID | 51252 |
| Gene name | family with sequence similarity 178 member B | |
| Gene Alias | FAM178B | |
| Cytomap | 2q11.2 | |
| Gene Type | protein-coding | GO ID | NA | UniProtAcc | B3KV66 |
Top |
Malignant transformation analysis |
| Identification of the aberrant gene expression in precancerous and cancerous lesions by comparing the gene expression of stem-like cells in diseased tissues with normal stem cells |
| Entrez ID | Symbol | Replicates | Species | Organ | Tissue | Adj P-value | Log2FC | Malignancy |
| 51252 | FAM178B | P2T-E | Human | Esophagus | ESCC | 4.05e-32 | 5.80e-01 | 0.1177 |
| 51252 | FAM178B | P20T-E | Human | Esophagus | ESCC | 2.32e-06 | 1.59e-01 | 0.1124 |
| 51252 | FAM178B | P21T-E | Human | Esophagus | ESCC | 1.62e-13 | 2.81e-01 | 0.1617 |
| 51252 | FAM178B | P27T-E | Human | Esophagus | ESCC | 9.35e-10 | 1.87e-01 | 0.1055 |
| 51252 | FAM178B | P30T-E | Human | Esophagus | ESCC | 9.17e-18 | 4.72e-01 | 0.137 |
| 51252 | FAM178B | P37T-E | Human | Esophagus | ESCC | 4.26e-12 | 2.61e-01 | 0.1371 |
| 51252 | FAM178B | P54T-E | Human | Esophagus | ESCC | 1.07e-16 | 3.47e-01 | 0.0975 |
| 51252 | FAM178B | P56T-E | Human | Esophagus | ESCC | 5.84e-10 | 1.27e+00 | 0.1613 |
| 51252 | FAM178B | P62T-E | Human | Esophagus | ESCC | 2.29e-08 | 1.95e-01 | 0.1302 |
| 51252 | FAM178B | P74T-E | Human | Esophagus | ESCC | 1.96e-03 | 1.40e-01 | 0.1479 |
| 51252 | FAM178B | P80T-E | Human | Esophagus | ESCC | 1.28e-30 | 7.57e-01 | 0.155 |
| 51252 | FAM178B | P91T-E | Human | Esophagus | ESCC | 2.11e-02 | 3.63e-01 | 0.1828 |
| 51252 | FAM178B | P127T-E | Human | Esophagus | ESCC | 7.76e-04 | 1.12e-01 | 0.0826 |
| 51252 | FAM178B | P130T-E | Human | Esophagus | ESCC | 7.90e-03 | 8.40e-02 | 0.1676 |
| Page: 1 |
| Tissue | Expression Dynamics | Abbreviation |
| Esophagus | 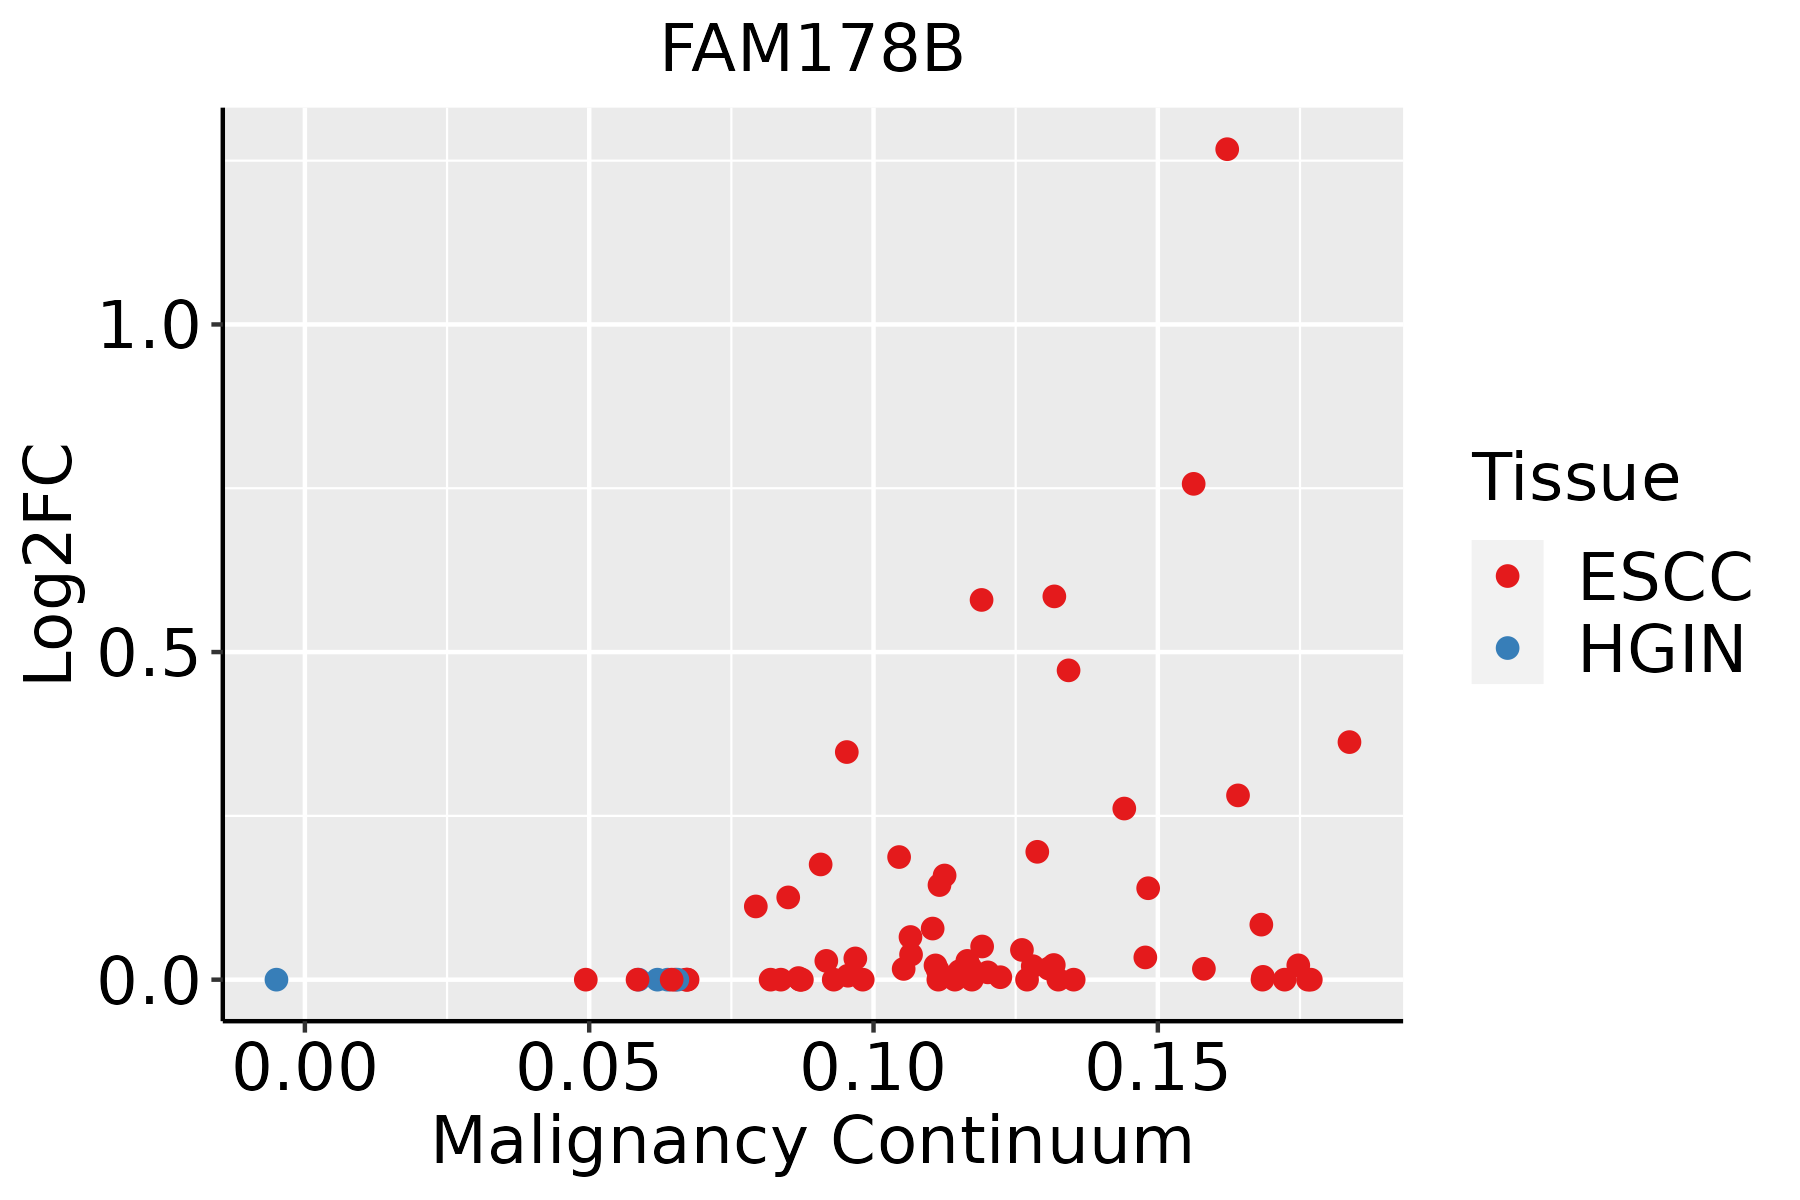 | ESCC: Esophageal squamous cell carcinoma |
| HGIN: High-grade intraepithelial neoplasias | ||
| LGIN: Low-grade intraepithelial neoplasias |
| ∗log2FC in expression of this searched gene in stem-like cells from each diseased tissue sample relative to stem-like cells in normal samples in each tissue plotted against the malignancy continuum. Samples are colored based on if they are from different disease stage. |
Top |
Malignant transformation related pathway analysis |
| Find out the enriched GO biological processes and KEGG pathways involved in transition from healthy to precancer to cancer |
| Tissue | Disease Stage | Enriched GO biological Processes |
| Colorectum | AD |  |
| Colorectum | SER |  |
| Colorectum | MSS |  |
| Colorectum | MSI-H |  |
| Colorectum | FAP |  |
| ∗Top 15 enriched GO BP terms are showed in the bar plot of each disease state in each tissue. Each row represents a significant GO biological process which is colored according to the -log10(p.adjust). |
| Page: 1 2 3 4 5 6 7 8 9 |
| GO ID | Tissue | Disease Stage | Description | Gene Ratio | Bg Ratio | pvalue | p.adjust | Count |
| Page: 1 |
| Pathway ID | Tissue | Disease Stage | Description | Gene Ratio | Bg Ratio | pvalue | p.adjust | qvalue | Count |
| Page: 1 |
Top |
Cell-cell communication analysis |
| Identification of potential cell-cell interactions between two cell types and their ligand-receptor pairs for different disease states |
| Ligand | Receptor | LRpair | Pathway | Tissue | Disease Stage |
| Page: 1 |
Top |
Single-cell gene regulatory network inference analysis |
| Find out the significant the regulons (TFs) and the target genes of each regulon across cell types for different disease states |
| TF | Cell Type | Tissue | Disease Stage | Target Gene | RSS | Regulon Activity |
| ∗The dot plots of a searched regulon are shown for all cell subpopulations in each disease state of each tissue based on the regulon specific score inferred using pySCENIC and by calculating the average expression. |
| Page: 1 |
Top |
Somatic mutation of malignant transformation related genes |
| Annotation of somatic variants for genes involved in malignant transformation |
| Hugo Symbol | Variant Class | Variant Classification | dbSNP RS | HGVSc | HGVSp | HGVSp Short | SWISSPROT | BIOTYPE | SIFT | PolyPhen | Tumor Sample Barcode | Tissue | Histology | Sex | Age | Stage | Therapy Types | Drugs | Outcome |
| FAM178B | SNV | Missense_Mutation | rs556626550 | c.988T>G | p.Phe330Val | p.F330V | Q8IXR5 | protein_coding | deleterious(0) | possibly_damaging(0.492) | TCGA-A2-A1G4-01 | Breast | breast invasive carcinoma | Female | >=65 | III/IV | Chemotherapy | adriamycin | SD |
| FAM178B | SNV | Missense_Mutation | rs556626550 | c.988T>G | p.Phe330Val | p.F330V | Q8IXR5 | protein_coding | deleterious(0) | possibly_damaging(0.492) | TCGA-A7-A26G-01 | Breast | breast invasive carcinoma | Female | <65 | I/II | Chemotherapy | taxotere | SD |
| FAM178B | SNV | Missense_Mutation | rs556626550 | c.988N>G | p.Phe330Val | p.F330V | Q8IXR5 | protein_coding | deleterious(0) | possibly_damaging(0.492) | TCGA-BH-A1FR-01 | Breast | breast invasive carcinoma | Female | >=65 | III/IV | Unknown | Unknown | PD |
| FAM178B | SNV | Missense_Mutation | rs556626550 | c.988N>G | p.Phe330Val | p.F330V | Q8IXR5 | protein_coding | deleterious(0) | possibly_damaging(0.492) | TCGA-C8-A12K-01 | Breast | breast invasive carcinoma | Female | >=65 | I/II | Unknown | Unknown | SD |
| FAM178B | SNV | Missense_Mutation | rs556626550 | c.988N>G | p.Phe330Val | p.F330V | Q8IXR5 | protein_coding | deleterious(0) | possibly_damaging(0.492) | TCGA-D8-A1JK-01 | Breast | breast invasive carcinoma | Female | >=65 | I/II | Unknown | Unknown | SD |
| FAM178B | SNV | Missense_Mutation | rs556626550 | c.988N>G | p.Phe330Val | p.F330V | Q8IXR5 | protein_coding | deleterious(0) | possibly_damaging(0.492) | TCGA-E2-A15K-06 | Breast | breast invasive carcinoma | Female | <65 | I/II | Chemotherapy | adriamycin | SD |
| FAM178B | SNV | Missense_Mutation | rs556626550 | c.988T>G | p.Phe330Val | p.F330V | Q8IXR5 | protein_coding | deleterious(0) | possibly_damaging(0.492) | TCGA-EW-A1J2-01 | Breast | breast invasive carcinoma | Female | <65 | I/II | Chemotherapy | taxotere | SD |
| FAM178B | SNV | Missense_Mutation | c.511N>C | p.Glu171Gln | p.E171Q | Q8IXR5 | protein_coding | deleterious(0.05) | benign(0.033) | TCGA-IR-A3LH-01 | Cervix | cervical & endocervical cancer | Female | <65 | I/II | Chemotherapy | cisplatin | CR | |
| FAM178B | SNV | Missense_Mutation | novel | c.1207G>A | p.Glu403Lys | p.E403K | Q8IXR5 | protein_coding | tolerated(0.21) | benign(0.007) | TCGA-VS-A9UC-01 | Cervix | cervical & endocervical cancer | Female | <65 | I/II | Chemotherapy | cisplatin | SD |
| FAM178B | SNV | Missense_Mutation | c.1889N>A | p.Arg630His | p.R630H | Q8IXR5 | protein_coding | deleterious(0.04) | possibly_damaging(0.889) | TCGA-A6-5661-01 | Colorectum | colon adenocarcinoma | Female | >=65 | I/II | Unknown | Unknown | SD |
| Page: 1 2 3 4 5 6 |
Top |
Related drugs of malignant transformation related genes |
| Identification of chemicals and drugs interact with genes involved in malignant transfromation |
| (DGIdb 4.0) |
| Entrez ID | Symbol | Category | Interaction Types | Drug Claim Name | Drug Name | PMIDs |
| 51252 | FAM178B | NA | lithium | LITHIUM | 29121268 |
| Page: 1 |

Copyright 2023-Present -The University of Texas Health Science Center at Houston |