
|
|||||
|
 | |
| |
| |
| |
| |
| |
|
Gene: FAM177A1 |
Gene summary for FAM177A1 |
| Gene information | Species | Human | Gene symbol | FAM177A1 | Gene ID | 283635 |
| Gene name | family with sequence similarity 177 member A1 | |
| Gene Alias | C14orf24 | |
| Cytomap | 14q13.2 | |
| Gene Type | protein-coding | GO ID | NA | UniProtAcc | Q8N128 |
Top |
Malignant transformation analysis |
| Identification of the aberrant gene expression in precancerous and cancerous lesions by comparing the gene expression of stem-like cells in diseased tissues with normal stem cells |
| Entrez ID | Symbol | Replicates | Species | Organ | Tissue | Adj P-value | Log2FC | Malignancy |
| 283635 | FAM177A1 | HTA11_1938_2000001011 | Human | Colorectum | AD | 2.69e-02 | 4.42e-01 | -0.0811 |
| 283635 | FAM177A1 | HTA11_347_2000001011 | Human | Colorectum | AD | 2.17e-19 | 7.99e-01 | -0.1954 |
| 283635 | FAM177A1 | HTA11_1391_2000001011 | Human | Colorectum | AD | 8.09e-04 | 5.19e-01 | -0.059 |
| 283635 | FAM177A1 | HTA11_99999974143_84620 | Human | Colorectum | MSS | 8.70e-03 | -3.16e-01 | 0.3005 |
| 283635 | FAM177A1 | A001-C-207 | Human | Colorectum | FAP | 1.19e-06 | -3.51e-01 | 0.1278 |
| 283635 | FAM177A1 | A015-C-203 | Human | Colorectum | FAP | 1.90e-23 | -1.90e-01 | -0.1294 |
| 283635 | FAM177A1 | A015-C-204 | Human | Colorectum | FAP | 4.97e-04 | -1.53e-01 | -0.0228 |
| 283635 | FAM177A1 | A014-C-040 | Human | Colorectum | FAP | 6.95e-03 | -2.12e-01 | -0.1184 |
| 283635 | FAM177A1 | A002-C-201 | Human | Colorectum | FAP | 1.38e-12 | -3.41e-01 | 0.0324 |
| 283635 | FAM177A1 | A002-C-203 | Human | Colorectum | FAP | 1.63e-03 | -1.37e-01 | 0.2786 |
| 283635 | FAM177A1 | A001-C-119 | Human | Colorectum | FAP | 5.89e-06 | -3.19e-01 | -0.1557 |
| 283635 | FAM177A1 | A001-C-108 | Human | Colorectum | FAP | 1.63e-13 | -1.45e-01 | -0.0272 |
| 283635 | FAM177A1 | A002-C-205 | Human | Colorectum | FAP | 2.04e-20 | -3.78e-01 | -0.1236 |
| 283635 | FAM177A1 | A001-C-104 | Human | Colorectum | FAP | 2.38e-02 | -3.91e-02 | 0.0184 |
| 283635 | FAM177A1 | A015-C-005 | Human | Colorectum | FAP | 3.67e-08 | -3.64e-01 | -0.0336 |
| 283635 | FAM177A1 | A015-C-006 | Human | Colorectum | FAP | 3.18e-15 | -4.50e-01 | -0.0994 |
| 283635 | FAM177A1 | A015-C-106 | Human | Colorectum | FAP | 9.66e-10 | -1.81e-01 | -0.0511 |
| 283635 | FAM177A1 | A002-C-114 | Human | Colorectum | FAP | 8.74e-16 | -3.14e-01 | -0.1561 |
| 283635 | FAM177A1 | A015-C-104 | Human | Colorectum | FAP | 6.51e-26 | -2.67e-01 | -0.1899 |
| 283635 | FAM177A1 | A001-C-014 | Human | Colorectum | FAP | 3.69e-12 | -2.29e-01 | 0.0135 |
| Page: 1 2 3 4 5 6 7 8 9 10 |
| Tissue | Expression Dynamics | Abbreviation |
| Colorectum (GSE201348) |  | FAP: Familial adenomatous polyposis |
| CRC: Colorectal cancer | ||
| Colorectum (HTA11) |  | AD: Adenomas |
| SER: Sessile serrated lesions | ||
| MSI-H: Microsatellite-high colorectal cancer | ||
| MSS: Microsatellite stable colorectal cancer | ||
| Esophagus | 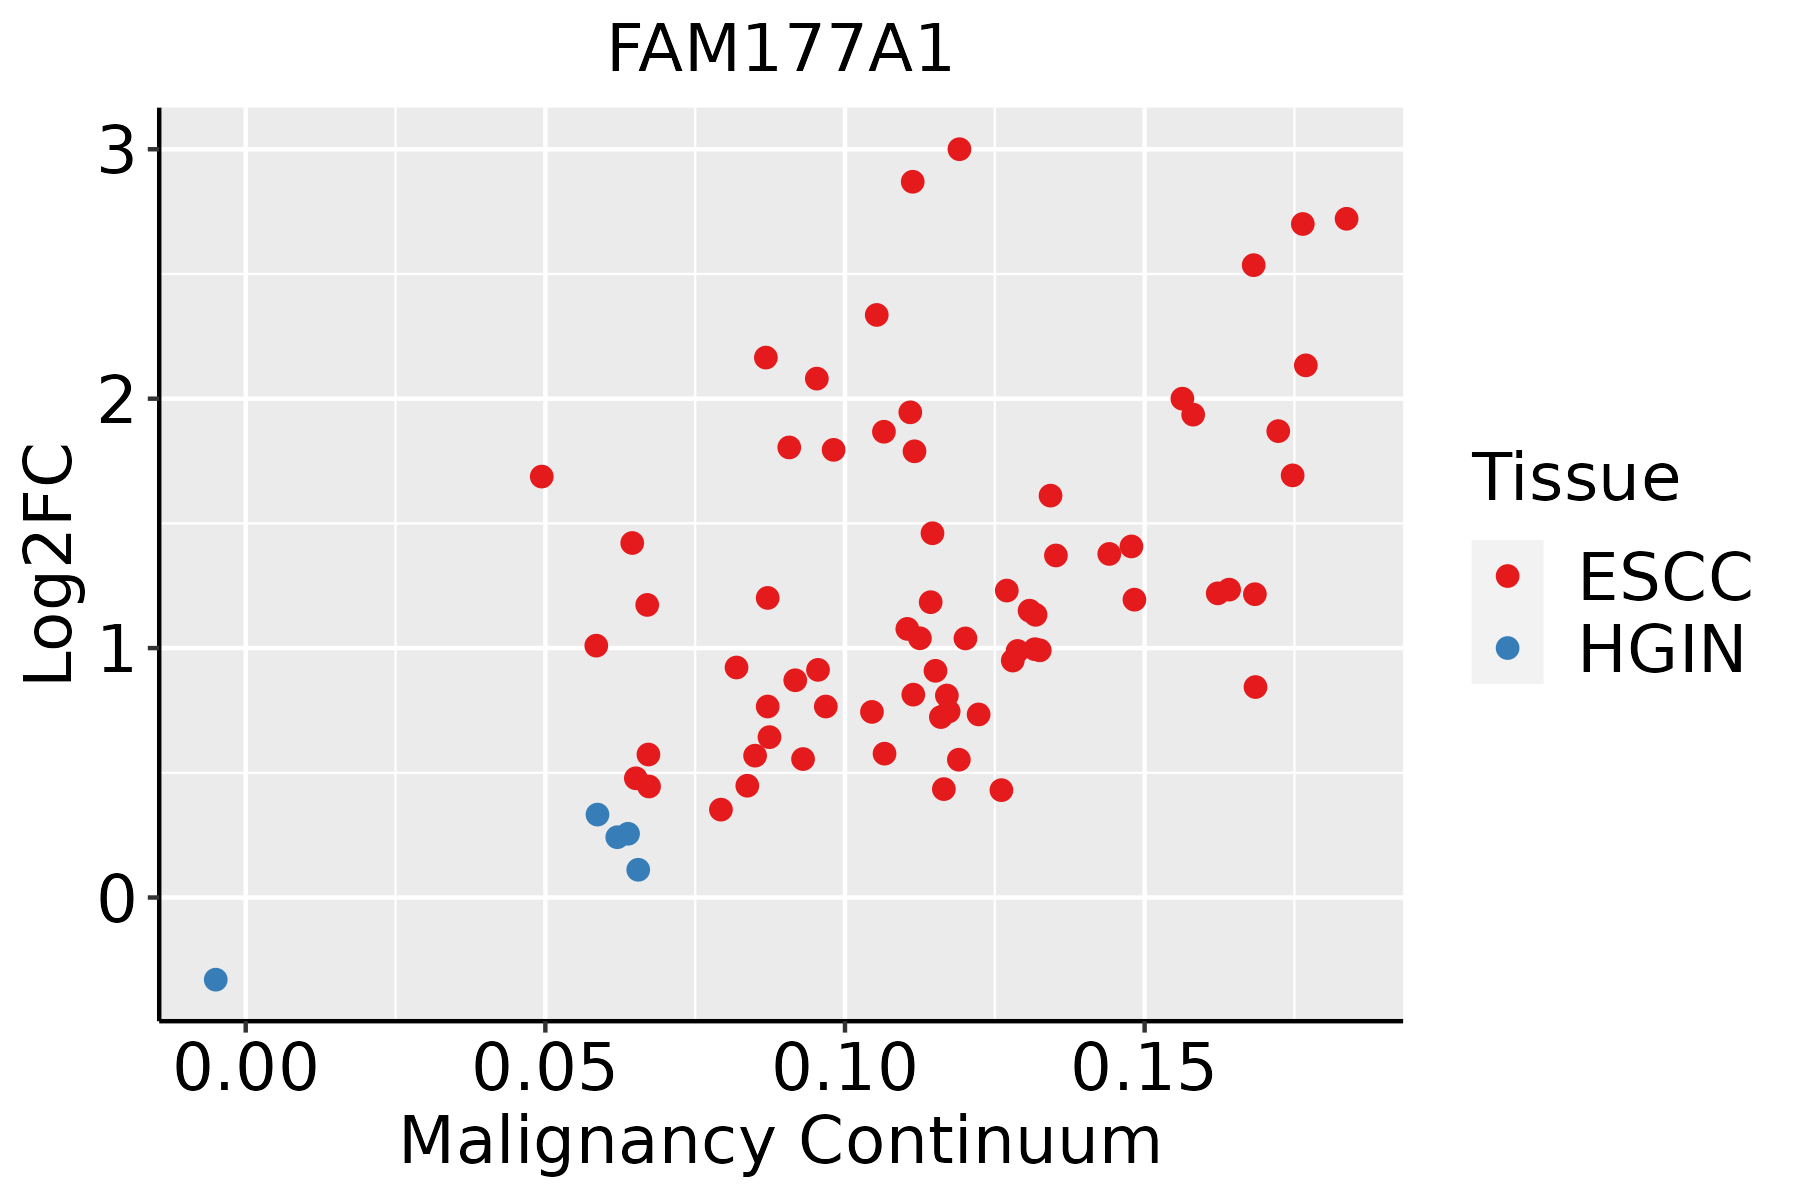 | ESCC: Esophageal squamous cell carcinoma |
| HGIN: High-grade intraepithelial neoplasias | ||
| LGIN: Low-grade intraepithelial neoplasias | ||
| Liver | 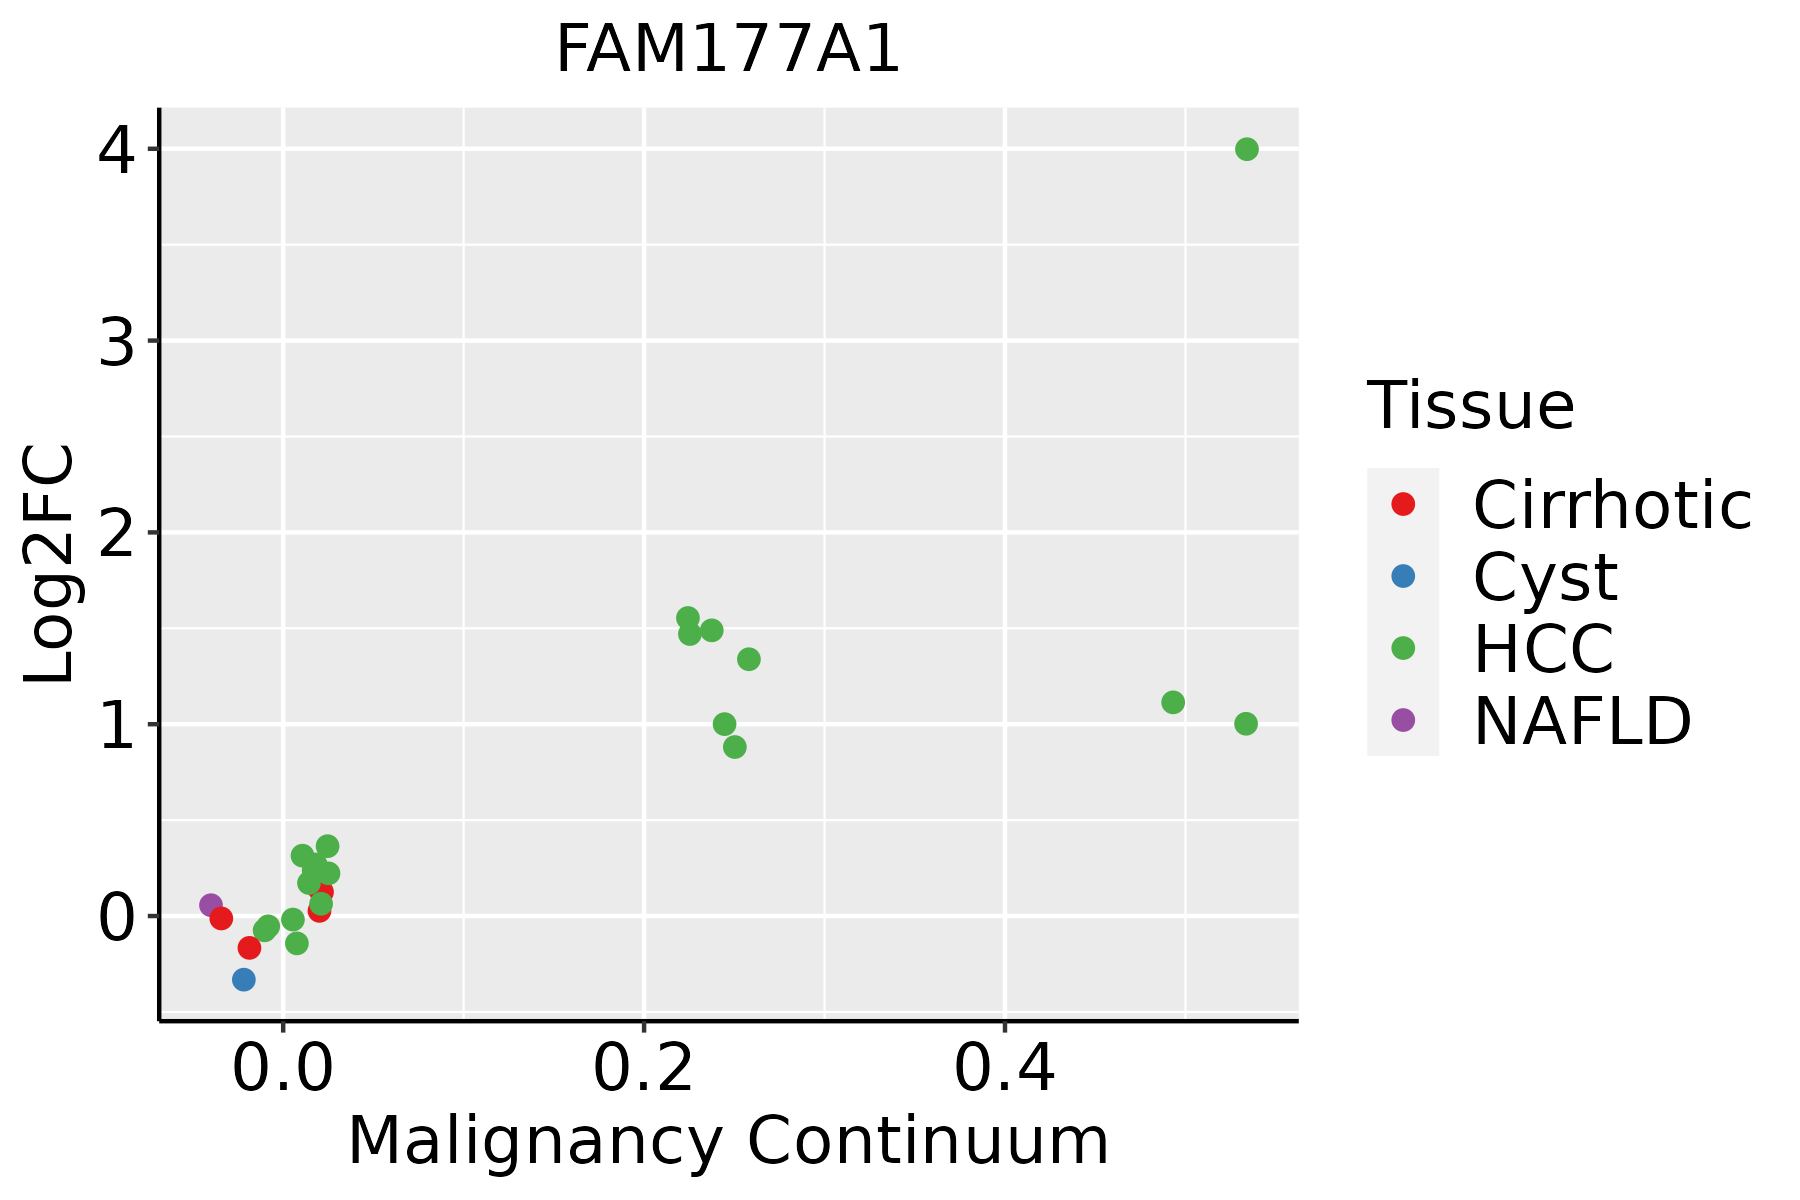 | HCC: Hepatocellular carcinoma |
| NAFLD: Non-alcoholic fatty liver disease | ||
| Lung | 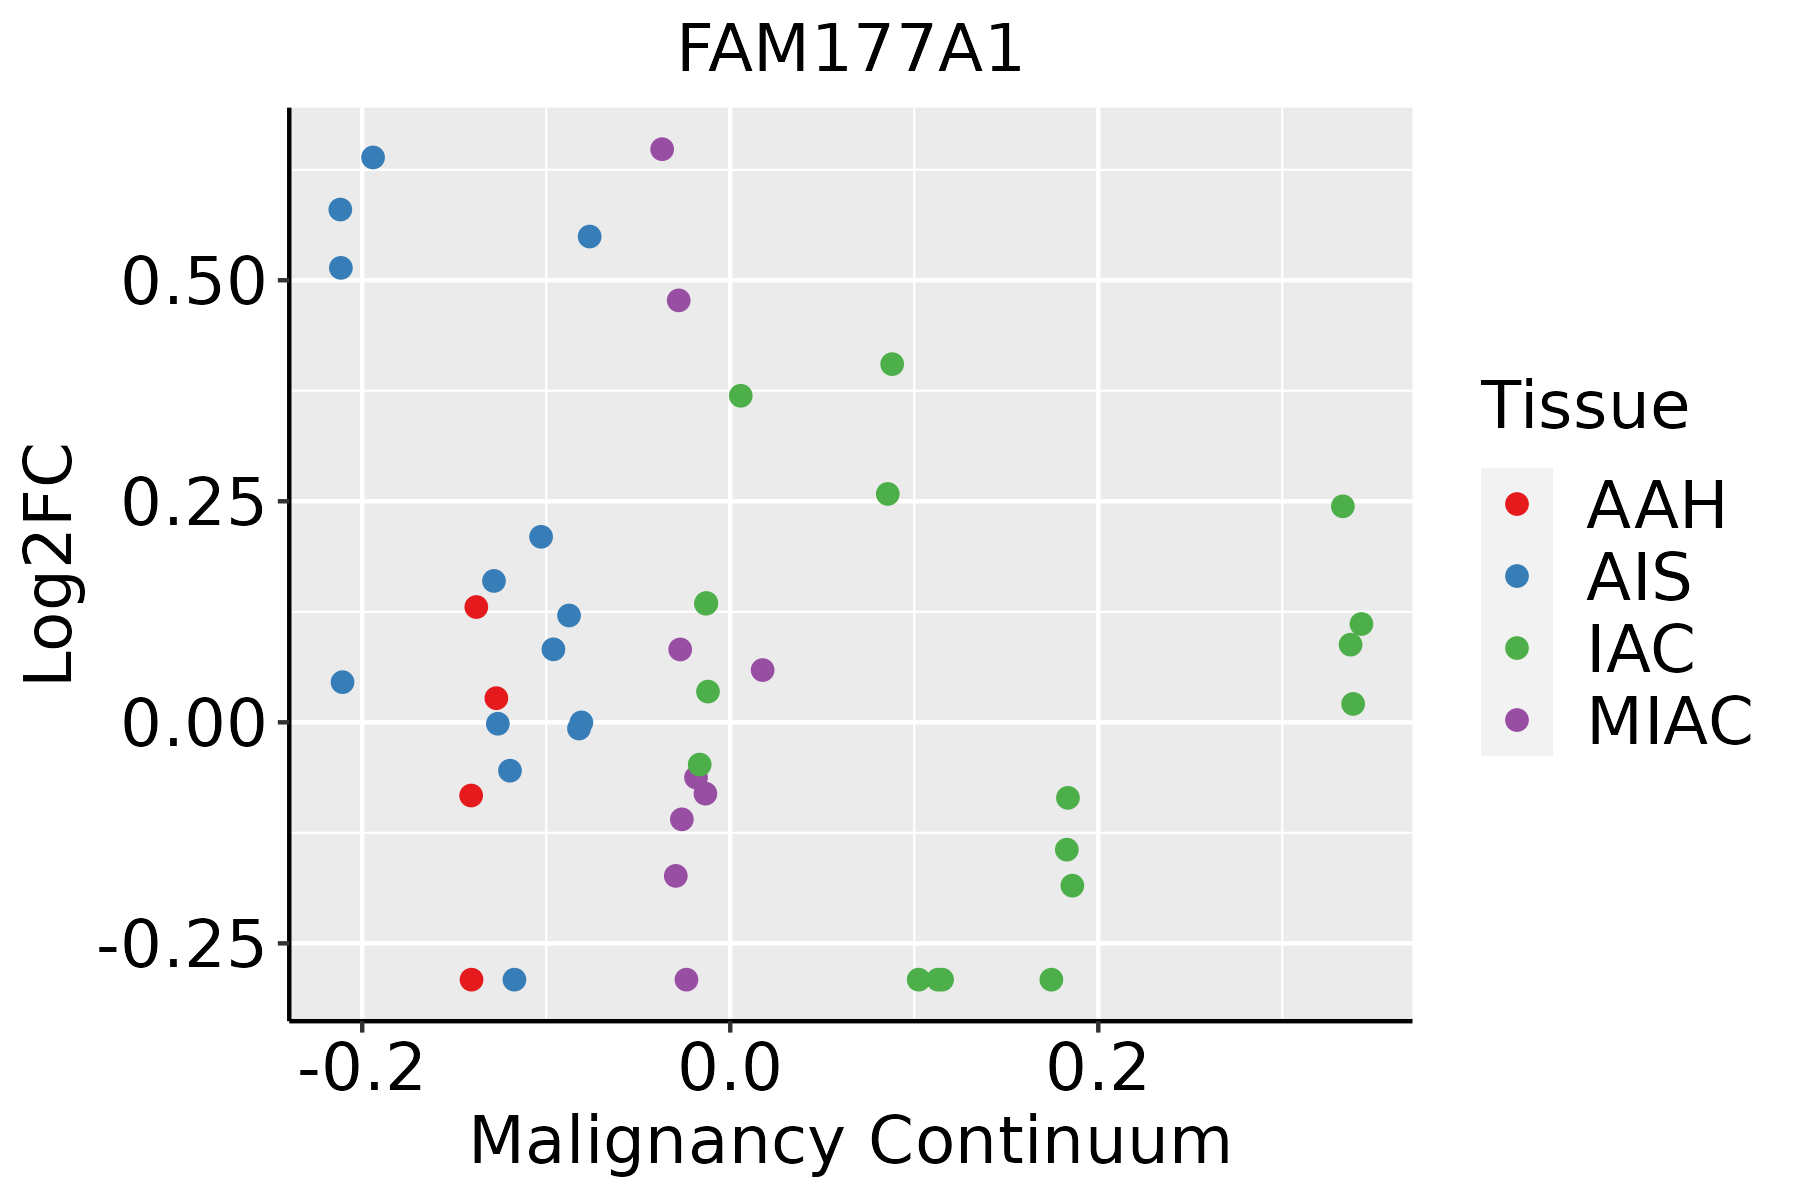 | AAH: Atypical adenomatous hyperplasia |
| AIS: Adenocarcinoma in situ | ||
| IAC: Invasive lung adenocarcinoma | ||
| MIA: Minimally invasive adenocarcinoma | ||
| Oral Cavity |  | EOLP: Erosive Oral lichen planus |
| LP: leukoplakia | ||
| NEOLP: Non-erosive oral lichen planus | ||
| OSCC: Oral squamous cell carcinoma | ||
| Prostate | 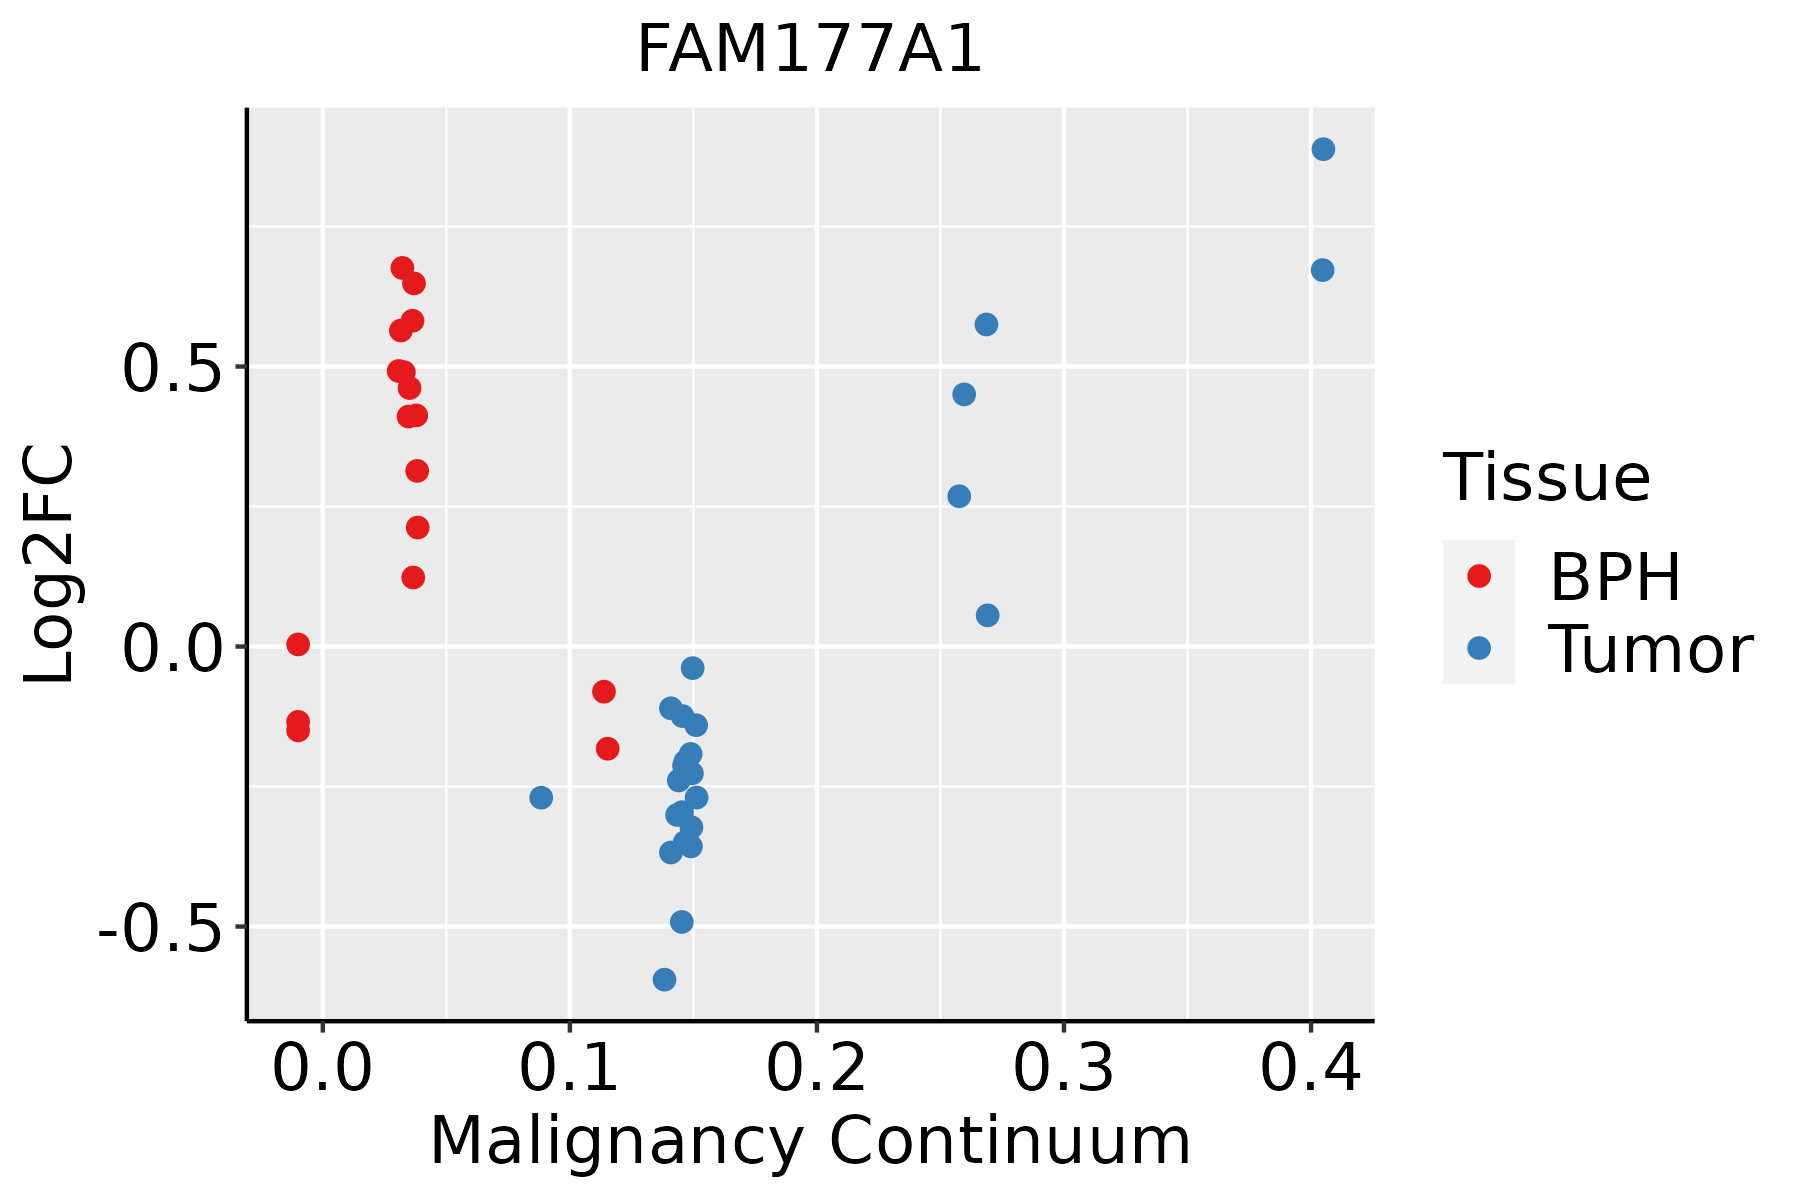 | BPH: Benign Prostatic Hyperplasia |
| Skin | 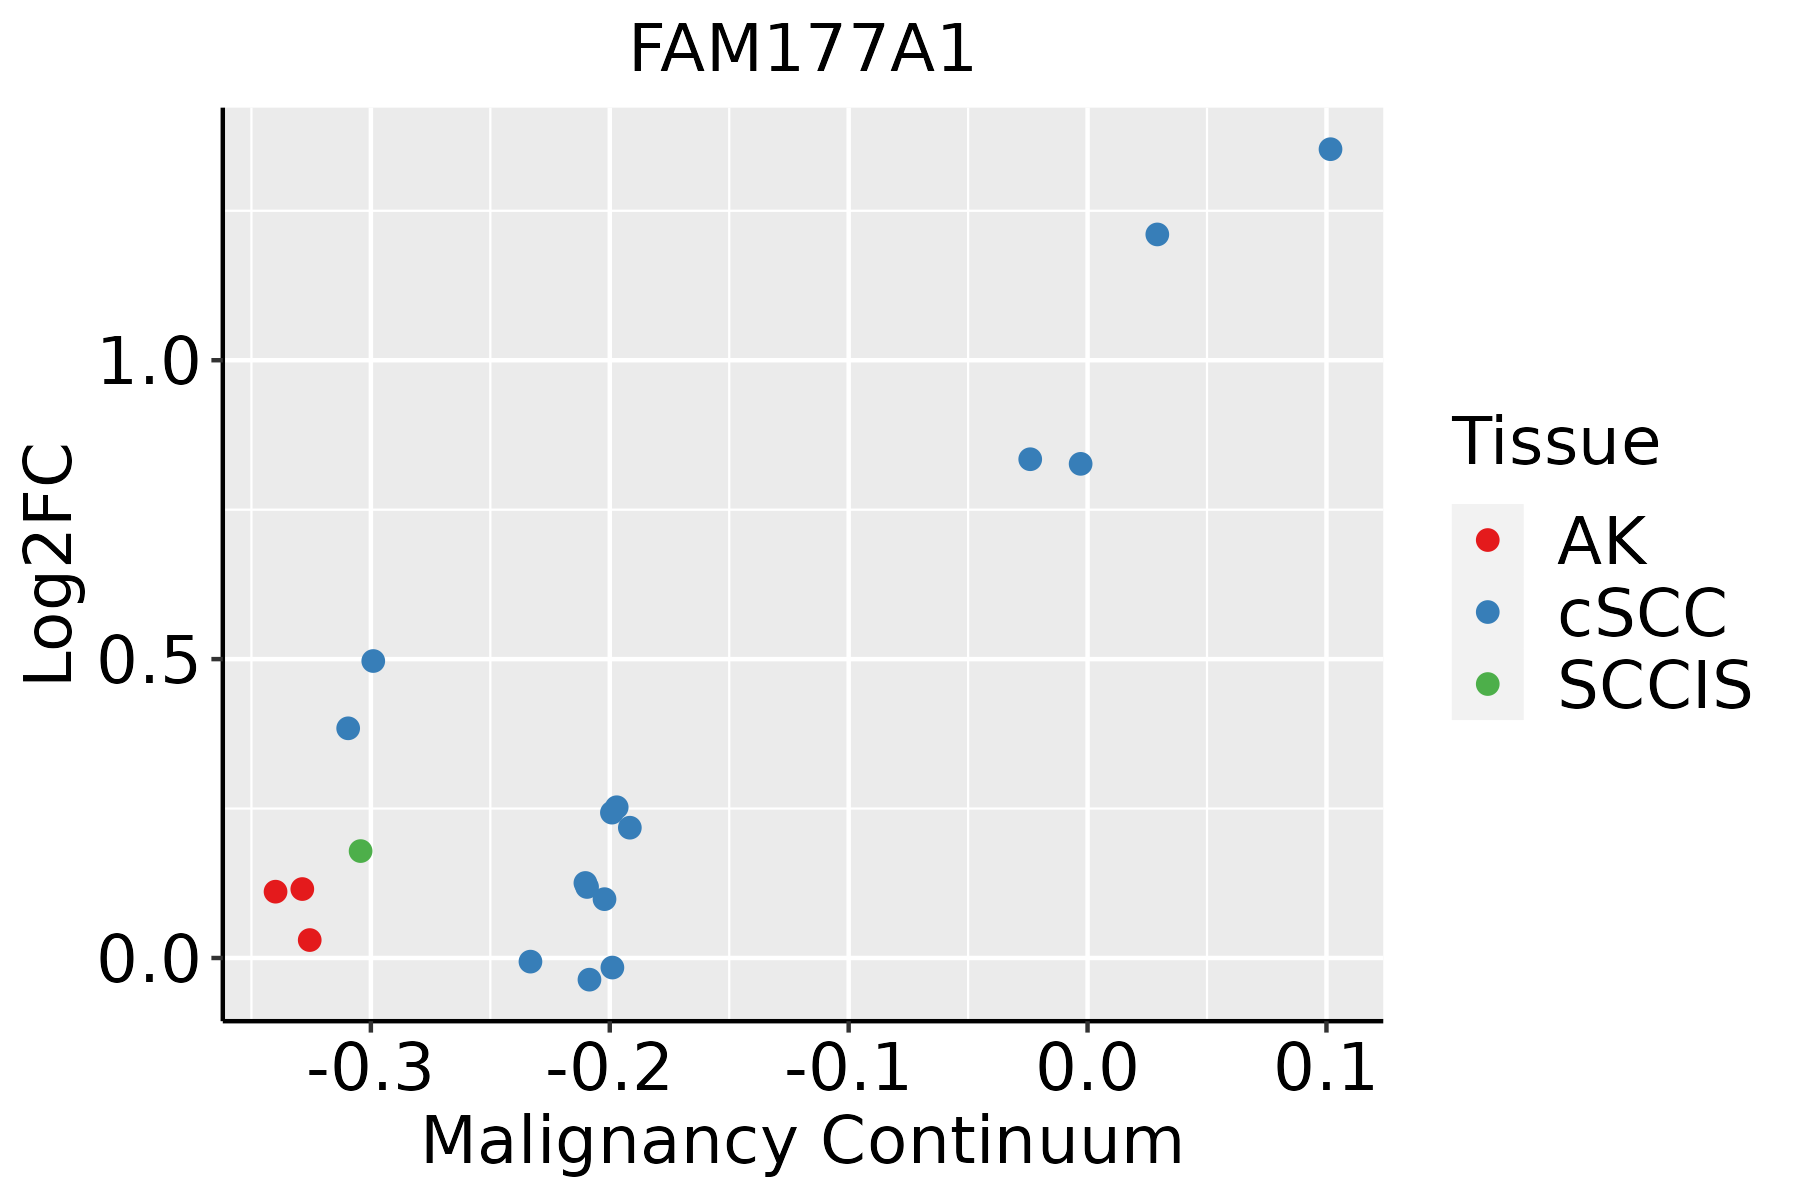 | AK: Actinic keratosis |
| cSCC: Cutaneous squamous cell carcinoma | ||
| SCCIS:squamous cell carcinoma in situ | ||
| Thyroid | 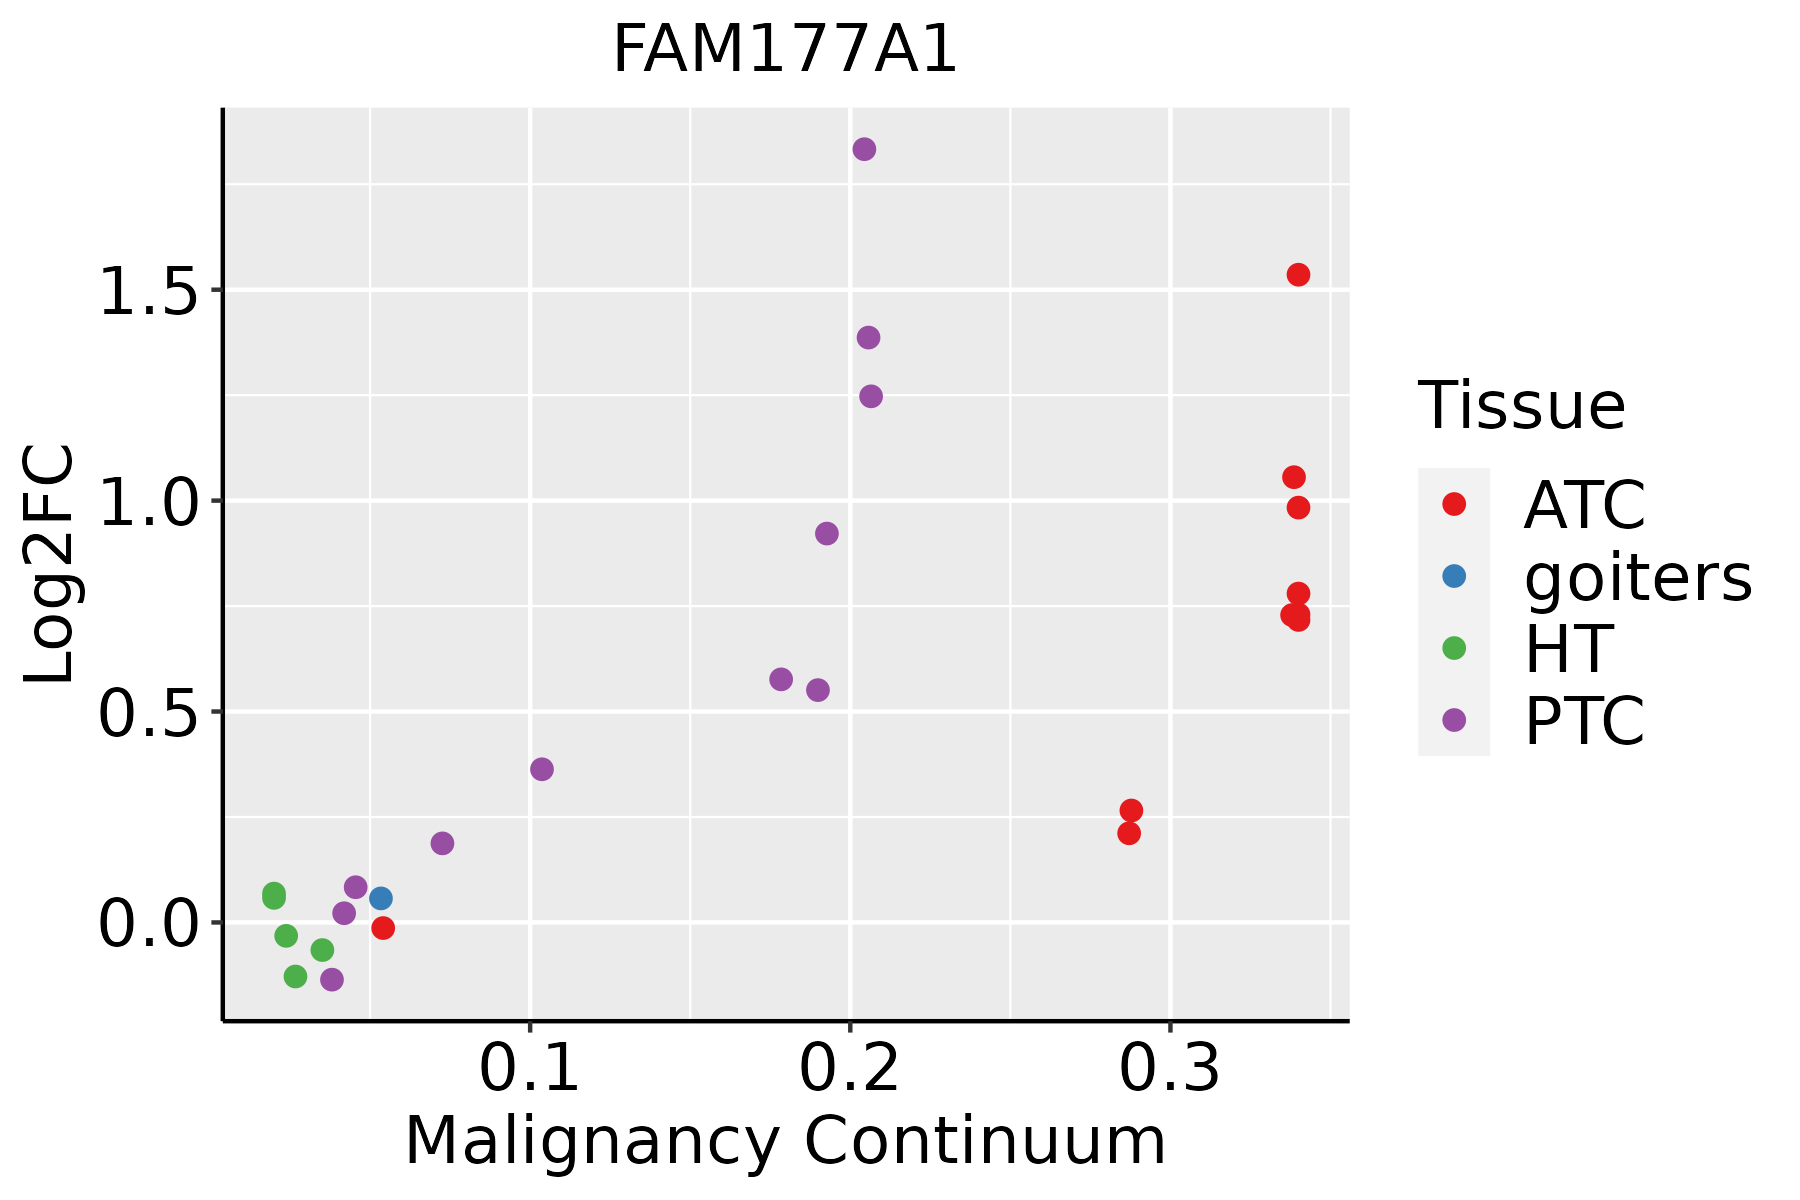 | ATC: Anaplastic thyroid cancer |
| HT: Hashimoto's thyroiditis | ||
| PTC: Papillary thyroid cancer |
| ∗log2FC in expression of this searched gene in stem-like cells from each diseased tissue sample relative to stem-like cells in normal samples in each tissue plotted against the malignancy continuum. Samples are colored based on if they are from different disease stage. |
Top |
Malignant transformation related pathway analysis |
| Find out the enriched GO biological processes and KEGG pathways involved in transition from healthy to precancer to cancer |
| Tissue | Disease Stage | Enriched GO biological Processes |
| Colorectum | AD |  |
| Colorectum | SER |  |
| Colorectum | MSS |  |
| Colorectum | MSI-H |  |
| Colorectum | FAP |  |
| ∗Top 15 enriched GO BP terms are showed in the bar plot of each disease state in each tissue. Each row represents a significant GO biological process which is colored according to the -log10(p.adjust). |
| Page: 1 2 3 4 5 6 7 8 9 |
| GO ID | Tissue | Disease Stage | Description | Gene Ratio | Bg Ratio | pvalue | p.adjust | Count |
| Page: 1 |
| Pathway ID | Tissue | Disease Stage | Description | Gene Ratio | Bg Ratio | pvalue | p.adjust | qvalue | Count |
| Page: 1 |
Top |
Cell-cell communication analysis |
| Identification of potential cell-cell interactions between two cell types and their ligand-receptor pairs for different disease states |
| Ligand | Receptor | LRpair | Pathway | Tissue | Disease Stage |
| Page: 1 |
Top |
Single-cell gene regulatory network inference analysis |
| Find out the significant the regulons (TFs) and the target genes of each regulon across cell types for different disease states |
| TF | Cell Type | Tissue | Disease Stage | Target Gene | RSS | Regulon Activity |
| ∗The dot plots of a searched regulon are shown for all cell subpopulations in each disease state of each tissue based on the regulon specific score inferred using pySCENIC and by calculating the average expression. |
| Page: 1 |
Top |
Somatic mutation of malignant transformation related genes |
| Annotation of somatic variants for genes involved in malignant transformation |
| Hugo Symbol | Variant Class | Variant Classification | dbSNP RS | HGVSc | HGVSp | HGVSp Short | SWISSPROT | BIOTYPE | SIFT | PolyPhen | Tumor Sample Barcode | Tissue | Histology | Sex | Age | Stage | Therapy Types | Drugs | Outcome |
| FAM177A1 | SNV | Missense_Mutation | c.437N>G | p.Ser146Cys | p.S146C | Q8N128 | protein_coding | deleterious(0.01) | probably_damaging(0.999) | TCGA-Q1-A73O-01 | Cervix | cervical & endocervical cancer | Female | <65 | I/II | Chemotherapy | cisplatin | CR | |
| FAM177A1 | SNV | Missense_Mutation | novel | c.268N>A | p.Glu90Lys | p.E90K | Q8N128 | protein_coding | deleterious(0) | possibly_damaging(0.636) | TCGA-VS-A9U6-01 | Cervix | cervical & endocervical cancer | Female | <65 | I/II | Chemotherapy | cisplatin | PD |
| FAM177A1 | SNV | Missense_Mutation | c.304C>A | p.Leu102Met | p.L102M | Q8N128 | protein_coding | tolerated(0.12) | possibly_damaging(0.66) | TCGA-AA-3710-01 | Colorectum | colon adenocarcinoma | Female | >=65 | I/II | Unknown | Unknown | SD | |
| FAM177A1 | SNV | Missense_Mutation | rs773329224 | c.175N>A | p.Glu59Lys | p.E59K | Q8N128 | protein_coding | tolerated(0.06) | benign(0.014) | TCGA-WS-AB45-01 | Colorectum | colon adenocarcinoma | Female | <65 | I/II | Unknown | Unknown | SD |
| FAM177A1 | SNV | Missense_Mutation | novel | c.700N>A | p.Val234Ile | p.V234I | Q8N128 | protein_coding | tolerated(0.24) | possibly_damaging(0.825) | TCGA-A5-A2K3-01 | Endometrium | uterine corpus endometrioid carcinoma | Female | >=65 | I/II | Chemotherapy | carboplatin | SD |
| FAM177A1 | SNV | Missense_Mutation | novel | c.62N>T | p.Ala21Val | p.A21V | Q8N128 | protein_coding | deleterious_low_confidence(0.01) | benign(0.099) | TCGA-A5-A7WJ-01 | Endometrium | uterine corpus endometrioid carcinoma | Female | <65 | I/II | Unknown | Unknown | SD |
| FAM177A1 | SNV | Missense_Mutation | novel | c.671N>G | p.Ile224Ser | p.I224S | Q8N128 | protein_coding | tolerated(0.21) | benign(0.005) | TCGA-AX-A2HC-01 | Endometrium | uterine corpus endometrioid carcinoma | Female | <65 | III/IV | Chemotherapy | paclitaxel | PD |
| FAM177A1 | SNV | Missense_Mutation | c.626N>T | p.Ser209Leu | p.S209L | Q8N128 | protein_coding | deleterious(0) | possibly_damaging(0.843) | TCGA-B5-A11R-01 | Endometrium | uterine corpus endometrioid carcinoma | Female | <65 | I/II | Chemotherapy | paclitaxel | SD | |
| FAM177A1 | SNV | Missense_Mutation | rs773329224 | c.175N>A | p.Glu59Lys | p.E59K | Q8N128 | protein_coding | tolerated(0.06) | benign(0.014) | TCGA-B5-A3FA-01 | Endometrium | uterine corpus endometrioid carcinoma | Female | >=65 | I/II | Unknown | Unknown | SD |
| FAM177A1 | SNV | Missense_Mutation | rs777218565 | c.382C>T | p.Arg128Trp | p.R128W | Q8N128 | protein_coding | deleterious(0) | probably_damaging(0.997) | TCGA-BG-A222-01 | Endometrium | uterine corpus endometrioid carcinoma | Female | <65 | I/II | Unknown | Unknown | SD |
| Page: 1 2 |
Top |
Related drugs of malignant transformation related genes |
| Identification of chemicals and drugs interact with genes involved in malignant transfromation |
| (DGIdb 4.0) |
| Entrez ID | Symbol | Category | Interaction Types | Drug Claim Name | Drug Name | PMIDs |
| 283635 | FAM177A1 | NA | lithium | LITHIUM | 29121268 |
| Page: 1 |

Copyright 2023-Present -The University of Texas Health Science Center at Houston |