
|
|||||
|
 | |
| |
| |
| |
| |
| |
|
Gene: FAM174B |
Gene summary for FAM174B |
| Gene information | Species | Human | Gene symbol | FAM174B | Gene ID | 400451 |
| Gene name | family with sequence similarity 174 member B | |
| Gene Alias | FAM174B | |
| Cytomap | 15q26.1 | |
| Gene Type | protein-coding | GO ID | GO:0006996 | UniProtAcc | Q3ZCQ3 |
Top |
Malignant transformation analysis |
| Identification of the aberrant gene expression in precancerous and cancerous lesions by comparing the gene expression of stem-like cells in diseased tissues with normal stem cells |
| Entrez ID | Symbol | Replicates | Species | Organ | Tissue | Adj P-value | Log2FC | Malignancy |
| 400451 | FAM174B | LZE24T | Human | Esophagus | ESCC | 1.25e-07 | 1.94e-01 | 0.0596 |
| 400451 | FAM174B | P1T-E | Human | Esophagus | ESCC | 1.50e-02 | 1.77e-01 | 0.0875 |
| 400451 | FAM174B | P2T-E | Human | Esophagus | ESCC | 5.02e-07 | 6.09e-02 | 0.1177 |
| 400451 | FAM174B | P4T-E | Human | Esophagus | ESCC | 2.48e-08 | 2.09e-01 | 0.1323 |
| 400451 | FAM174B | P8T-E | Human | Esophagus | ESCC | 1.03e-33 | 6.23e-01 | 0.0889 |
| 400451 | FAM174B | P10T-E | Human | Esophagus | ESCC | 1.31e-16 | 2.50e-01 | 0.116 |
| 400451 | FAM174B | P12T-E | Human | Esophagus | ESCC | 7.50e-12 | 1.92e-01 | 0.1122 |
| 400451 | FAM174B | P15T-E | Human | Esophagus | ESCC | 2.00e-06 | 1.01e-01 | 0.1149 |
| 400451 | FAM174B | P16T-E | Human | Esophagus | ESCC | 4.71e-03 | 1.07e-01 | 0.1153 |
| 400451 | FAM174B | P22T-E | Human | Esophagus | ESCC | 2.72e-05 | 7.38e-02 | 0.1236 |
| 400451 | FAM174B | P23T-E | Human | Esophagus | ESCC | 2.23e-06 | 1.47e-01 | 0.108 |
| 400451 | FAM174B | P27T-E | Human | Esophagus | ESCC | 7.15e-11 | 1.22e-01 | 0.1055 |
| 400451 | FAM174B | P47T-E | Human | Esophagus | ESCC | 1.52e-04 | 6.07e-02 | 0.1067 |
| 400451 | FAM174B | P48T-E | Human | Esophagus | ESCC | 3.46e-03 | 2.21e-02 | 0.0959 |
| 400451 | FAM174B | P52T-E | Human | Esophagus | ESCC | 1.05e-02 | 8.61e-04 | 0.1555 |
| 400451 | FAM174B | P57T-E | Human | Esophagus | ESCC | 3.47e-17 | 2.35e-01 | 0.0926 |
| 400451 | FAM174B | P61T-E | Human | Esophagus | ESCC | 2.16e-08 | 2.25e-01 | 0.099 |
| 400451 | FAM174B | P65T-E | Human | Esophagus | ESCC | 9.28e-07 | 2.05e-01 | 0.0978 |
| 400451 | FAM174B | P75T-E | Human | Esophagus | ESCC | 7.61e-13 | 3.74e-01 | 0.1125 |
| 400451 | FAM174B | P76T-E | Human | Esophagus | ESCC | 9.45e-15 | 1.31e-01 | 0.1207 |
| Page: 1 2 |
| Tissue | Expression Dynamics | Abbreviation |
| Lung | 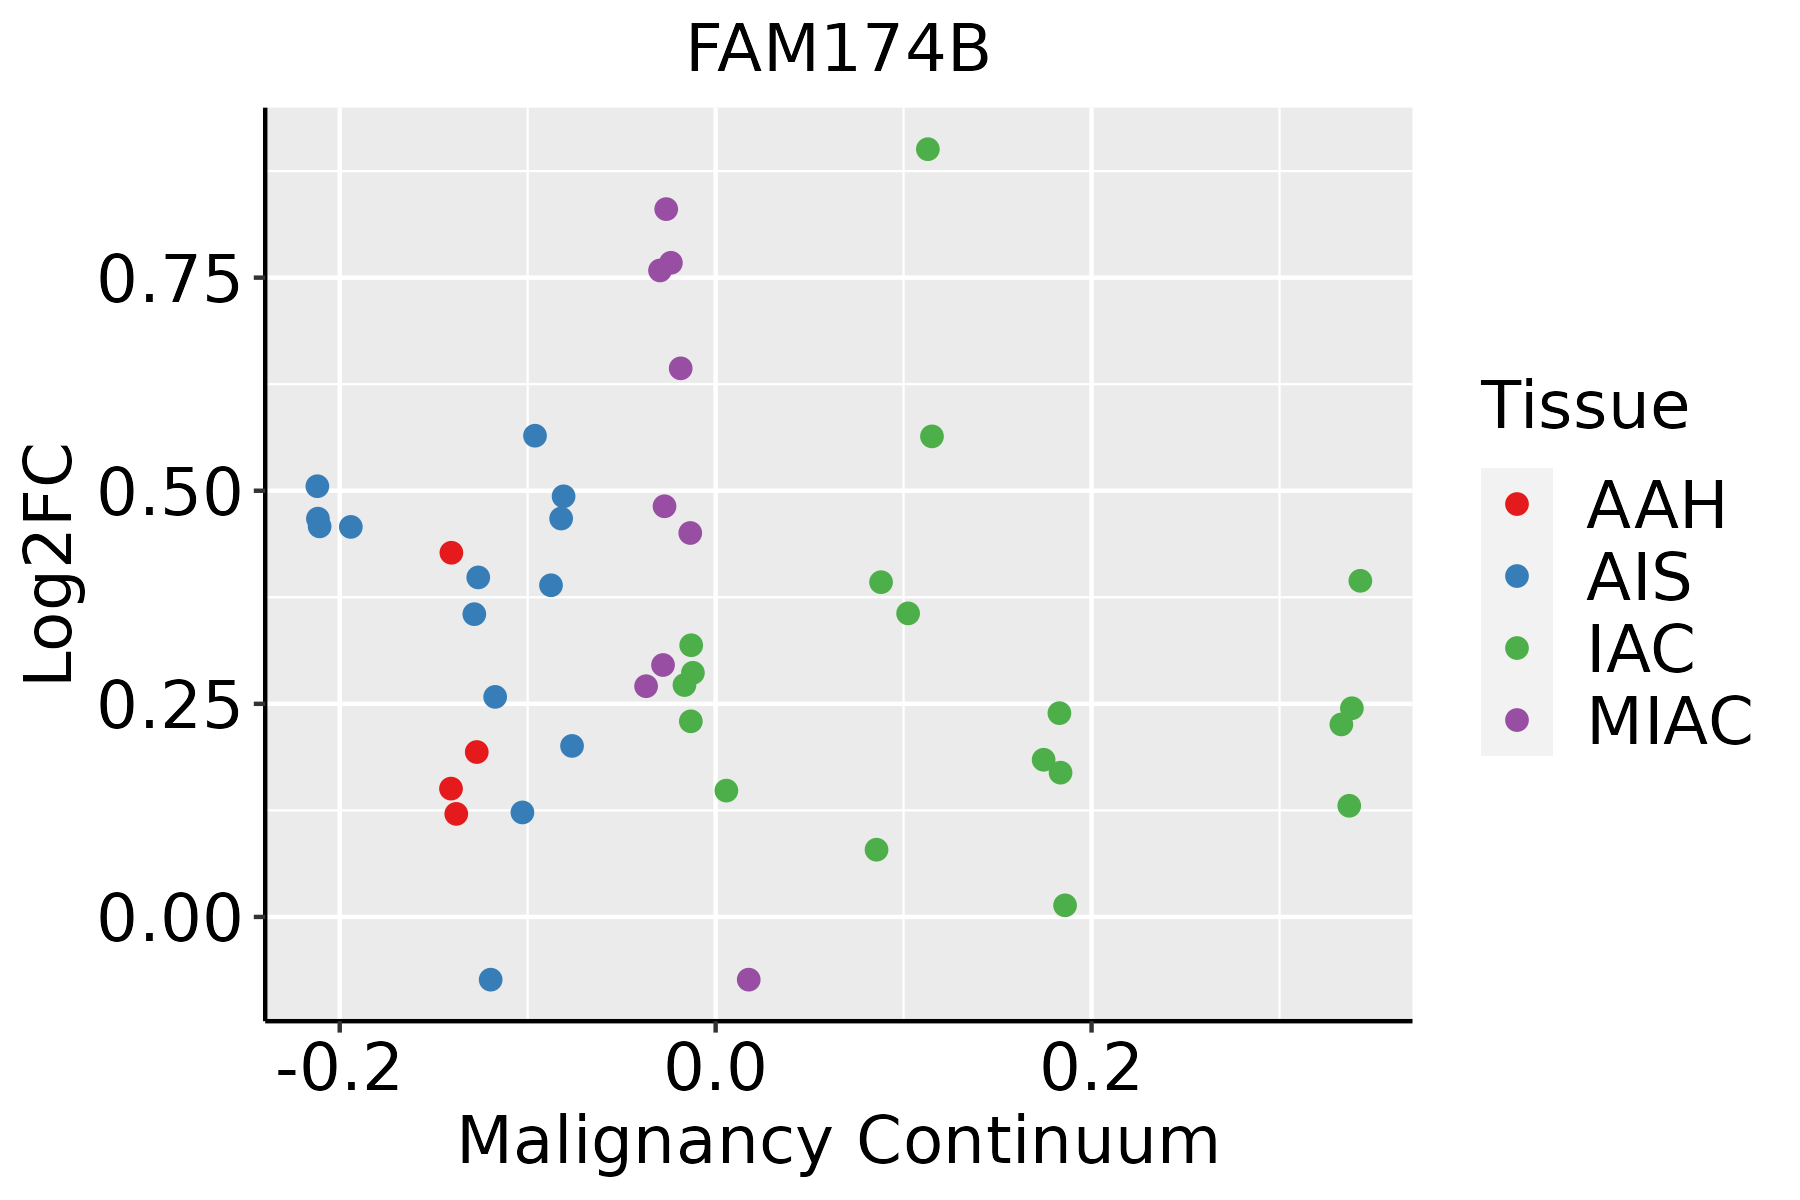 | AAH: Atypical adenomatous hyperplasia |
| AIS: Adenocarcinoma in situ | ||
| IAC: Invasive lung adenocarcinoma | ||
| MIA: Minimally invasive adenocarcinoma | ||
| Prostate |  | BPH: Benign Prostatic Hyperplasia |
| ∗log2FC in expression of this searched gene in stem-like cells from each diseased tissue sample relative to stem-like cells in normal samples in each tissue plotted against the malignancy continuum. Samples are colored based on if they are from different disease stage. |
Top |
Malignant transformation related pathway analysis |
| Find out the enriched GO biological processes and KEGG pathways involved in transition from healthy to precancer to cancer |
| Tissue | Disease Stage | Enriched GO biological Processes |
| Colorectum | AD |  |
| Colorectum | SER |  |
| Colorectum | MSS |  |
| Colorectum | MSI-H |  |
| Colorectum | FAP |  |
| ∗Top 15 enriched GO BP terms are showed in the bar plot of each disease state in each tissue. Each row represents a significant GO biological process which is colored according to the -log10(p.adjust). |
| Page: 1 2 3 4 5 6 7 8 9 |
| GO ID | Tissue | Disease Stage | Description | Gene Ratio | Bg Ratio | pvalue | p.adjust | Count |
| GO:00070303 | Lung | IAC | Golgi organization | 32/2061 | 157/18723 | 4.13e-04 | 6.22e-03 | 32 |
| GO:000703011 | Lung | AIS | Golgi organization | 30/1849 | 157/18723 | 3.09e-04 | 5.63e-03 | 30 |
| GO:000703021 | Lung | MIAC | Golgi organization | 18/967 | 157/18723 | 1.27e-03 | 2.37e-02 | 18 |
| GO:00070306 | Prostate | BPH | Golgi organization | 39/3107 | 157/18723 | 5.20e-03 | 2.43e-02 | 39 |
| GO:000703013 | Prostate | Tumor | Golgi organization | 40/3246 | 157/18723 | 6.33e-03 | 2.90e-02 | 40 |
| Page: 1 |
| Pathway ID | Tissue | Disease Stage | Description | Gene Ratio | Bg Ratio | pvalue | p.adjust | qvalue | Count |
| Page: 1 |
Top |
Cell-cell communication analysis |
| Identification of potential cell-cell interactions between two cell types and their ligand-receptor pairs for different disease states |
| Ligand | Receptor | LRpair | Pathway | Tissue | Disease Stage |
| Page: 1 |
Top |
Single-cell gene regulatory network inference analysis |
| Find out the significant the regulons (TFs) and the target genes of each regulon across cell types for different disease states |
| TF | Cell Type | Tissue | Disease Stage | Target Gene | RSS | Regulon Activity |
| ∗The dot plots of a searched regulon are shown for all cell subpopulations in each disease state of each tissue based on the regulon specific score inferred using pySCENIC and by calculating the average expression. |
| Page: 1 |
Top |
Somatic mutation of malignant transformation related genes |
| Annotation of somatic variants for genes involved in malignant transformation |
| Hugo Symbol | Variant Class | Variant Classification | dbSNP RS | HGVSc | HGVSp | HGVSp Short | SWISSPROT | BIOTYPE | SIFT | PolyPhen | Tumor Sample Barcode | Tissue | Histology | Sex | Age | Stage | Therapy Types | Drugs | Outcome |
| FAM174B | SNV | Missense_Mutation | c.397N>A | p.Ala133Thr | p.A133T | Q3ZCQ3 | protein_coding | deleterious(0.02) | probably_damaging(0.999) | TCGA-A6-6653-01 | Colorectum | colon adenocarcinoma | Male | >=65 | I/II | Unknown | Unknown | SD | |
| FAM174B | SNV | Missense_Mutation | rs778960408 | c.463G>A | p.Asp155Asn | p.D155N | Q3ZCQ3 | protein_coding | deleterious(0) | probably_damaging(0.999) | TCGA-AA-3510-01 | Colorectum | colon adenocarcinoma | Male | >=65 | I/II | Unknown | Unknown | SD |
| FAM174B | SNV | Missense_Mutation | rs778960408 | c.463N>A | p.Asp155Asn | p.D155N | Q3ZCQ3 | protein_coding | deleterious(0) | probably_damaging(0.999) | TCGA-AA-3984-01 | Colorectum | colon adenocarcinoma | Female | <65 | I/II | Unknown | Unknown | SD |
| FAM174B | SNV | Missense_Mutation | rs778960408 | c.463N>A | p.Asp155Asn | p.D155N | Q3ZCQ3 | protein_coding | deleterious(0) | probably_damaging(0.999) | TCGA-AJ-A3EL-01 | Endometrium | uterine corpus endometrioid carcinoma | Female | <65 | I/II | Unknown | Unknown | SD |
| FAM174B | SNV | Missense_Mutation | c.463N>T | p.Asp155Tyr | p.D155Y | Q3ZCQ3 | protein_coding | deleterious(0) | probably_damaging(1) | TCGA-BK-A6W3-01 | Endometrium | uterine corpus endometrioid carcinoma | Female | <65 | I/II | Unknown | Unknown | SD | |
| FAM174B | SNV | Missense_Mutation | novel | c.363G>T | p.Lys121Asn | p.K121N | Q3ZCQ3 | protein_coding | deleterious(0.01) | probably_damaging(0.984) | TCGA-BS-A0UF-01 | Endometrium | uterine corpus endometrioid carcinoma | Female | >=65 | I/II | Unknown | Unknown | SD |
| FAM174B | SNV | Missense_Mutation | rs778960408 | c.463N>A | p.Asp155Asn | p.D155N | Q3ZCQ3 | protein_coding | deleterious(0) | probably_damaging(0.999) | TCGA-BS-A0UV-01 | Endometrium | uterine corpus endometrioid carcinoma | Female | <65 | III/IV | Unknown | Unknown | SD |
| FAM174B | SNV | Missense_Mutation | rs778960408 | c.463G>A | p.Asp155Asn | p.D155N | Q3ZCQ3 | protein_coding | deleterious(0) | probably_damaging(0.999) | TCGA-DF-A2KU-01 | Endometrium | uterine corpus endometrioid carcinoma | Female | Unknown | I/II | Unknown | Unknown | SD |
| FAM174B | SNV | Missense_Mutation | rs778960408 | c.463G>A | p.Asp155Asn | p.D155N | Q3ZCQ3 | protein_coding | deleterious(0) | probably_damaging(0.999) | TCGA-EO-A22X-01 | Endometrium | uterine corpus endometrioid carcinoma | Female | <65 | III/IV | Unspecific | Carboplatin | Complete Response |
| FAM174B | SNV | Missense_Mutation | novel | c.292N>A | p.Ala98Thr | p.A98T | Q3ZCQ3 | protein_coding | tolerated(0.06) | probably_damaging(0.998) | TCGA-FI-A2D5-01 | Endometrium | uterine corpus endometrioid carcinoma | Female | <65 | III/IV | Chemotherapy | carboplatinum | PD |
| Page: 1 2 |
Top |
Related drugs of malignant transformation related genes |
| Identification of chemicals and drugs interact with genes involved in malignant transfromation |
| (DGIdb 4.0) |
| Entrez ID | Symbol | Category | Interaction Types | Drug Claim Name | Drug Name | PMIDs |
| Page: 1 |

Copyright 2023-Present -The University of Texas Health Science Center at Houston |