Schematic overview of the cellular and molecular mechanisms involved in the cancer progression, including the proposed cellular and molecular mechanisms in cancer cells trajectory. AT1: alveolar type 1 cells; AT2: alveolar type 2 cells; AAH: atypical adenomatous hyperplasia; AIS: adenocarcinoma in situ; MIA: minimally invasive adenocarcinoma; IA: invasive adenocarcinoma; EMT: epithelial-mesenchymal transition

Home

Download

Statistics

Help

Contact

Center for Computational Systems Medicine
leaf

Gene summary

leaf

Malignant transformation analysis

leaf

Malignant transformation related pathway analysis

leaf

Cell-cell communication analysis

leaf

Single-cell gene regulatory network inference analysis

leaf

Somatic mutation of malignant transformation related genes

leaf

Related drugs of malignant transformation related genes

Gene: FAM172A

Gene summary for FAM172A

check button Gene summary.

Gene informationSpeciesHuman
Gene symbol

FAM172A

Gene ID

83989

Gene namefamily with sequence similarity 172 member A
Gene AliasC5orf21
Cytomap5q15
Gene Typeprotein-coding
GO ID

GO:0000375

UniProtAcc

Q8WUF8


Top

Malignant transformation analysis

check button Identification of the aberrant gene expression in precancerous and cancerous lesions by comparing the gene expression of stem-like cells in diseased tissues with normal stem cells
check button Malignant transformation involving gene list.
Entrez IDSymbolReplicatesSpeciesOrganTissueAdj P-valueLog2FCMalignancy
83989FAM172ACCI_1HumanCervixCC1.35e-025.34e-010.528
83989FAM172ACCI_2HumanCervixCC1.76e-101.19e+000.5249
83989FAM172ACCI_3HumanCervixCC1.41e-108.32e-010.516
83989FAM172AHTA11_3410_2000001011HumanColorectumAD1.71e-21-7.44e-010.0155
83989FAM172AHTA11_2487_2000001011HumanColorectumSER1.85e-02-4.40e-01-0.1808
83989FAM172AHTA11_3361_2000001011HumanColorectumAD1.12e-04-6.31e-01-0.1207
83989FAM172AHTA11_696_2000001011HumanColorectumAD3.04e-08-4.38e-01-0.1464
83989FAM172AHTA11_866_2000001011HumanColorectumAD4.44e-03-3.45e-01-0.1001
83989FAM172AHTA11_9408_2000001011HumanColorectumAD1.12e-02-8.34e-010.0451
83989FAM172AHTA11_6818_2000001021HumanColorectumAD1.05e-055.93e-010.0588
83989FAM172AHTA11_99999965104_69814HumanColorectumMSS3.08e-055.71e-010.281
83989FAM172AHTA11_99999971662_82457HumanColorectumMSS1.09e-025.94e-010.3859
83989FAM172AA001-C-207HumanColorectumFAP2.22e-03-2.87e-010.1278
83989FAM172AA015-C-203HumanColorectumFAP4.78e-32-4.54e-01-0.1294
83989FAM172AA015-C-204HumanColorectumFAP2.82e-06-3.77e-01-0.0228
83989FAM172AA014-C-040HumanColorectumFAP8.36e-05-3.94e-01-0.1184
83989FAM172AA002-C-201HumanColorectumFAP5.82e-16-4.62e-010.0324
83989FAM172AA001-C-119HumanColorectumFAP5.72e-13-7.25e-01-0.1557
83989FAM172AA001-C-108HumanColorectumFAP3.77e-16-3.73e-01-0.0272
83989FAM172AA002-C-205HumanColorectumFAP1.76e-23-4.54e-01-0.1236
Page: 1 2 3 4 5 6 7 8 

check button Transcriptomic changes along malignancy continuum.
TissueExpression DynamicsAbbreviation
CervixThe image shows the transcriptomic changes along malignancy continuum.log2FC in expression of this searched gene in stem-like cells from each diseased tissue sample relative to stem-like cells in normal samples in each tissue plotted against the malignancy continuum. Samples are colored based on if they are from different disease stage.CC: Cervix cancer
HSIL_HPV: HPV-infected high-grade squamous intraepithelial lesions
N_HPV: HPV-infected normal cervix
Colorectum (GSE201348)The image shows the transcriptomic changes along malignancy continuum.log2FC in expression of this searched gene in stem-like cells from each diseased tissue sample relative to stem-like cells in normal samples in each tissue plotted against the malignancy continuum. Samples are colored based on if they are from different disease stage.FAP: Familial adenomatous polyposis
CRC: Colorectal cancer
Colorectum (HTA11)The image shows the transcriptomic changes along malignancy continuum.log2FC in expression of this searched gene in stem-like cells from each diseased tissue sample relative to stem-like cells in normal samples in each tissue plotted against the malignancy continuum. Samples are colored based on if they are from different disease stage.AD: Adenomas
SER: Sessile serrated lesions
MSI-H: Microsatellite-high colorectal cancer
MSS: Microsatellite stable colorectal cancer
EndometriumThe image shows the transcriptomic changes along malignancy continuum.log2FC in expression of this searched gene in stem-like cells from each diseased tissue sample relative to stem-like cells in normal samples in each tissue plotted against the malignancy continuum. Samples are colored based on if they are from different disease stage.
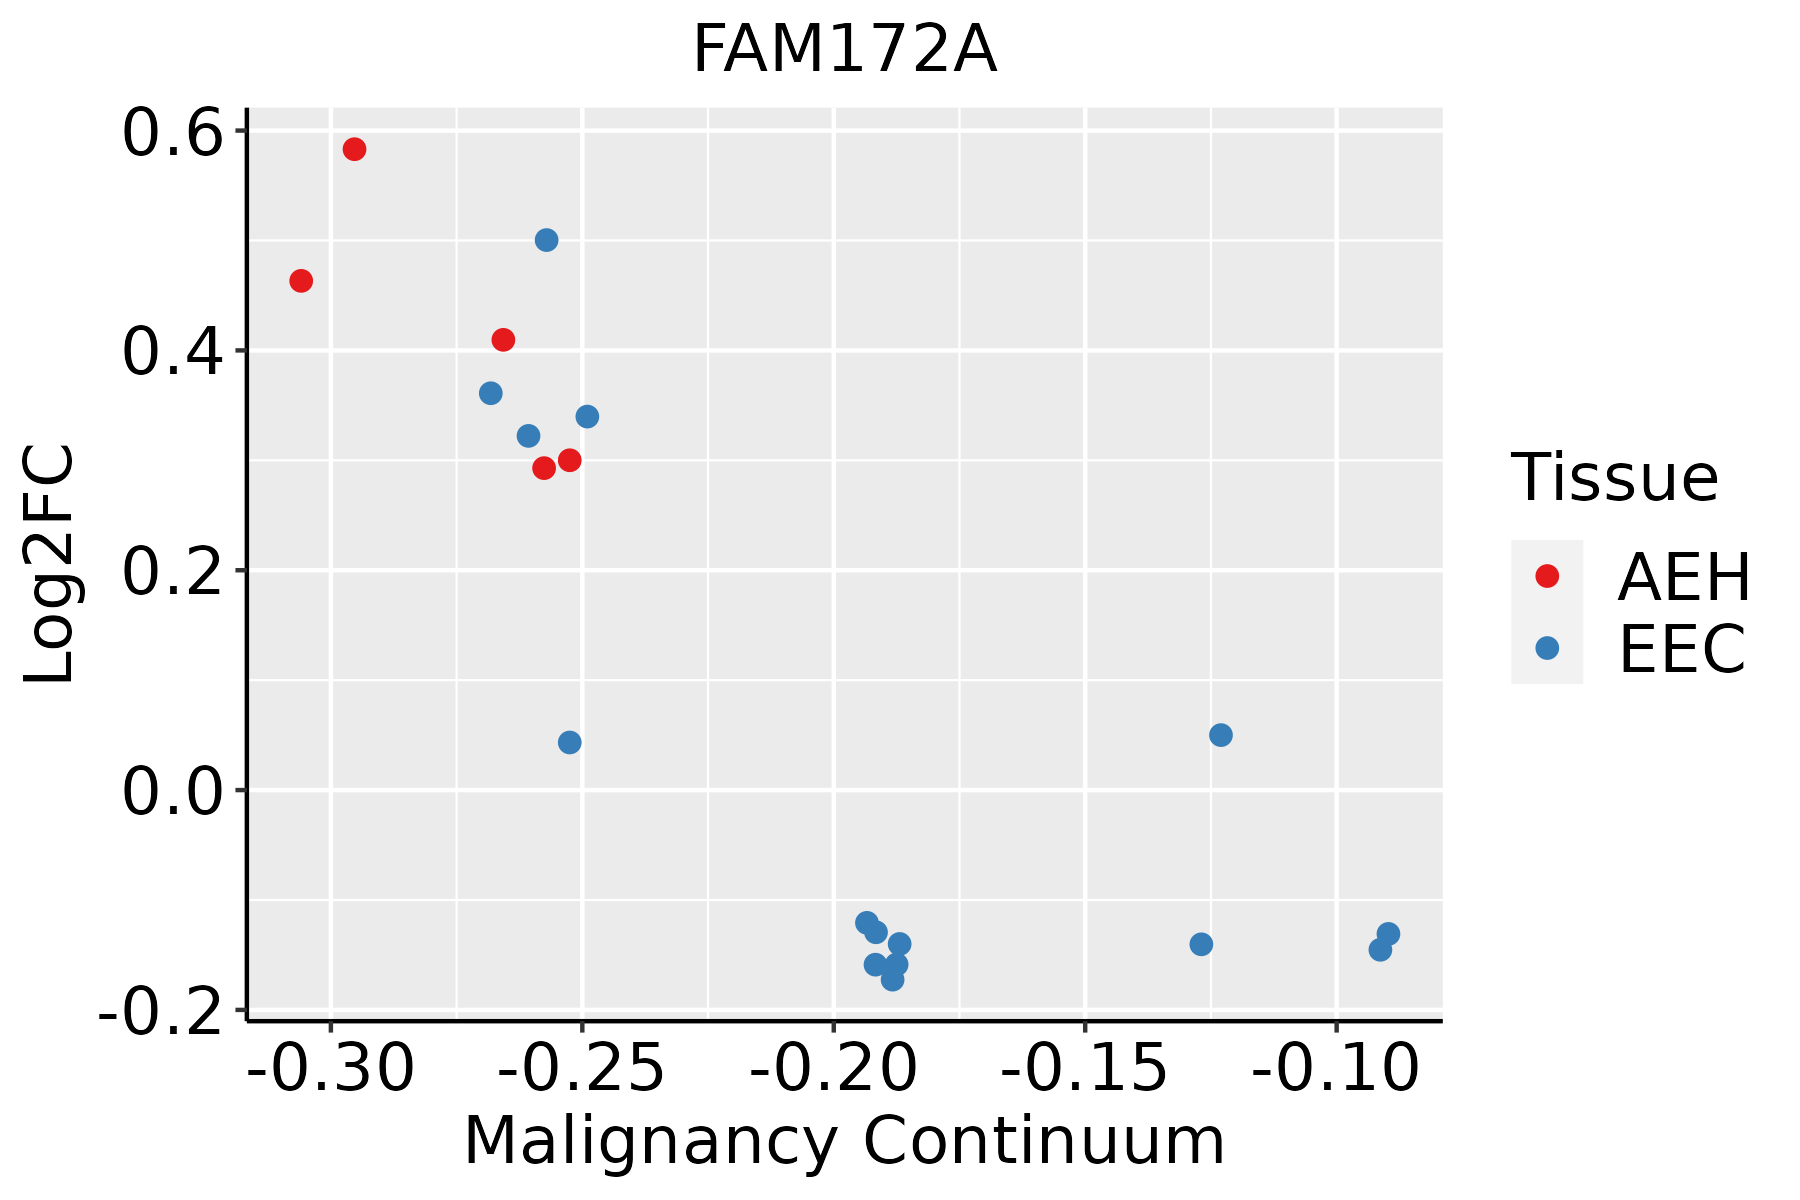
AEH: Atypical endometrial hyperplasia
EEC: Endometrioid Cancer
EsophagusThe image shows the transcriptomic changes along malignancy continuum.log2FC in expression of this searched gene in stem-like cells from each diseased tissue sample relative to stem-like cells in normal samples in each tissue plotted against the malignancy continuum. Samples are colored based on if they are from different disease stage.ESCC: Esophageal squamous cell carcinoma
HGIN: High-grade intraepithelial neoplasias
LGIN: Low-grade intraepithelial neoplasias
LungThe image shows the transcriptomic changes along malignancy continuum.log2FC in expression of this searched gene in stem-like cells from each diseased tissue sample relative to stem-like cells in normal samples in each tissue plotted against the malignancy continuum. Samples are colored based on if they are from different disease stage.AAH: Atypical adenomatous hyperplasia
AIS: Adenocarcinoma in situ
IAC: Invasive lung adenocarcinoma
MIA: Minimally invasive adenocarcinoma
ProstateThe image shows the transcriptomic changes along malignancy continuum.log2FC in expression of this searched gene in stem-like cells from each diseased tissue sample relative to stem-like cells in normal samples in each tissue plotted against the malignancy continuum. Samples are colored based on if they are from different disease stage.
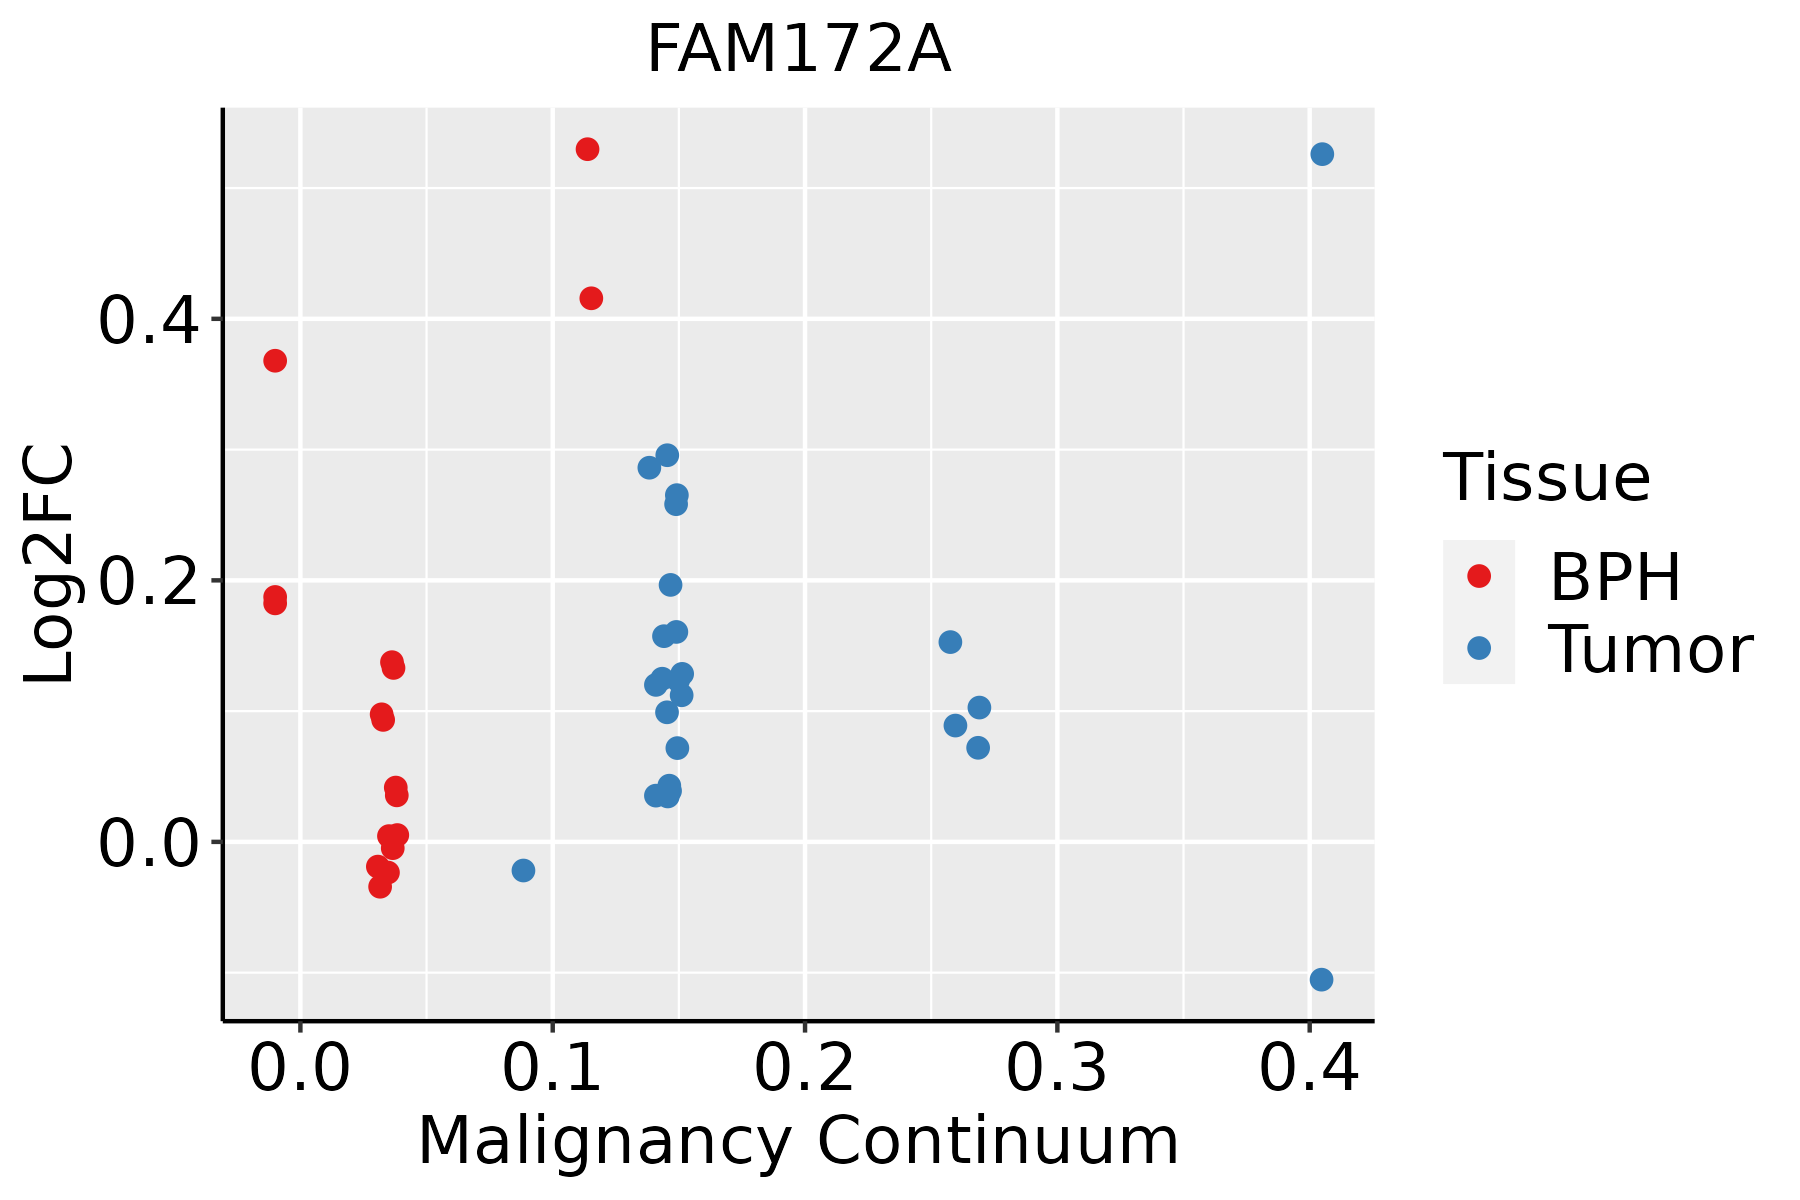
BPH: Benign Prostatic Hyperplasia
ThyroidThe image shows the transcriptomic changes along malignancy continuum.log2FC in expression of this searched gene in stem-like cells from each diseased tissue sample relative to stem-like cells in normal samples in each tissue plotted against the malignancy continuum. Samples are colored based on if they are from different disease stage.ATC: Anaplastic thyroid cancer
HT: Hashimoto's thyroiditis
PTC: Papillary thyroid cancer
∗log2FC in expression of this searched gene in stem-like cells from each diseased tissue sample relative to stem-like cells in normal samples in each tissue plotted against the malignancy continuum. Samples are colored based on if they are from different disease stage.

Top

Malignant transformation related pathway analysis

check buttonFind out the enriched GO biological processes and KEGG pathways involved in transition from healthy to precancer to cancer
check button Figure of enriched GO biological processes.
TissueDisease StageEnriched GO biological Processes
ColorectumADGO analysis - Figure of enriched GO biological processes: Top 15 enriched GO BP terms are showed in the bar plot of each disease state in each tissue. Each row represents a significant GO biological process which is colored according to the -log10(p.adjust).
ColorectumSERGO analysis - Figure of enriched GO biological processes: Top 15 enriched GO BP terms are showed in the bar plot of each disease state in each tissue. Each row represents a significant GO biological process which is colored according to the -log10(p.adjust).
ColorectumMSSGO analysis - Figure of enriched GO biological processes: Top 15 enriched GO BP terms are showed in the bar plot of each disease state in each tissue. Each row represents a significant GO biological process which is colored according to the -log10(p.adjust).
ColorectumMSI-HGO analysis - Figure of enriched GO biological processes: Top 15 enriched GO BP terms are showed in the bar plot of each disease state in each tissue. Each row represents a significant GO biological process which is colored according to the -log10(p.adjust).
ColorectumFAPGO analysis - Figure of enriched GO biological processes: Top 15 enriched GO BP terms are showed in the bar plot of each disease state in each tissue. Each row represents a significant GO biological process which is colored according to the -log10(p.adjust).
∗Top 15 enriched GO BP terms are showed in the bar plot of each disease state in each tissue. Each row represents a significant GO biological process which is colored according to the -log10(p.adjust).
Page: 1 2 3 4 5 6 7 8 9 

check button Enriched GO biological processes.
GO IDTissueDisease StageDescriptionGene RatioBg Ratiopvaluep.adjustCount
GO:004348410CervixCCregulation of RNA splicing42/2311148/187231.25e-076.24e-0642
GO:19033119CervixCCregulation of mRNA metabolic process64/2311288/187231.71e-065.64e-0564
GO:004802410CervixCCregulation of mRNA splicing, via spliceosome28/2311101/187232.41e-054.19e-0428
GO:00488634CervixCCstem cell differentiation46/2311206/187234.11e-056.36e-0446
GO:00063257CervixCCchromatin organization78/2311409/187235.40e-058.02e-0478
GO:00506849CervixCCregulation of mRNA processing33/2311137/187231.06e-041.35e-0333
GO:000838010CervixCCRNA splicing76/2311434/187239.79e-048.19e-0376
GO:000037710CervixCCRNA splicing, via transesterification reactions with bulged adenosine as nucleophile55/2311320/187236.71e-033.70e-0255
GO:000039810CervixCCmRNA splicing, via spliceosome55/2311320/187236.71e-033.70e-0255
GO:000037510CervixCCRNA splicing, via transesterification reactions55/2311324/187238.61e-034.44e-0255
GO:00487624CervixCCmesenchymal cell differentiation42/2311236/187239.12e-034.60e-0242
GO:0008380ColorectumADRNA splicing169/3918434/187233.59e-182.04e-15169
GO:0000377ColorectumADRNA splicing, via transesterification reactions with bulged adenosine as nucleophile130/3918320/187235.88e-162.16e-13130
GO:0000398ColorectumADmRNA splicing, via spliceosome130/3918320/187235.88e-162.16e-13130
GO:0000375ColorectumADRNA splicing, via transesterification reactions131/3918324/187237.11e-162.22e-13131
GO:1903311ColorectumADregulation of mRNA metabolic process117/3918288/187231.69e-144.23e-12117
GO:0043484ColorectumADregulation of RNA splicing70/3918148/187236.47e-131.16e-1070
GO:0048024ColorectumADregulation of mRNA splicing, via spliceosome50/3918101/187231.62e-101.56e-0850
GO:0050684ColorectumADregulation of mRNA processing61/3918137/187234.23e-103.58e-0861
GO:0000380ColorectumADalternative mRNA splicing, via spliceosome33/391877/187231.13e-052.55e-0433
Page: 1 2 3 4 5 6 7 8 9 10 11 12 

check button Enriched KEGG pathways.
Pathway IDTissueDisease StageDescriptionGene RatioBg Ratiopvaluep.adjustqvalueCount
Page: 1 

Top

Cell-cell communication analysis

check buttonIdentification of potential cell-cell interactions between two cell types and their ligand-receptor pairs for different disease states
LigandReceptorLRpairPathwayTissueDisease Stage
Page: 1 

Top

Single-cell gene regulatory network inference analysis

check buttonFind out the significant the regulons (TFs) and the target genes of each regulon across cell types for different disease states
TFCell TypeTissueDisease StageTarget GeneRSSRegulon Activity
∗The dot plots of a searched regulon are shown for all cell subpopulations in each disease state of each tissue based on the regulon specific score inferred using pySCENIC and by calculating the average expression.
Page: 1 

Top

Somatic mutation of malignant transformation related genes

check buttonAnnotation of somatic variants for genes involved in malignant transformation
Hugo SymbolVariant ClassVariant ClassificationdbSNP RSHGVScHGVSpHGVSp ShortSWISSPROTBIOTYPESIFTPolyPhenTumor Sample BarcodeTissueHistologySexAgeStageTherapy TypesDrugsOutcome
FAM172ASNVMissense_Mutationrs758166608c.1007N>Ap.Arg336Glnp.R336QQ8WUF8protein_codingtolerated(1)benign(0.003)TCGA-AN-A046-01Breastbreast invasive carcinomaFemale>=65I/IIUnknownUnknownSD
FAM172ASNVMissense_Mutationc.497N>Tp.Ala166Valp.A166VQ8WUF8protein_codingdeleterious(0.01)probably_damaging(0.946)TCGA-AR-A251-01Breastbreast invasive carcinomaFemale<65III/IVChemotherapydoxorubicinSD
FAM172ASNVMissense_Mutationc.1133N>Ap.Ser378Tyrp.S378YQ8WUF8protein_codingdeleterious(0)possibly_damaging(0.895)TCGA-BH-A1FN-01Breastbreast invasive carcinomaFemale<65I/IIUnknownUnknownPD
FAM172ASNVMissense_Mutationrs200535189c.779N>Gp.Tyr260Cysp.Y260CQ8WUF8protein_codingtolerated(0.17)benign(0)TCGA-GM-A2DM-01Breastbreast invasive carcinomaFemale<65I/IIChemotherapytaxolCR
FAM172AinsertionNonsense_Mutationnovelc.31_32insATAAACCTCTCATAAAATATCAGTAAp.Leu11TyrfsTer9p.L11Yfs*9Q8WUF8protein_codingTCGA-AR-A0U0-01Breastbreast invasive carcinomaFemale>=65I/IIUnknownUnknownSD
FAM172ASNVMissense_Mutationc.652G>Cp.Asp218Hisp.D218HQ8WUF8protein_codingdeleterious(0.03)possibly_damaging(0.866)TCGA-C5-A7UH-01Cervixcervical & endocervical cancerFemale<65III/IVChemotherapycisplatinSD
FAM172ASNVMissense_Mutationnovelc.388N>Ap.Glu130Lysp.E130KQ8WUF8protein_codingtolerated(0.05)benign(0.025)TCGA-VS-A9V5-01Cervixcervical & endocervical cancerFemale<65I/IIChemotherapycarboplatinPD
FAM172ASNVMissense_Mutationrs761232649c.925N>Ap.Asp309Asnp.D309NQ8WUF8protein_codingdeleterious(0.01)benign(0.088)TCGA-AA-A00N-01Colorectumcolon adenocarcinomaMale>=65I/IIUnknownUnknownPD
FAM172ASNVMissense_Mutationnovelc.503N>Tp.Arg168Ilep.R168IQ8WUF8protein_codingdeleterious(0)probably_damaging(0.961)TCGA-AG-3892-01Colorectumrectum adenocarcinomaFemale<65I/IIUnknownUnknownSD
FAM172AinsertionFrame_Shift_Insnovelc.928_929insCTCACACCCATTCATCTCAGCACp.Val310AlafsTer9p.V310Afs*9Q8WUF8protein_codingTCGA-AM-5820-01Colorectumcolon adenocarcinomaFemale<65I/IIUnknownUnknownSD
Page: 1 2 3 4 5 6 

Top

Related drugs of malignant transformation related genes

check buttonIdentification of chemicals and drugs interact with genes involved in malignant transfromation
(DGIdb 4.0)
Entrez IDSymbolCategoryInteraction TypesDrug Claim NameDrug NamePMIDs
Page: 1