
|
|||||
|
 | |
| |
| |
| |
| |
| |
|
Gene: FAM169A |
Gene summary for FAM169A |
| Gene information | Species | Human | Gene symbol | FAM169A | Gene ID | 26049 |
| Gene name | family with sequence similarity 169 member A | |
| Gene Alias | SLAP75 | |
| Cytomap | 5q13.3 | |
| Gene Type | protein-coding | GO ID | GO:0005575 | UniProtAcc | Q9Y6X4 |
Top |
Malignant transformation analysis |
| Identification of the aberrant gene expression in precancerous and cancerous lesions by comparing the gene expression of stem-like cells in diseased tissues with normal stem cells |
| Entrez ID | Symbol | Replicates | Species | Organ | Tissue | Adj P-value | Log2FC | Malignancy |
| 26049 | FAM169A | GSM6177620_NYU_UCEC1_lib1_lib1 | Human | Endometrium | EEC | 2.49e-02 | -6.07e-02 | -0.1869 |
| 26049 | FAM169A | GSM6177620_NYU_UCEC1_lib3_lib3 | Human | Endometrium | EEC | 3.01e-06 | -5.05e-02 | -0.1883 |
| 26049 | FAM169A | GSM6177622_NYU_UCEC3_lib1_lib1 | Human | Endometrium | EEC | 5.32e-03 | -7.79e-03 | -0.1917 |
| 26049 | FAM169A | GSM6177622_NYU_UCEC3_lib2_lib2 | Human | Endometrium | EEC | 7.26e-04 | 1.55e-02 | -0.1916 |
| 26049 | FAM169A | NAFLD1 | Human | Liver | NAFLD | 2.53e-03 | 3.85e-01 | -0.04 |
| 26049 | FAM169A | HCC1_Meng | Human | Liver | HCC | 3.68e-09 | 1.76e-02 | 0.0246 |
| 26049 | FAM169A | HCC1 | Human | Liver | HCC | 8.00e-06 | 2.18e+00 | 0.5336 |
| 26049 | FAM169A | HCC2 | Human | Liver | HCC | 3.16e-04 | 3.03e+00 | 0.5341 |
| 26049 | FAM169A | HCC5 | Human | Liver | HCC | 2.64e-07 | 1.80e+00 | 0.4932 |
| 26049 | FAM169A | S014 | Human | Liver | HCC | 8.22e-07 | 2.89e-01 | 0.2254 |
| 26049 | FAM169A | S015 | Human | Liver | HCC | 1.42e-13 | 4.35e-01 | 0.2375 |
| 26049 | FAM169A | S016 | Human | Liver | HCC | 5.61e-15 | 3.70e-01 | 0.2243 |
| Page: 1 |
| Tissue | Expression Dynamics | Abbreviation |
| Endometrium | 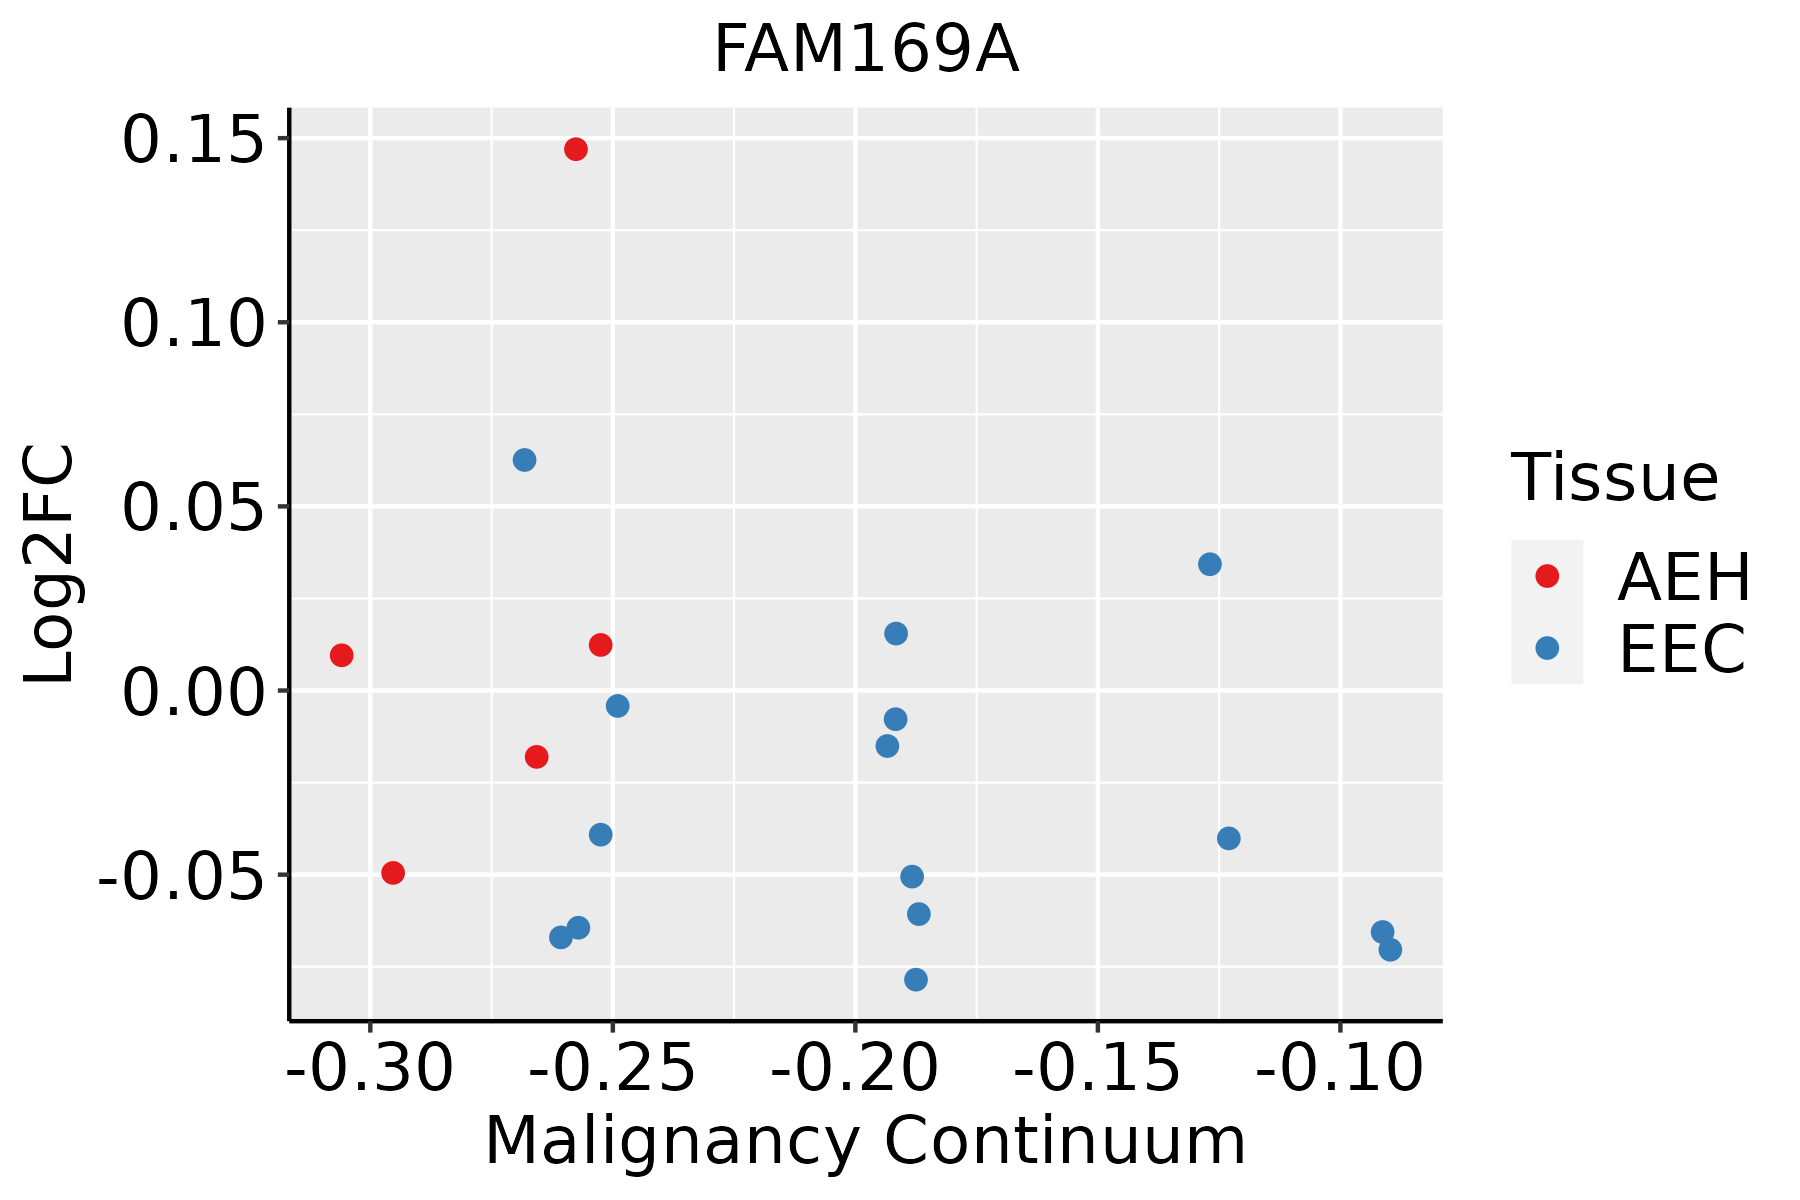 | AEH: Atypical endometrial hyperplasia |
| EEC: Endometrioid Cancer | ||
| Liver | 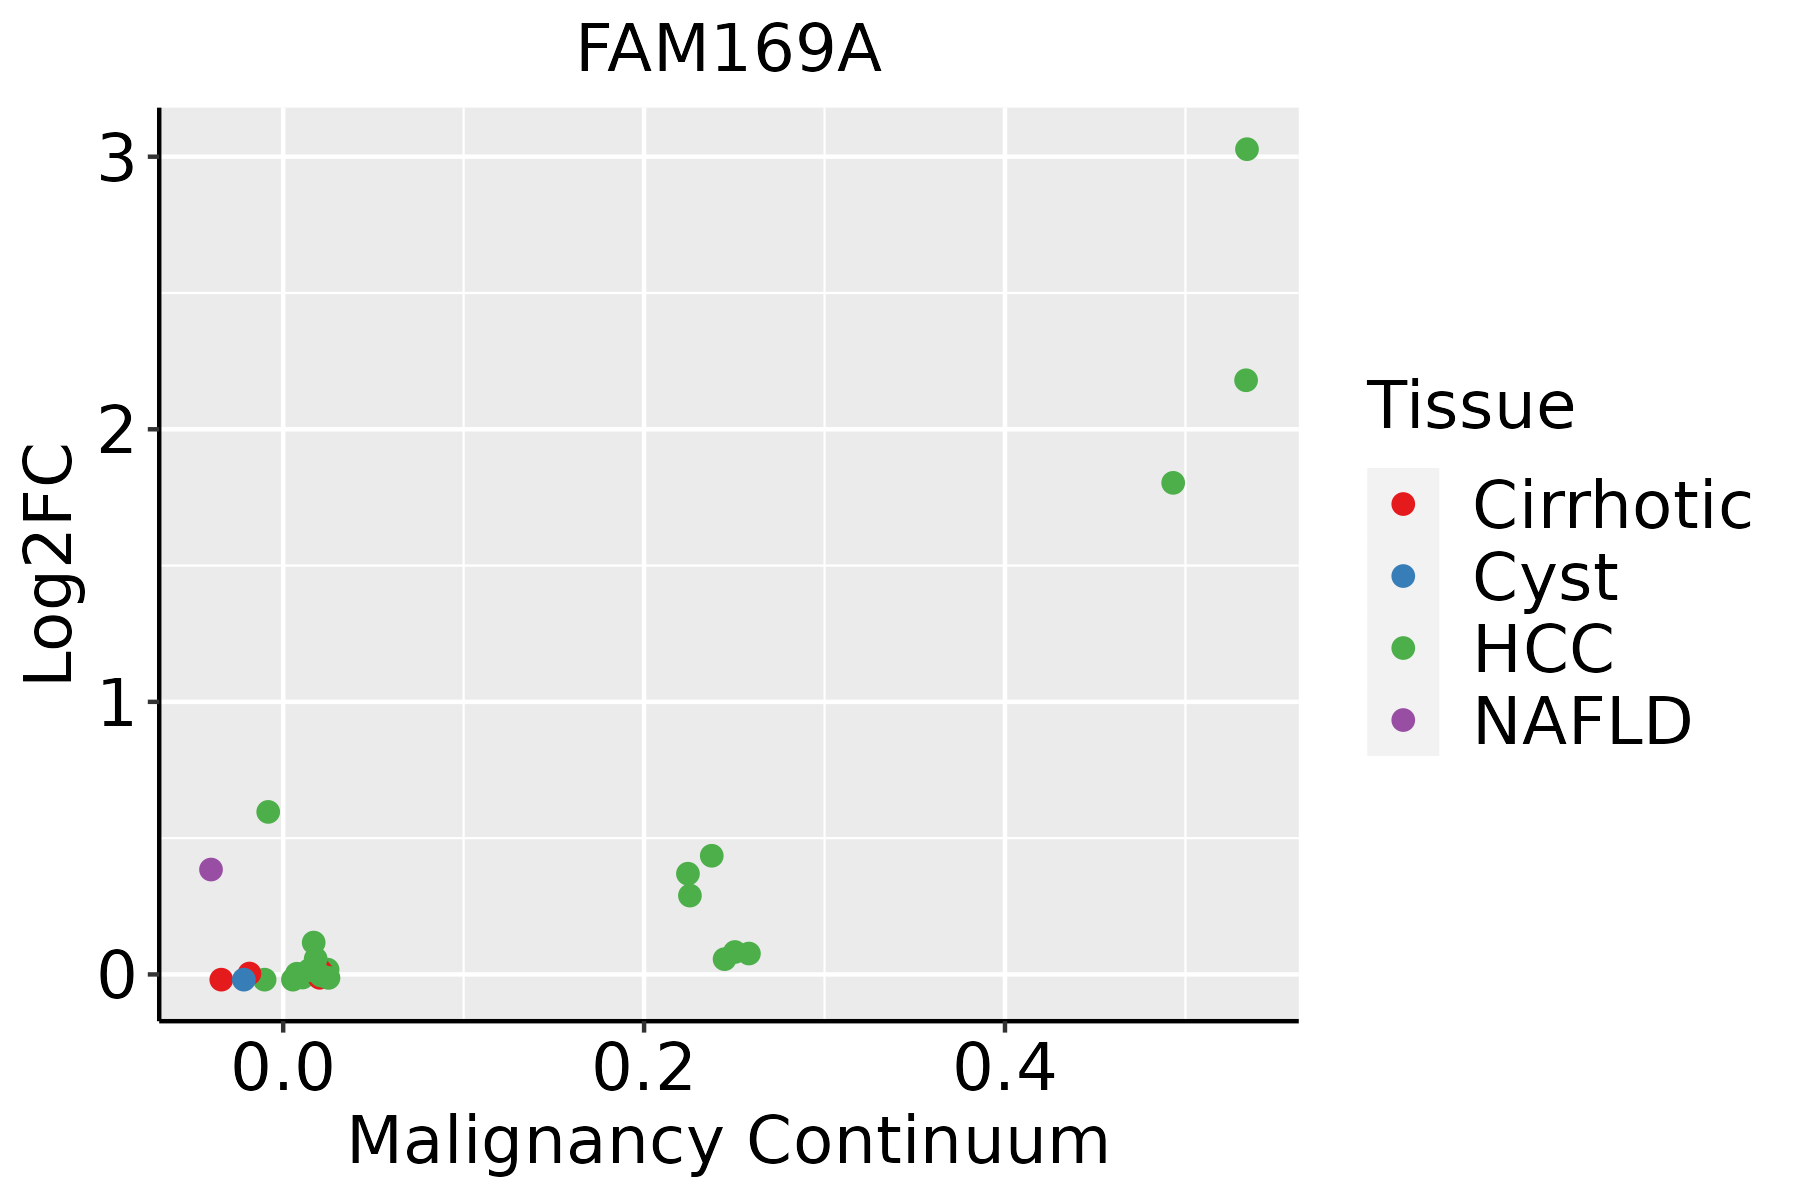 | HCC: Hepatocellular carcinoma |
| NAFLD: Non-alcoholic fatty liver disease |
| ∗log2FC in expression of this searched gene in stem-like cells from each diseased tissue sample relative to stem-like cells in normal samples in each tissue plotted against the malignancy continuum. Samples are colored based on if they are from different disease stage. |
Top |
Malignant transformation related pathway analysis |
| Find out the enriched GO biological processes and KEGG pathways involved in transition from healthy to precancer to cancer |
| Tissue | Disease Stage | Enriched GO biological Processes |
| Colorectum | AD |  |
| Colorectum | SER |  |
| Colorectum | MSS |  |
| Colorectum | MSI-H |  |
| Colorectum | FAP |  |
| ∗Top 15 enriched GO BP terms are showed in the bar plot of each disease state in each tissue. Each row represents a significant GO biological process which is colored according to the -log10(p.adjust). |
| Page: 1 2 3 4 5 6 7 8 9 |
| GO ID | Tissue | Disease Stage | Description | Gene Ratio | Bg Ratio | pvalue | p.adjust | Count |
| Page: 1 |
| Pathway ID | Tissue | Disease Stage | Description | Gene Ratio | Bg Ratio | pvalue | p.adjust | qvalue | Count |
| Page: 1 |
Top |
Cell-cell communication analysis |
| Identification of potential cell-cell interactions between two cell types and their ligand-receptor pairs for different disease states |
| Ligand | Receptor | LRpair | Pathway | Tissue | Disease Stage |
| Page: 1 |
Top |
Single-cell gene regulatory network inference analysis |
| Find out the significant the regulons (TFs) and the target genes of each regulon across cell types for different disease states |
| TF | Cell Type | Tissue | Disease Stage | Target Gene | RSS | Regulon Activity |
| ∗The dot plots of a searched regulon are shown for all cell subpopulations in each disease state of each tissue based on the regulon specific score inferred using pySCENIC and by calculating the average expression. |
| Page: 1 |
Top |
Somatic mutation of malignant transformation related genes |
| Annotation of somatic variants for genes involved in malignant transformation |
| Hugo Symbol | Variant Class | Variant Classification | dbSNP RS | HGVSc | HGVSp | HGVSp Short | SWISSPROT | BIOTYPE | SIFT | PolyPhen | Tumor Sample Barcode | Tissue | Histology | Sex | Age | Stage | Therapy Types | Drugs | Outcome |
| FAM169A | SNV | Missense_Mutation | c.577N>T | p.Asp193Tyr | p.D193Y | Q9Y6X4 | protein_coding | deleterious(0) | probably_damaging(0.992) | TCGA-A8-A07R-01 | Breast | breast invasive carcinoma | Female | >=65 | III/IV | Ancillary | zoledronic | SD | |
| FAM169A | SNV | Missense_Mutation | c.413G>T | p.Cys138Phe | p.C138F | Q9Y6X4 | protein_coding | deleterious(0) | probably_damaging(0.999) | TCGA-BH-A18U-01 | Breast | breast invasive carcinoma | Female | >=65 | III/IV | Unknown | Unknown | SD | |
| FAM169A | SNV | Missense_Mutation | rs770317810 | c.338N>C | p.Arg113Thr | p.R113T | Q9Y6X4 | protein_coding | deleterious(0) | probably_damaging(0.999) | TCGA-D8-A1J8-01 | Breast | breast invasive carcinoma | Female | >=65 | I/II | Hormone Therapy | nolvadex | SD |
| FAM169A | insertion | Nonsense_Mutation | novel | c.1577_1578insAATTCACCATTGTTTTTAATTT | p.Ser526ArgfsTer7 | p.S526Rfs*7 | Q9Y6X4 | protein_coding | TCGA-AR-A0TY-01 | Breast | breast invasive carcinoma | Female | <65 | I/II | Unspecific | Paclitaxel | PD | ||
| FAM169A | SNV | Missense_Mutation | rs781053449 | c.1682C>T | p.Ser561Phe | p.S561F | Q9Y6X4 | protein_coding | deleterious(0.01) | probably_damaging(0.931) | TCGA-2W-A8YY-01 | Cervix | cervical & endocervical cancer | Female | <65 | I/II | Chemotherapy | cisplatin | CR |
| FAM169A | SNV | Missense_Mutation | c.143N>T | p.Ser48Ile | p.S48I | Q9Y6X4 | protein_coding | deleterious(0.02) | possibly_damaging(0.825) | TCGA-A6-5657-01 | Colorectum | colon adenocarcinoma | Male | >=65 | III/IV | Ancillary | leucovorin | SD | |
| FAM169A | SNV | Missense_Mutation | rs778097956 | c.1120C>T | p.Arg374Cys | p.R374C | Q9Y6X4 | protein_coding | tolerated(0.12) | benign(0.036) | TCGA-A6-6781-01 | Colorectum | colon adenocarcinoma | Male | <65 | III/IV | Chemotherapy | oxaliplatin | SD |
| FAM169A | SNV | Missense_Mutation | c.413G>A | p.Cys138Tyr | p.C138Y | Q9Y6X4 | protein_coding | deleterious(0) | probably_damaging(0.999) | TCGA-AA-3492-01 | Colorectum | colon adenocarcinoma | Female | >=65 | I/II | Unknown | Unknown | SD | |
| FAM169A | SNV | Missense_Mutation | c.2008A>T | p.Thr670Ser | p.T670S | Q9Y6X4 | protein_coding | tolerated_low_confidence(0.36) | benign(0.053) | TCGA-AA-3715-01 | Colorectum | colon adenocarcinoma | Male | >=65 | I/II | Unknown | Unknown | PD | |
| FAM169A | SNV | Missense_Mutation | rs771668934 | c.1004G>A | p.Arg335Gln | p.R335Q | Q9Y6X4 | protein_coding | tolerated(0.09) | possibly_damaging(0.709) | TCGA-AA-3833-01 | Colorectum | colon adenocarcinoma | Female | <65 | I/II | Unknown | Unknown | SD |
| Page: 1 2 3 4 5 6 7 |
Top |
Related drugs of malignant transformation related genes |
| Identification of chemicals and drugs interact with genes involved in malignant transfromation |
| (DGIdb 4.0) |
| Entrez ID | Symbol | Category | Interaction Types | Drug Claim Name | Drug Name | PMIDs |
| Page: 1 |

Copyright 2023-Present -The University of Texas Health Science Center at Houston |