
|
|||||
|
 | |
| |
| |
| |
| |
| |
|
Gene: FAM168A |
Gene summary for FAM168A |
| Gene information | Species | Human | Gene symbol | FAM168A | Gene ID | 23201 |
| Gene name | family with sequence similarity 168 member A | |
| Gene Alias | KIAA0280 | |
| Cytomap | 11q13.4 | |
| Gene Type | protein-coding | GO ID | GO:0006139 | UniProtAcc | Q92567 |
Top |
Malignant transformation analysis |
| Identification of the aberrant gene expression in precancerous and cancerous lesions by comparing the gene expression of stem-like cells in diseased tissues with normal stem cells |
| Entrez ID | Symbol | Replicates | Species | Organ | Tissue | Adj P-value | Log2FC | Malignancy |
| 23201 | FAM168A | AEH-subject1 | Human | Endometrium | AEH | 6.84e-15 | 3.85e-01 | -0.3059 |
| 23201 | FAM168A | AEH-subject3 | Human | Endometrium | AEH | 2.49e-07 | 2.80e-01 | -0.2576 |
| 23201 | FAM168A | AEH-subject4 | Human | Endometrium | AEH | 9.06e-04 | 2.87e-01 | -0.2657 |
| 23201 | FAM168A | AEH-subject5 | Human | Endometrium | AEH | 1.01e-17 | 5.58e-01 | -0.2953 |
| 23201 | FAM168A | EEC-subject1 | Human | Endometrium | EEC | 1.98e-11 | 4.21e-01 | -0.2682 |
| 23201 | FAM168A | EEC-subject2 | Human | Endometrium | EEC | 3.70e-06 | 3.00e-01 | -0.2607 |
| 23201 | FAM168A | EEC-subject4 | Human | Endometrium | EEC | 8.01e-05 | 2.54e-01 | -0.2571 |
| 23201 | FAM168A | EEC-subject5 | Human | Endometrium | EEC | 2.94e-10 | 3.58e-01 | -0.249 |
| 23201 | FAM168A | GSM5276937 | Human | Endometrium | EEC | 2.26e-02 | -9.53e-02 | -0.0897 |
| 23201 | FAM168A | GSM6177620_NYU_UCEC1_lib1_lib1 | Human | Endometrium | EEC | 3.57e-05 | 2.71e-02 | -0.1869 |
| 23201 | FAM168A | GSM6177620_NYU_UCEC1_lib2_lib2 | Human | Endometrium | EEC | 5.30e-06 | 3.51e-02 | -0.1875 |
| 23201 | FAM168A | GSM6177620_NYU_UCEC1_lib3_lib3 | Human | Endometrium | EEC | 5.87e-05 | 1.47e-03 | -0.1883 |
| 23201 | FAM168A | GSM6177621_NYU_UCEC2_lib1_lib1 | Human | Endometrium | EEC | 3.07e-03 | 2.14e-02 | -0.1934 |
| 23201 | FAM168A | GSM6177622_NYU_UCEC3_lib1_lib1 | Human | Endometrium | EEC | 1.62e-05 | 3.06e-02 | -0.1917 |
| 23201 | FAM168A | GSM6177622_NYU_UCEC3_lib2_lib2 | Human | Endometrium | EEC | 1.23e-08 | -1.85e-02 | -0.1916 |
| 23201 | FAM168A | LZE22T | Human | Esophagus | ESCC | 1.87e-04 | 2.49e-01 | 0.068 |
| 23201 | FAM168A | LZE24T | Human | Esophagus | ESCC | 7.45e-08 | 1.12e-01 | 0.0596 |
| 23201 | FAM168A | P2T-E | Human | Esophagus | ESCC | 3.91e-26 | 4.15e-01 | 0.1177 |
| 23201 | FAM168A | P4T-E | Human | Esophagus | ESCC | 1.35e-10 | 1.11e-01 | 0.1323 |
| 23201 | FAM168A | P5T-E | Human | Esophagus | ESCC | 6.74e-09 | 9.71e-02 | 0.1327 |
| Page: 1 2 3 4 |
| Tissue | Expression Dynamics | Abbreviation |
| Endometrium |  | AEH: Atypical endometrial hyperplasia |
| EEC: Endometrioid Cancer | ||
| Esophagus | 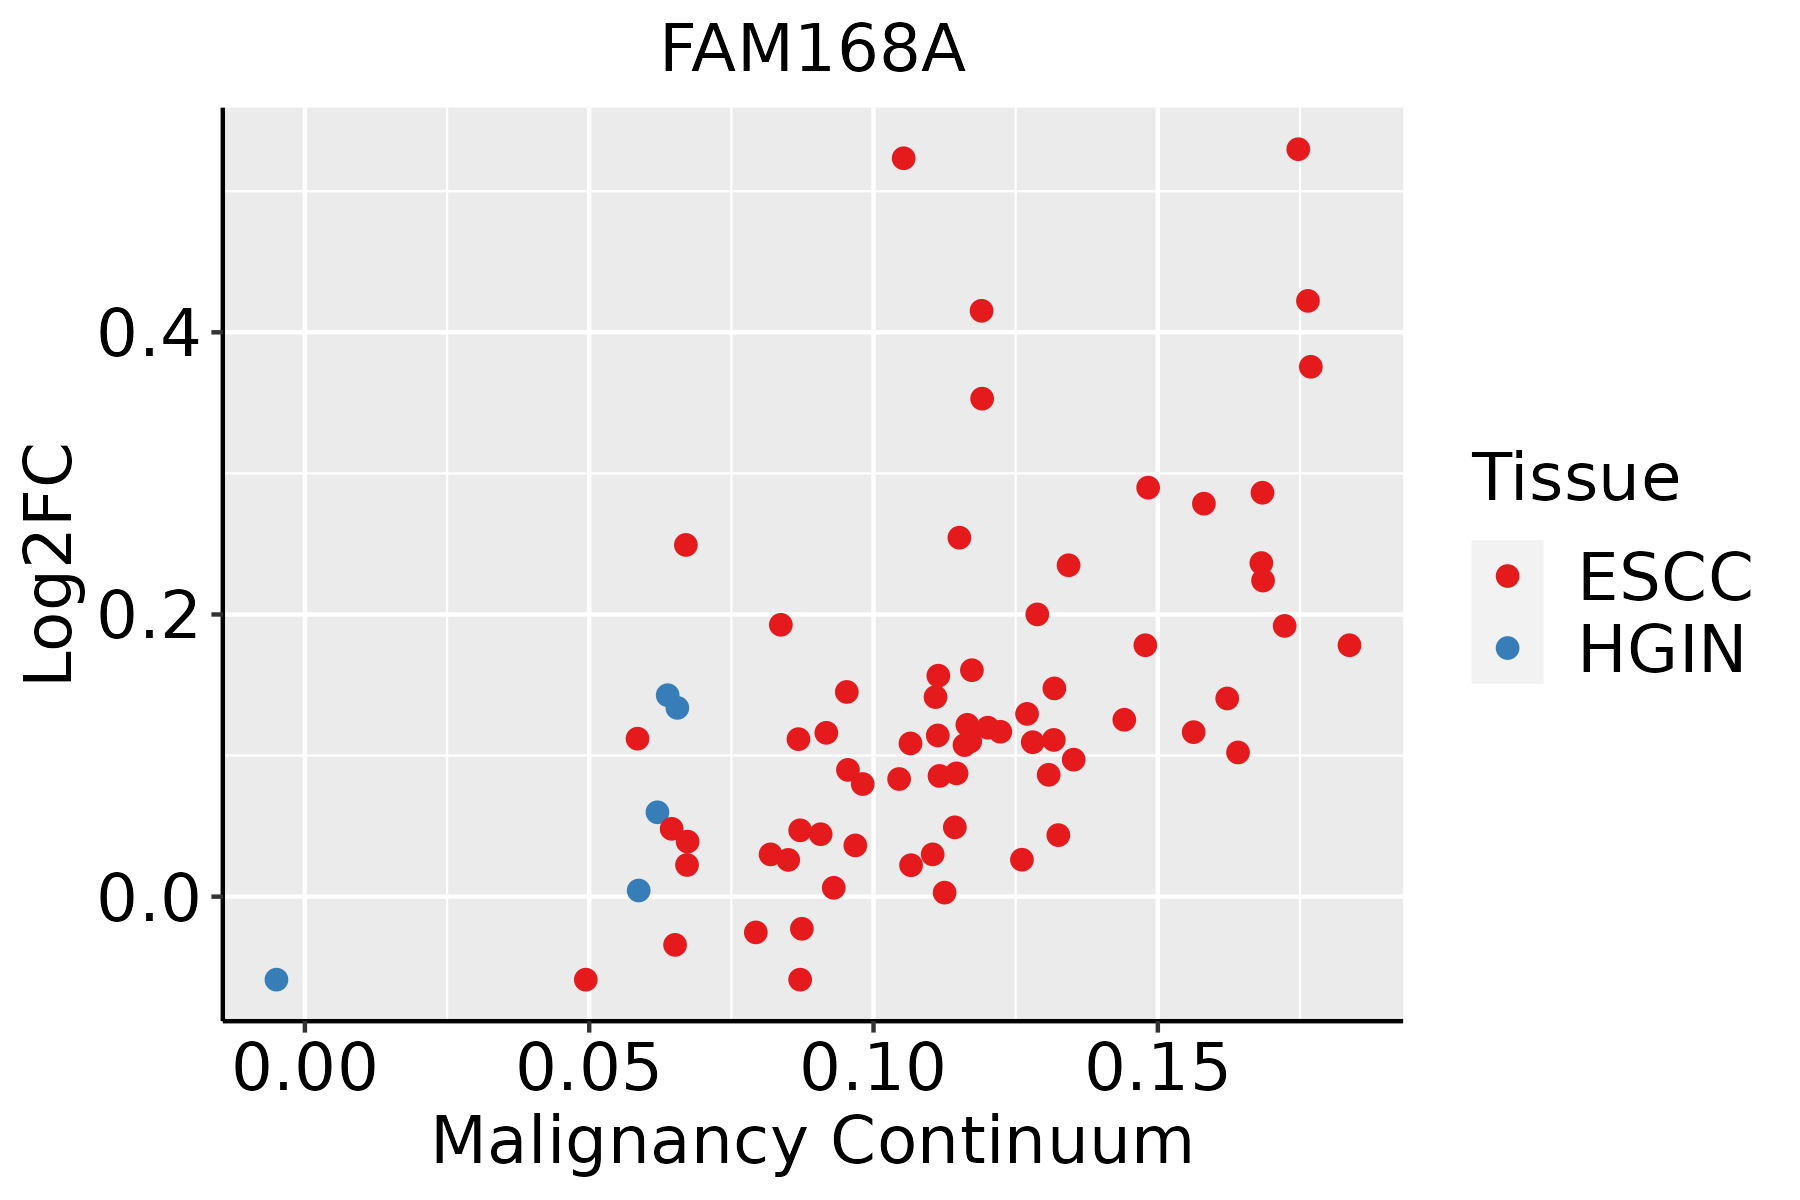 | ESCC: Esophageal squamous cell carcinoma |
| HGIN: High-grade intraepithelial neoplasias | ||
| LGIN: Low-grade intraepithelial neoplasias | ||
| Liver | 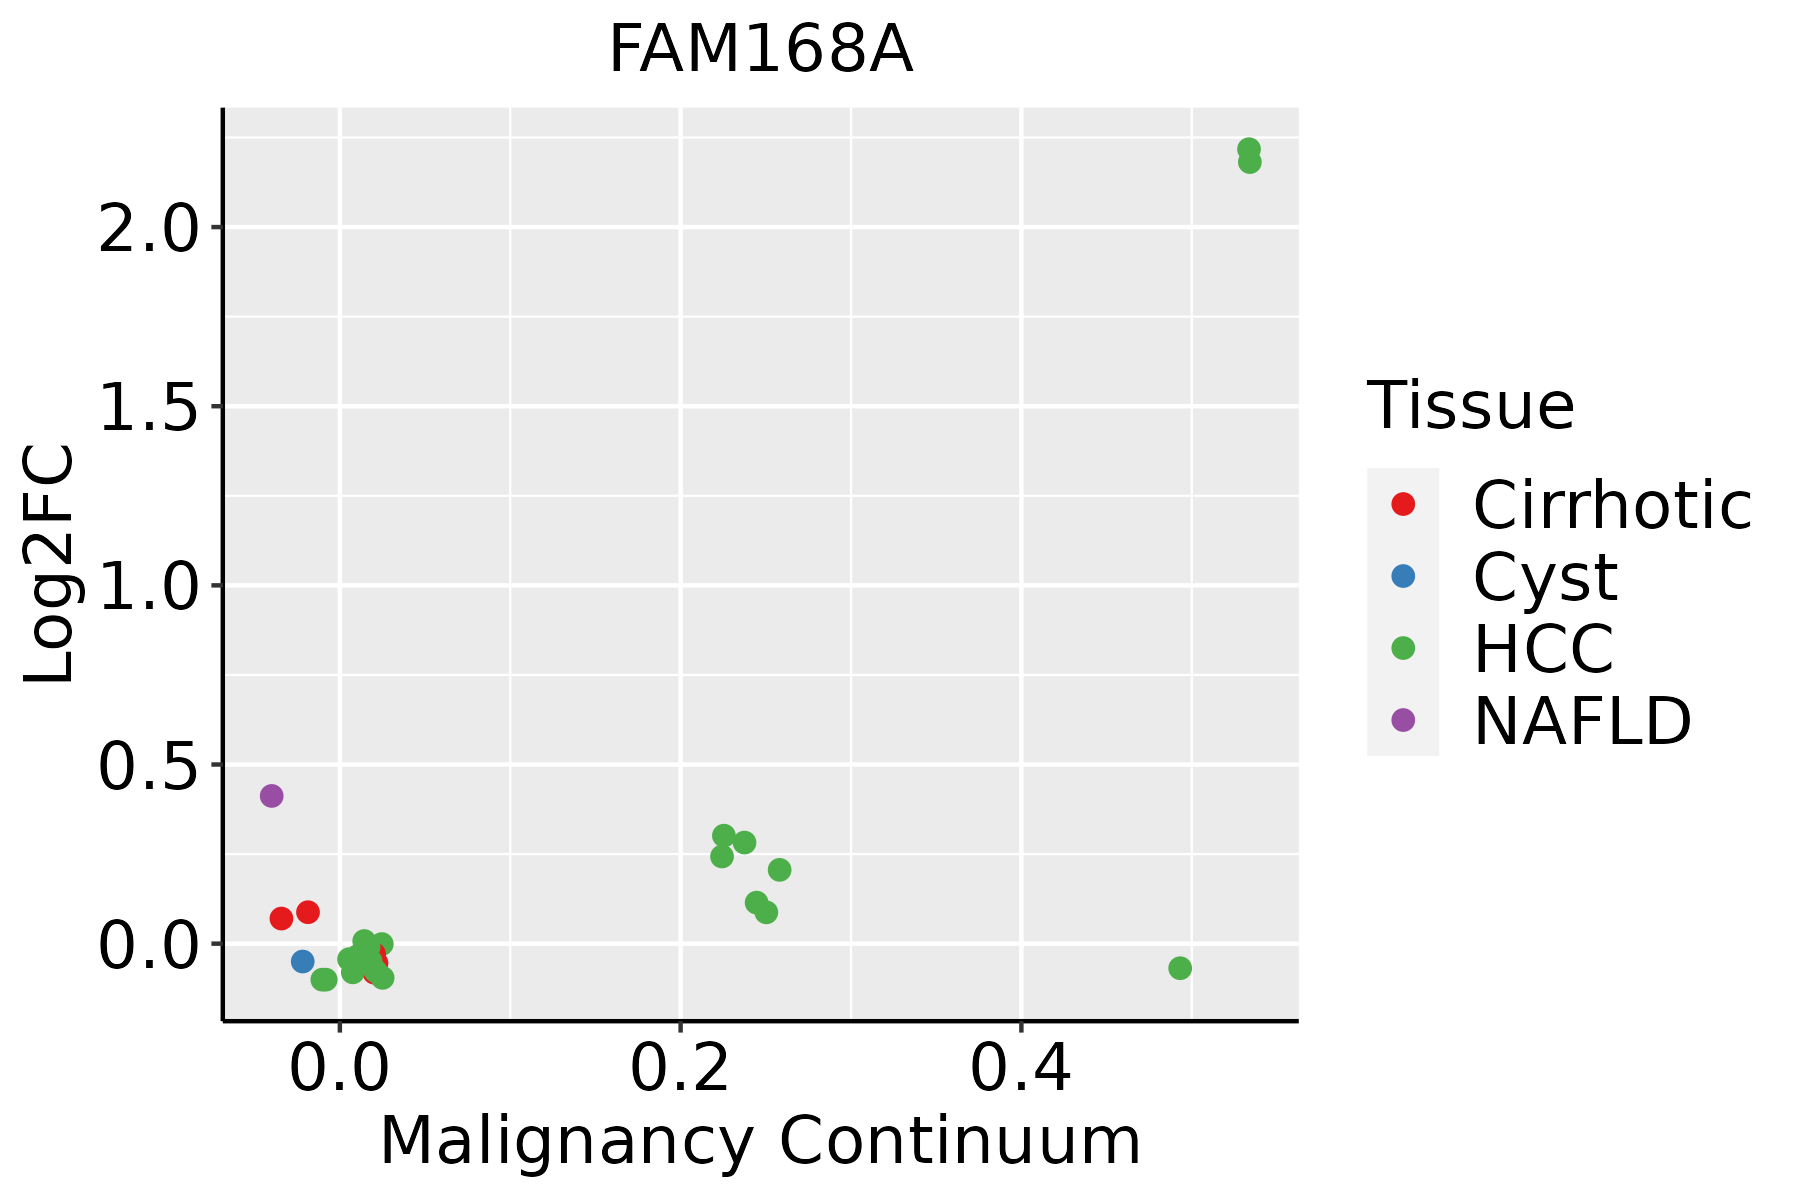 | HCC: Hepatocellular carcinoma |
| NAFLD: Non-alcoholic fatty liver disease |
| ∗log2FC in expression of this searched gene in stem-like cells from each diseased tissue sample relative to stem-like cells in normal samples in each tissue plotted against the malignancy continuum. Samples are colored based on if they are from different disease stage. |
Top |
Malignant transformation related pathway analysis |
| Find out the enriched GO biological processes and KEGG pathways involved in transition from healthy to precancer to cancer |
| Tissue | Disease Stage | Enriched GO biological Processes |
| Colorectum | AD |  |
| Colorectum | SER |  |
| Colorectum | MSS |  |
| Colorectum | MSI-H |  |
| Colorectum | FAP |  |
| ∗Top 15 enriched GO BP terms are showed in the bar plot of each disease state in each tissue. Each row represents a significant GO biological process which is colored according to the -log10(p.adjust). |
| Page: 1 2 3 4 5 6 7 8 9 |
| GO ID | Tissue | Disease Stage | Description | Gene Ratio | Bg Ratio | pvalue | p.adjust | Count |
| GO:200102010 | Endometrium | AEH | regulation of response to DNA damage stimulus | 40/2100 | 219/18723 | 1.28e-03 | 1.09e-02 | 40 |
| GO:00510549 | Endometrium | AEH | positive regulation of DNA metabolic process | 36/2100 | 201/18723 | 3.05e-03 | 2.16e-02 | 36 |
| GO:005105412 | Endometrium | EEC | positive regulation of DNA metabolic process | 38/2168 | 201/18723 | 1.55e-03 | 1.24e-02 | 38 |
| GO:200102014 | Endometrium | EEC | regulation of response to DNA damage stimulus | 40/2168 | 219/18723 | 2.30e-03 | 1.70e-02 | 40 |
| GO:005105215 | Esophagus | ESCC | regulation of DNA metabolic process | 232/8552 | 359/18723 | 2.40e-13 | 1.13e-11 | 232 |
| GO:005105417 | Esophagus | ESCC | positive regulation of DNA metabolic process | 139/8552 | 201/18723 | 1.20e-11 | 4.33e-10 | 139 |
| GO:2001020110 | Esophagus | ESCC | regulation of response to DNA damage stimulus | 145/8552 | 219/18723 | 5.97e-10 | 1.50e-08 | 145 |
| GO:20010228 | Esophagus | ESCC | positive regulation of response to DNA damage stimulus | 69/8552 | 105/18723 | 2.66e-05 | 2.22e-04 | 69 |
| GO:00062843 | Esophagus | ESCC | base-excision repair | 33/8552 | 43/18723 | 3.25e-05 | 2.69e-04 | 33 |
| GO:00062826 | Esophagus | ESCC | regulation of DNA repair | 82/8552 | 130/18723 | 4.65e-05 | 3.66e-04 | 82 |
| GO:00457395 | Esophagus | ESCC | positive regulation of DNA repair | 49/8552 | 73/18723 | 1.74e-04 | 1.14e-03 | 49 |
| GO:005105221 | Liver | HCC | regulation of DNA metabolic process | 198/7958 | 359/18723 | 7.62e-07 | 1.17e-05 | 198 |
| GO:200102021 | Liver | HCC | regulation of response to DNA damage stimulus | 128/7958 | 219/18723 | 1.31e-06 | 1.90e-05 | 128 |
| GO:005105411 | Liver | HCC | positive regulation of DNA metabolic process | 113/7958 | 201/18723 | 5.76e-05 | 5.33e-04 | 113 |
| GO:200102211 | Liver | HCC | positive regulation of response to DNA damage stimulus | 64/7958 | 105/18723 | 1.03e-04 | 8.88e-04 | 64 |
| GO:00062824 | Liver | HCC | regulation of DNA repair | 74/7958 | 130/18723 | 6.27e-04 | 3.89e-03 | 74 |
| GO:00457393 | Liver | HCC | positive regulation of DNA repair | 43/7958 | 73/18723 | 3.43e-03 | 1.55e-02 | 43 |
| GO:0006284 | Liver | HCC | base-excision repair | 27/7958 | 43/18723 | 5.79e-03 | 2.40e-02 | 27 |
| Page: 1 |
| Pathway ID | Tissue | Disease Stage | Description | Gene Ratio | Bg Ratio | pvalue | p.adjust | qvalue | Count |
| Page: 1 |
Top |
Cell-cell communication analysis |
| Identification of potential cell-cell interactions between two cell types and their ligand-receptor pairs for different disease states |
| Ligand | Receptor | LRpair | Pathway | Tissue | Disease Stage |
| Page: 1 |
Top |
Single-cell gene regulatory network inference analysis |
| Find out the significant the regulons (TFs) and the target genes of each regulon across cell types for different disease states |
| TF | Cell Type | Tissue | Disease Stage | Target Gene | RSS | Regulon Activity |
| ∗The dot plots of a searched regulon are shown for all cell subpopulations in each disease state of each tissue based on the regulon specific score inferred using pySCENIC and by calculating the average expression. |
| Page: 1 |
Top |
Somatic mutation of malignant transformation related genes |
| Annotation of somatic variants for genes involved in malignant transformation |
| Hugo Symbol | Variant Class | Variant Classification | dbSNP RS | HGVSc | HGVSp | HGVSp Short | SWISSPROT | BIOTYPE | SIFT | PolyPhen | Tumor Sample Barcode | Tissue | Histology | Sex | Age | Stage | Therapy Types | Drugs | Outcome |
| FAM168A | SNV | Missense_Mutation | c.411C>G | p.Ile137Met | p.I137M | Q92567 | protein_coding | tolerated(0.13) | possibly_damaging(0.654) | TCGA-EK-A2RJ-01 | Cervix | cervical & endocervical cancer | Female | <65 | I/II | Unknown | Unknown | SD | |
| FAM168A | SNV | Missense_Mutation | c.586N>T | p.Gly196Cys | p.G196C | Q92567 | protein_coding | deleterious(0) | probably_damaging(0.998) | TCGA-WS-AB45-01 | Colorectum | colon adenocarcinoma | Female | <65 | I/II | Unknown | Unknown | SD | |
| FAM168A | SNV | Missense_Mutation | rs200934649 | c.338N>T | p.Pro113Leu | p.P113L | Q92567 | protein_coding | tolerated(0.18) | possibly_damaging(0.572) | TCGA-AH-6544-01 | Colorectum | rectum adenocarcinoma | Male | <65 | III/IV | Chemotherapy | oxaliplatin | SD |
| FAM168A | deletion | Frame_Shift_Del | novel | c.725delN | p.Pro242HisfsTer31 | p.P242Hfs*31 | Q92567 | protein_coding | TCGA-AA-3877-01 | Colorectum | colon adenocarcinoma | Female | >=65 | I/II | Unknown | Unknown | SD | ||
| FAM168A | SNV | Missense_Mutation | novel | c.118N>A | p.Leu40Met | p.L40M | Q92567 | protein_coding | tolerated(1) | benign(0.003) | TCGA-A5-A0G2-01 | Endometrium | uterine corpus endometrioid carcinoma | Female | <65 | III/IV | Unknown | Unknown | SD |
| FAM168A | SNV | Missense_Mutation | rs568533341 | c.68N>T | p.Thr23Met | p.T23M | Q92567 | protein_coding | deleterious(0) | possibly_damaging(0.725) | TCGA-A5-A0G2-01 | Endometrium | uterine corpus endometrioid carcinoma | Female | <65 | III/IV | Unknown | Unknown | SD |
| FAM168A | SNV | Missense_Mutation | rs768181792 | c.275N>A | p.Arg92Gln | p.R92Q | Q92567 | protein_coding | tolerated_low_confidence(0.43) | probably_damaging(0.947) | TCGA-AX-A2HC-01 | Endometrium | uterine corpus endometrioid carcinoma | Female | <65 | III/IV | Chemotherapy | paclitaxel | PD |
| FAM168A | SNV | Missense_Mutation | rs752569750 | c.718G>A | p.Val240Met | p.V240M | Q92567 | protein_coding | deleterious_low_confidence(0.03) | probably_damaging(0.987) | TCGA-B5-A11W-01 | Endometrium | uterine corpus endometrioid carcinoma | Female | <65 | I/II | Unknown | Unknown | SD |
| FAM168A | SNV | Missense_Mutation | rs367570839 | c.653N>T | p.Ala218Val | p.A218V | Q92567 | protein_coding | deleterious(0.02) | benign(0.029) | TCGA-B5-A3FA-01 | Endometrium | uterine corpus endometrioid carcinoma | Female | >=65 | I/II | Unknown | Unknown | SD |
| FAM168A | SNV | Missense_Mutation | c.268G>A | p.Glu90Lys | p.E90K | Q92567 | protein_coding | tolerated_low_confidence(0.4) | probably_damaging(0.956) | TCGA-BG-A0VZ-01 | Endometrium | uterine corpus endometrioid carcinoma | Female | <65 | III/IV | Chemotherapy | cisplatin | CR |
| Page: 1 2 |
Top |
Related drugs of malignant transformation related genes |
| Identification of chemicals and drugs interact with genes involved in malignant transfromation |
| (DGIdb 4.0) |
| Entrez ID | Symbol | Category | Interaction Types | Drug Claim Name | Drug Name | PMIDs |
| Page: 1 |

Copyright 2023-Present -The University of Texas Health Science Center at Houston |