| Tissue | Expression Dynamics | Abbreviation |
| Breast | 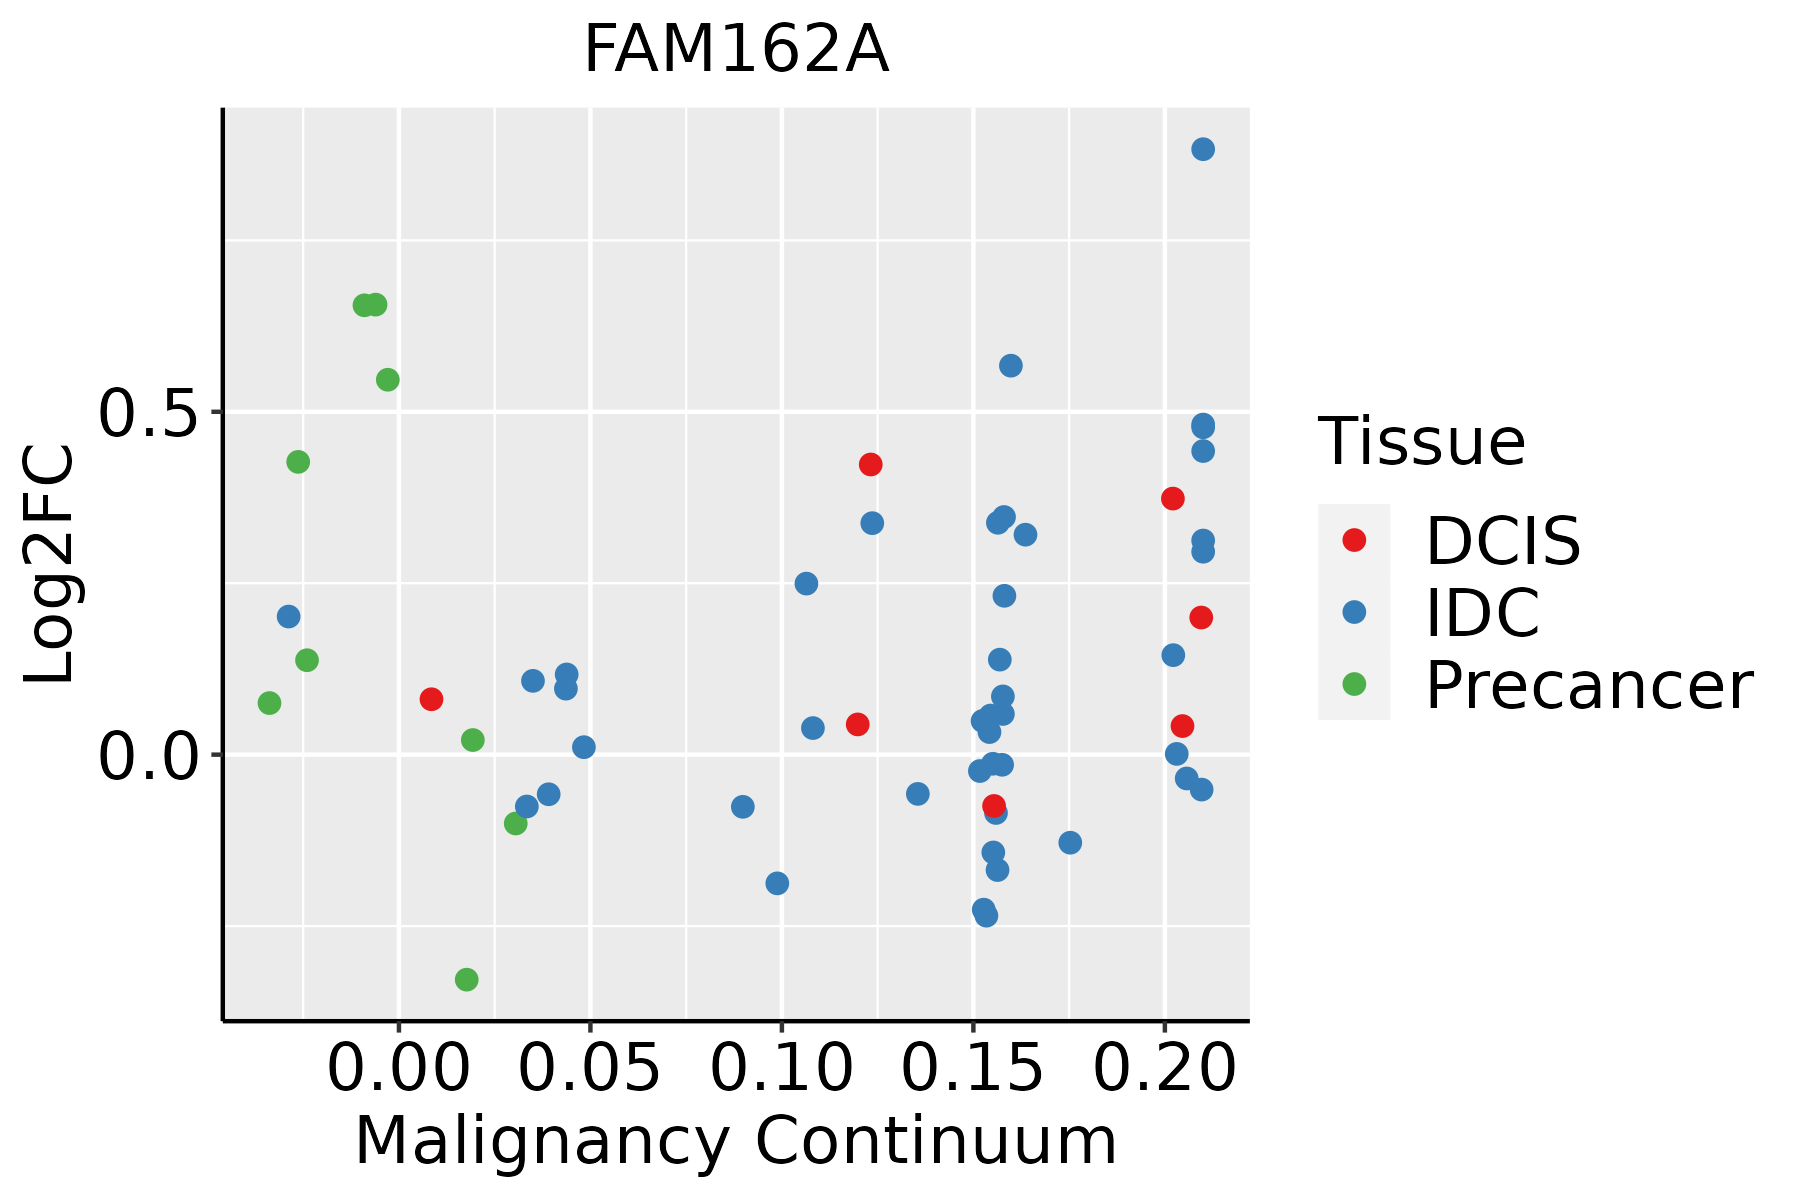 | IDC: Invasive ductal carcinoma |
| DCIS: Ductal carcinoma in situ |
| Precancer(BRCA1-mut): Precancerous lesion from BRCA1 mutation carriers |
| Cervix | 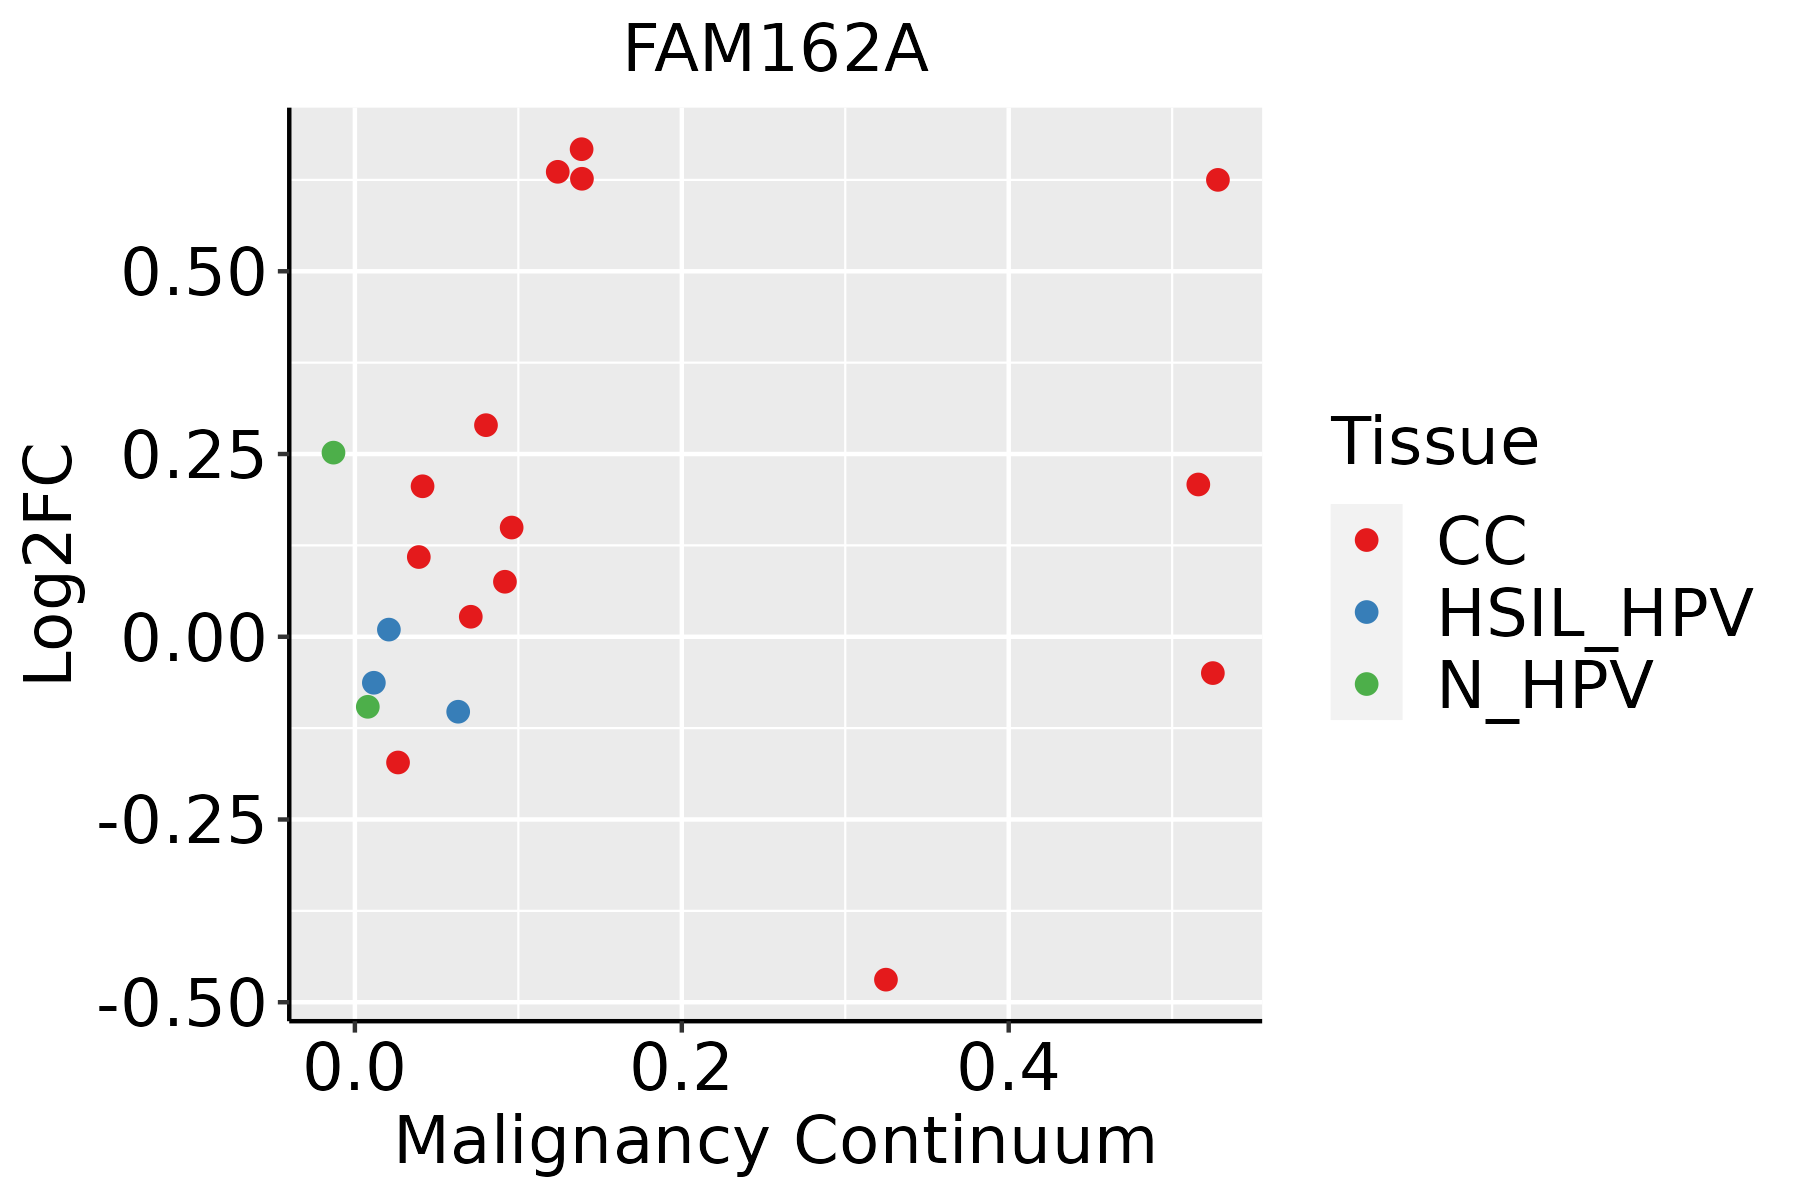 | CC: Cervix cancer |
| HSIL_HPV: HPV-infected high-grade squamous intraepithelial lesions |
| N_HPV: HPV-infected normal cervix |
| Colorectum (GSE201348) | 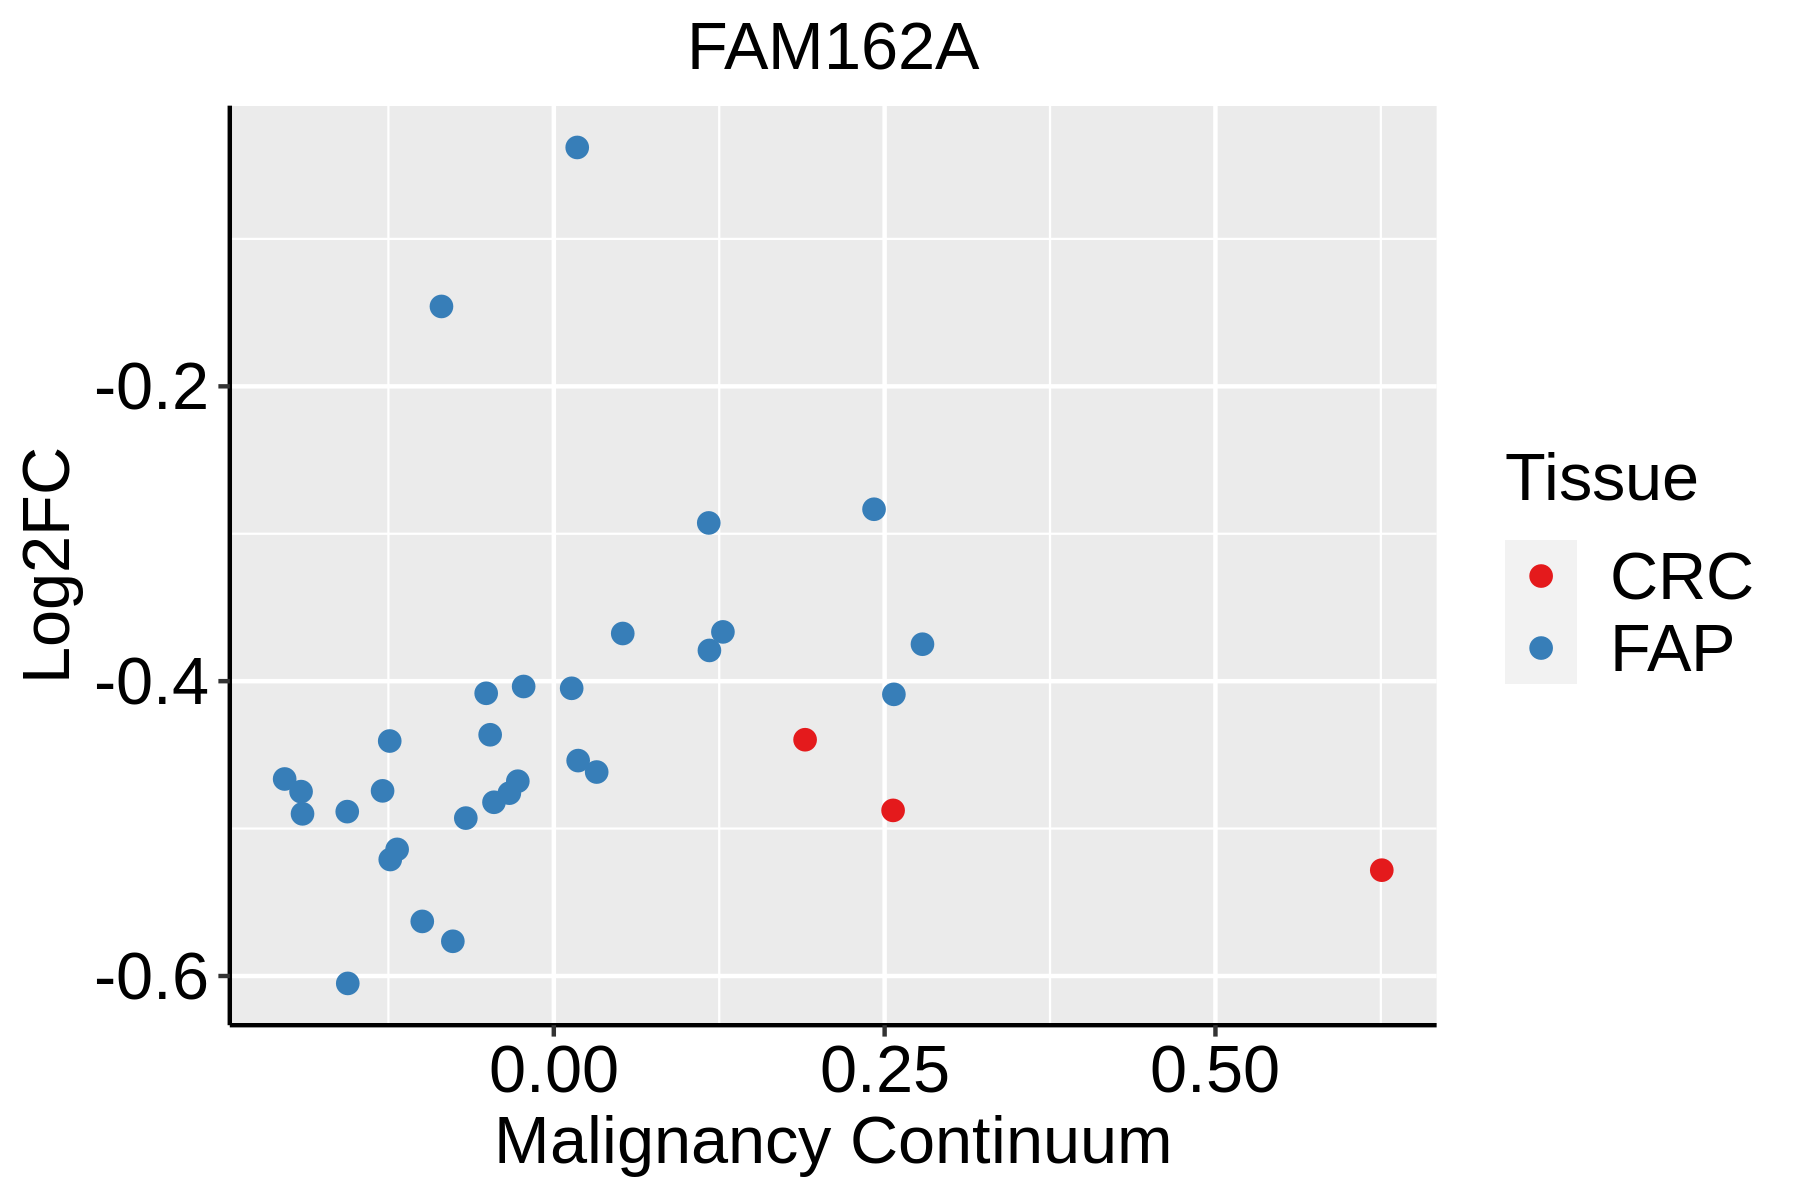 | FAP: Familial adenomatous polyposis |
| CRC: Colorectal cancer |
| Colorectum (HTA11) |  | AD: Adenomas |
| SER: Sessile serrated lesions |
| MSI-H: Microsatellite-high colorectal cancer |
| MSS: Microsatellite stable colorectal cancer |
| Esophagus | 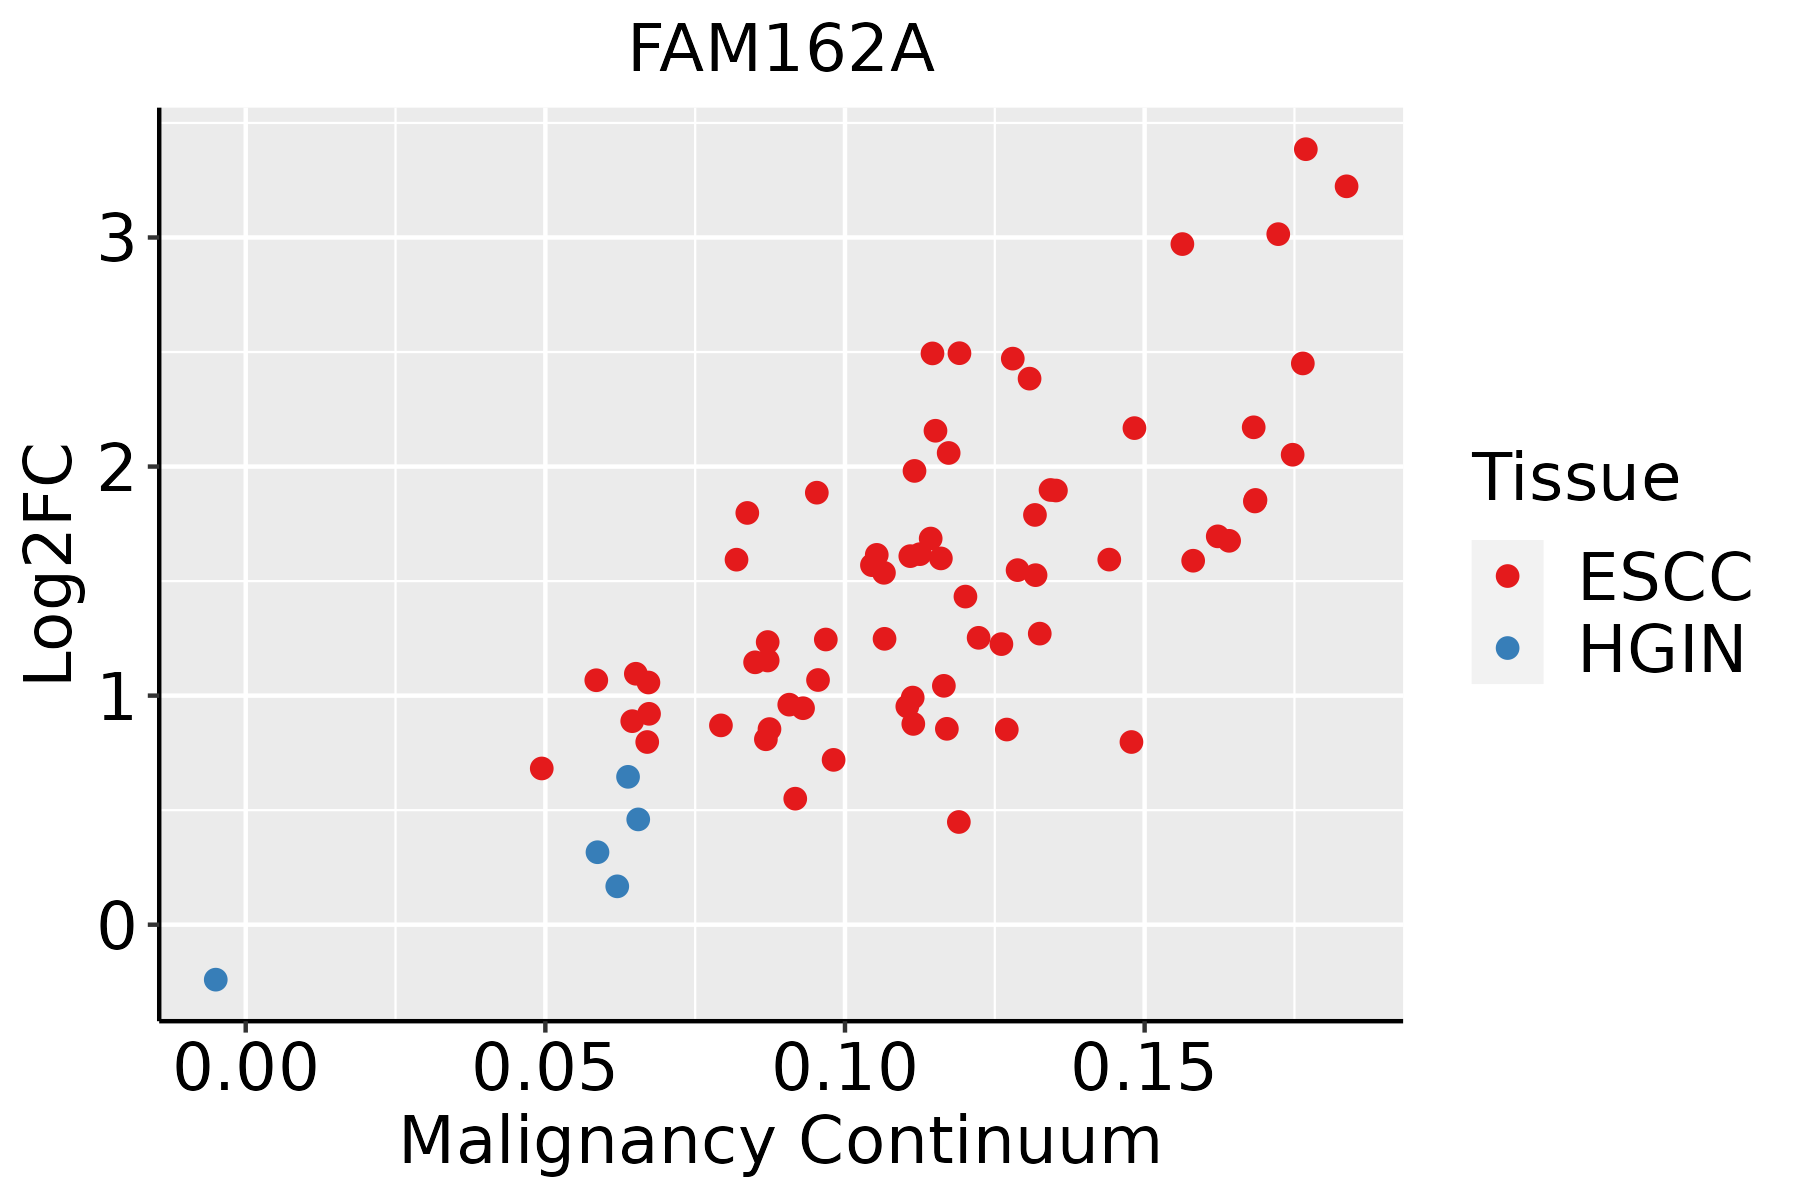 | ESCC: Esophageal squamous cell carcinoma |
| HGIN: High-grade intraepithelial neoplasias |
| LGIN: Low-grade intraepithelial neoplasias |
| Liver | 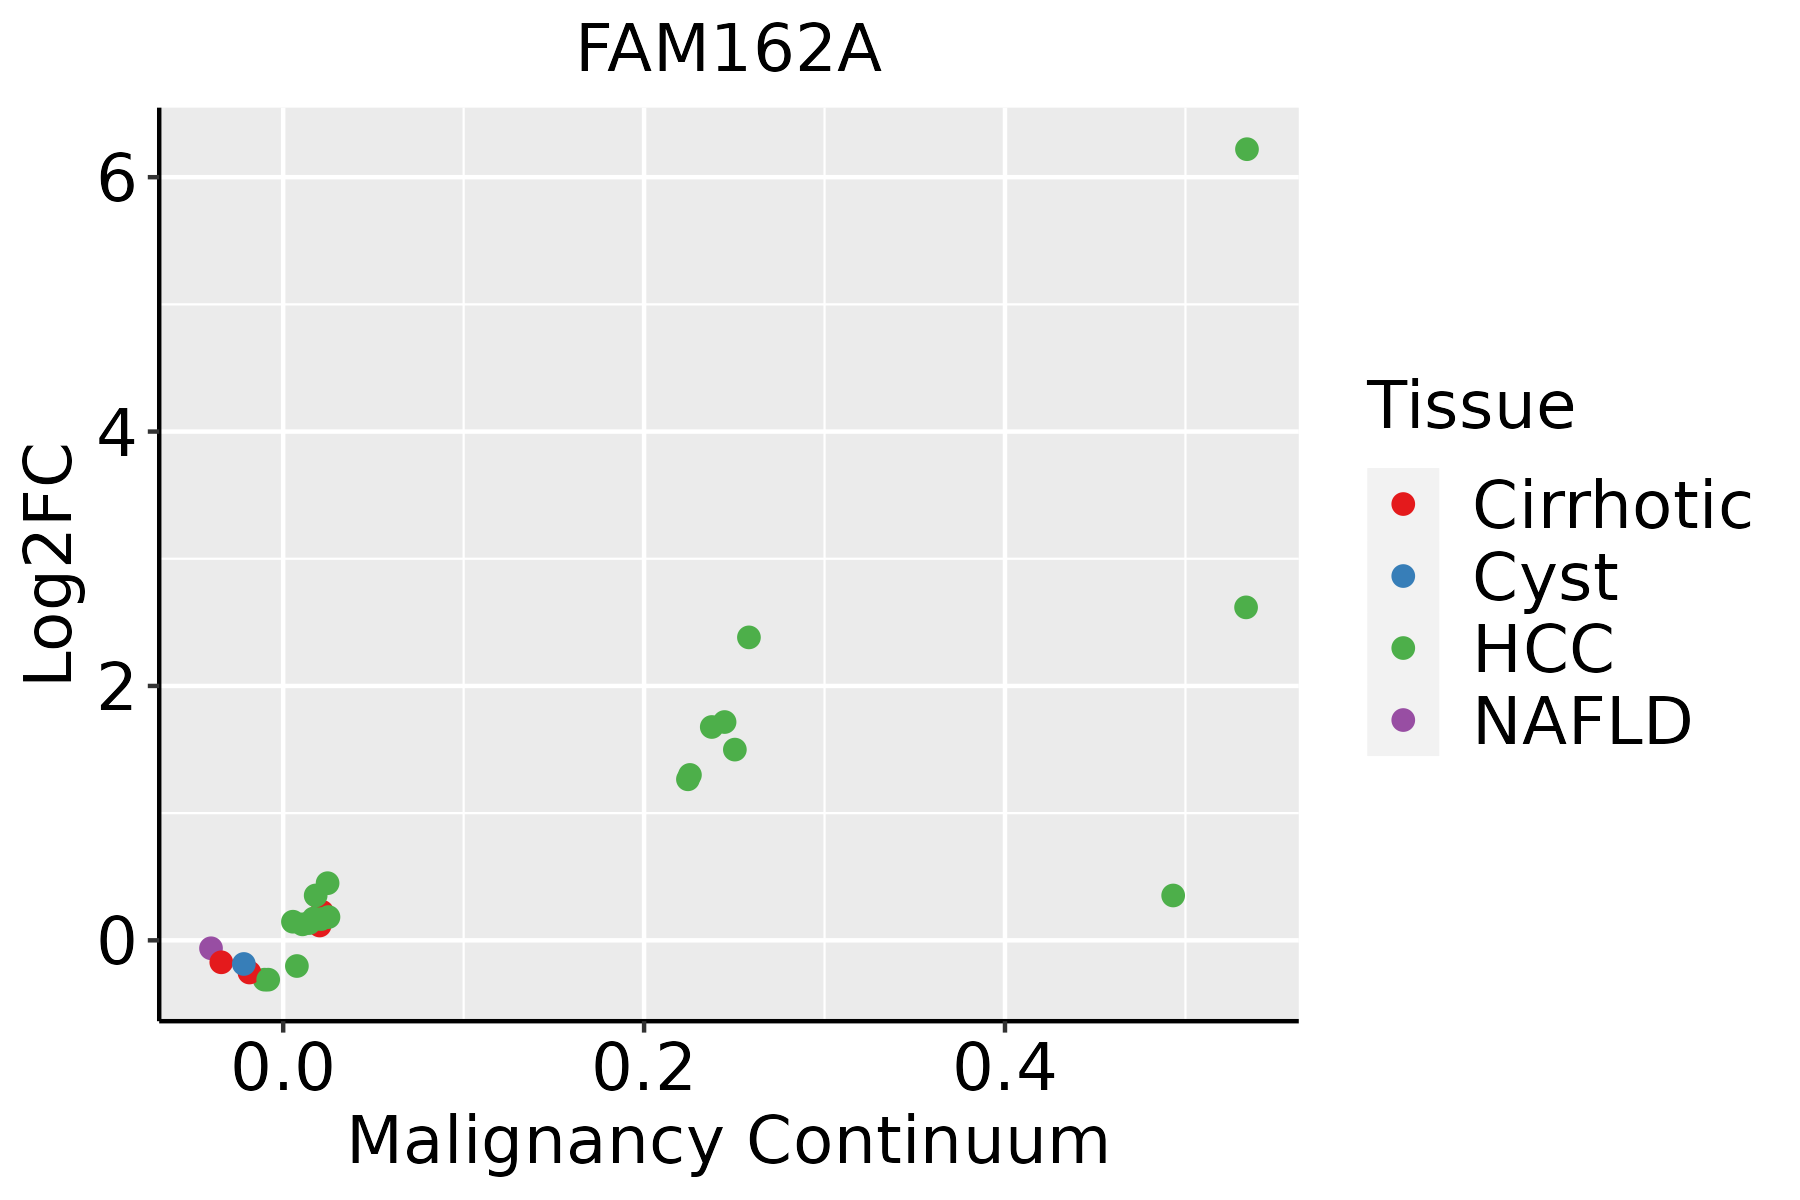 | HCC: Hepatocellular carcinoma |
| NAFLD: Non-alcoholic fatty liver disease |
| Oral Cavity | 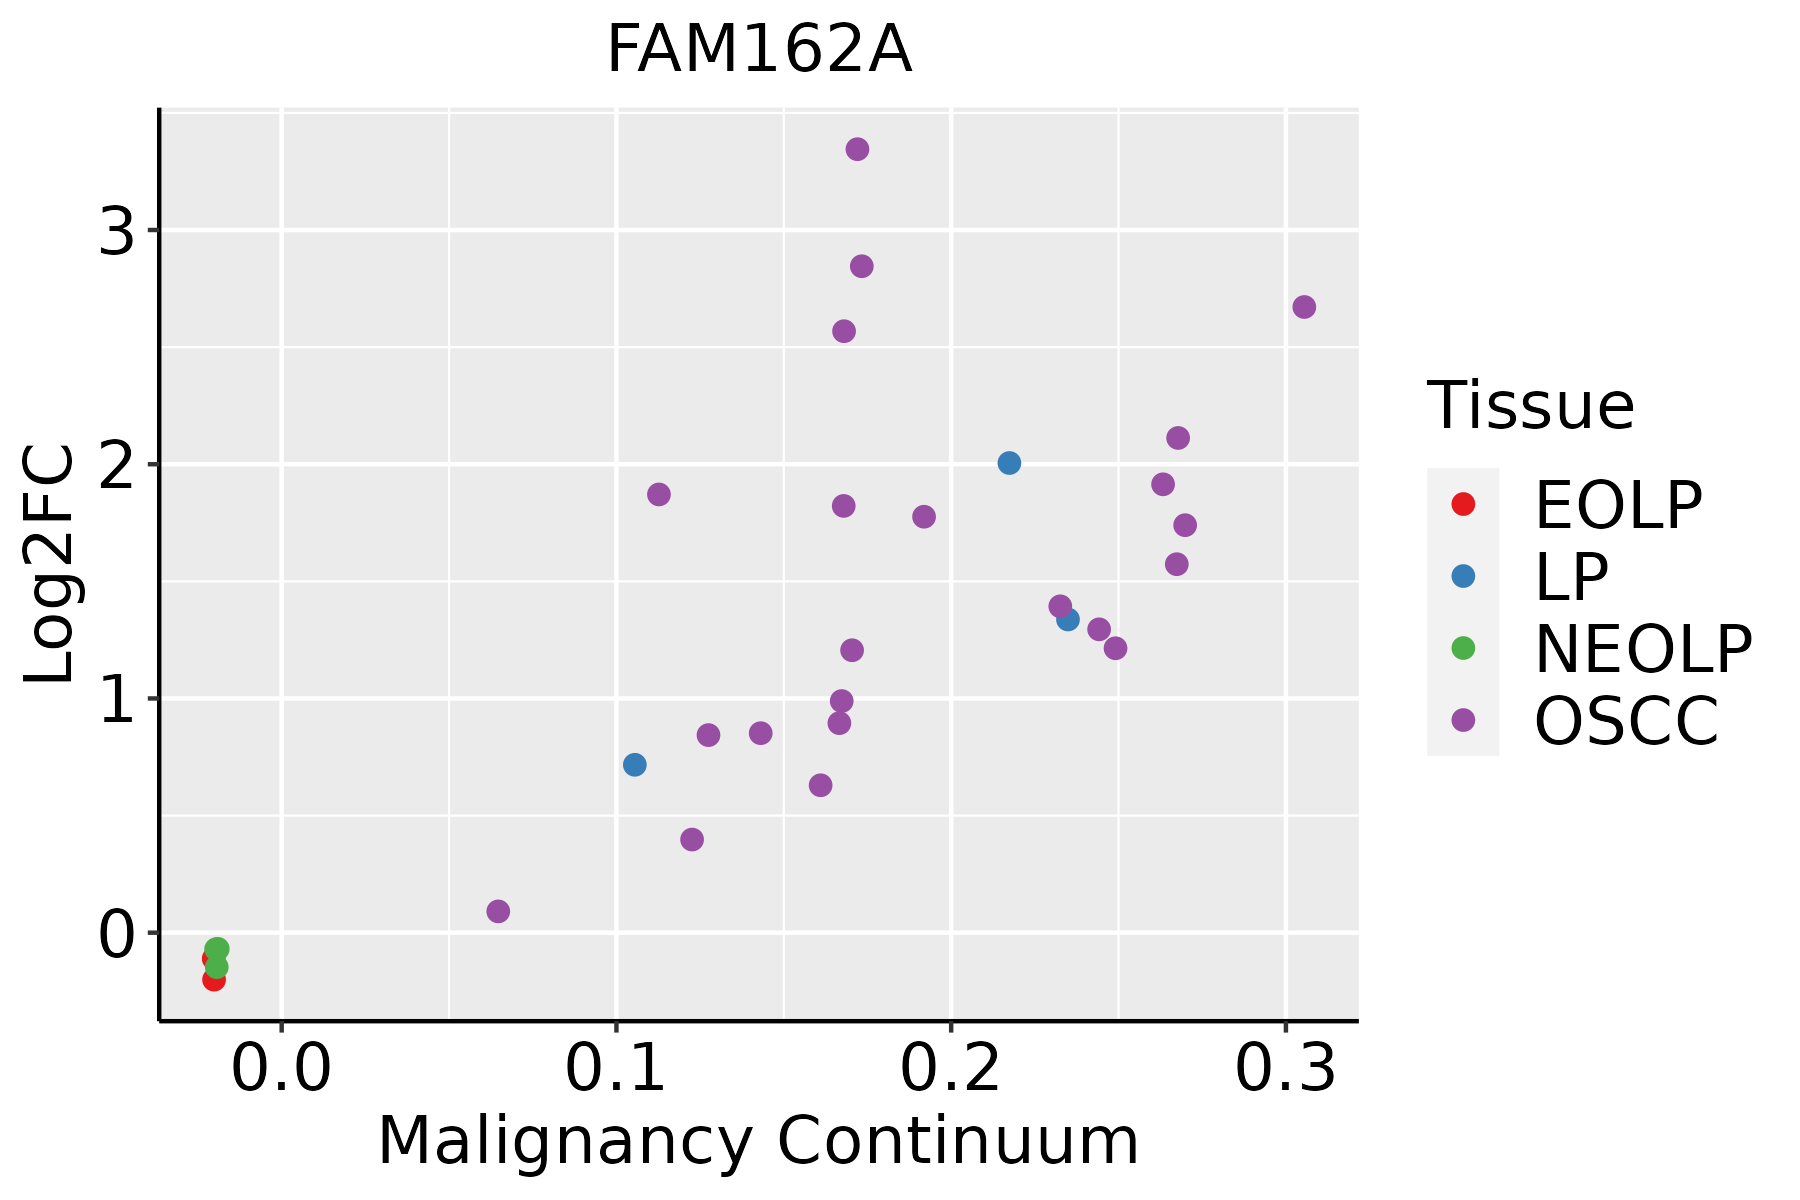 | EOLP: Erosive Oral lichen planus |
| LP: leukoplakia |
| NEOLP: Non-erosive oral lichen planus |
| OSCC: Oral squamous cell carcinoma |
| Prostate |  | BPH: Benign Prostatic Hyperplasia |
| Skin | 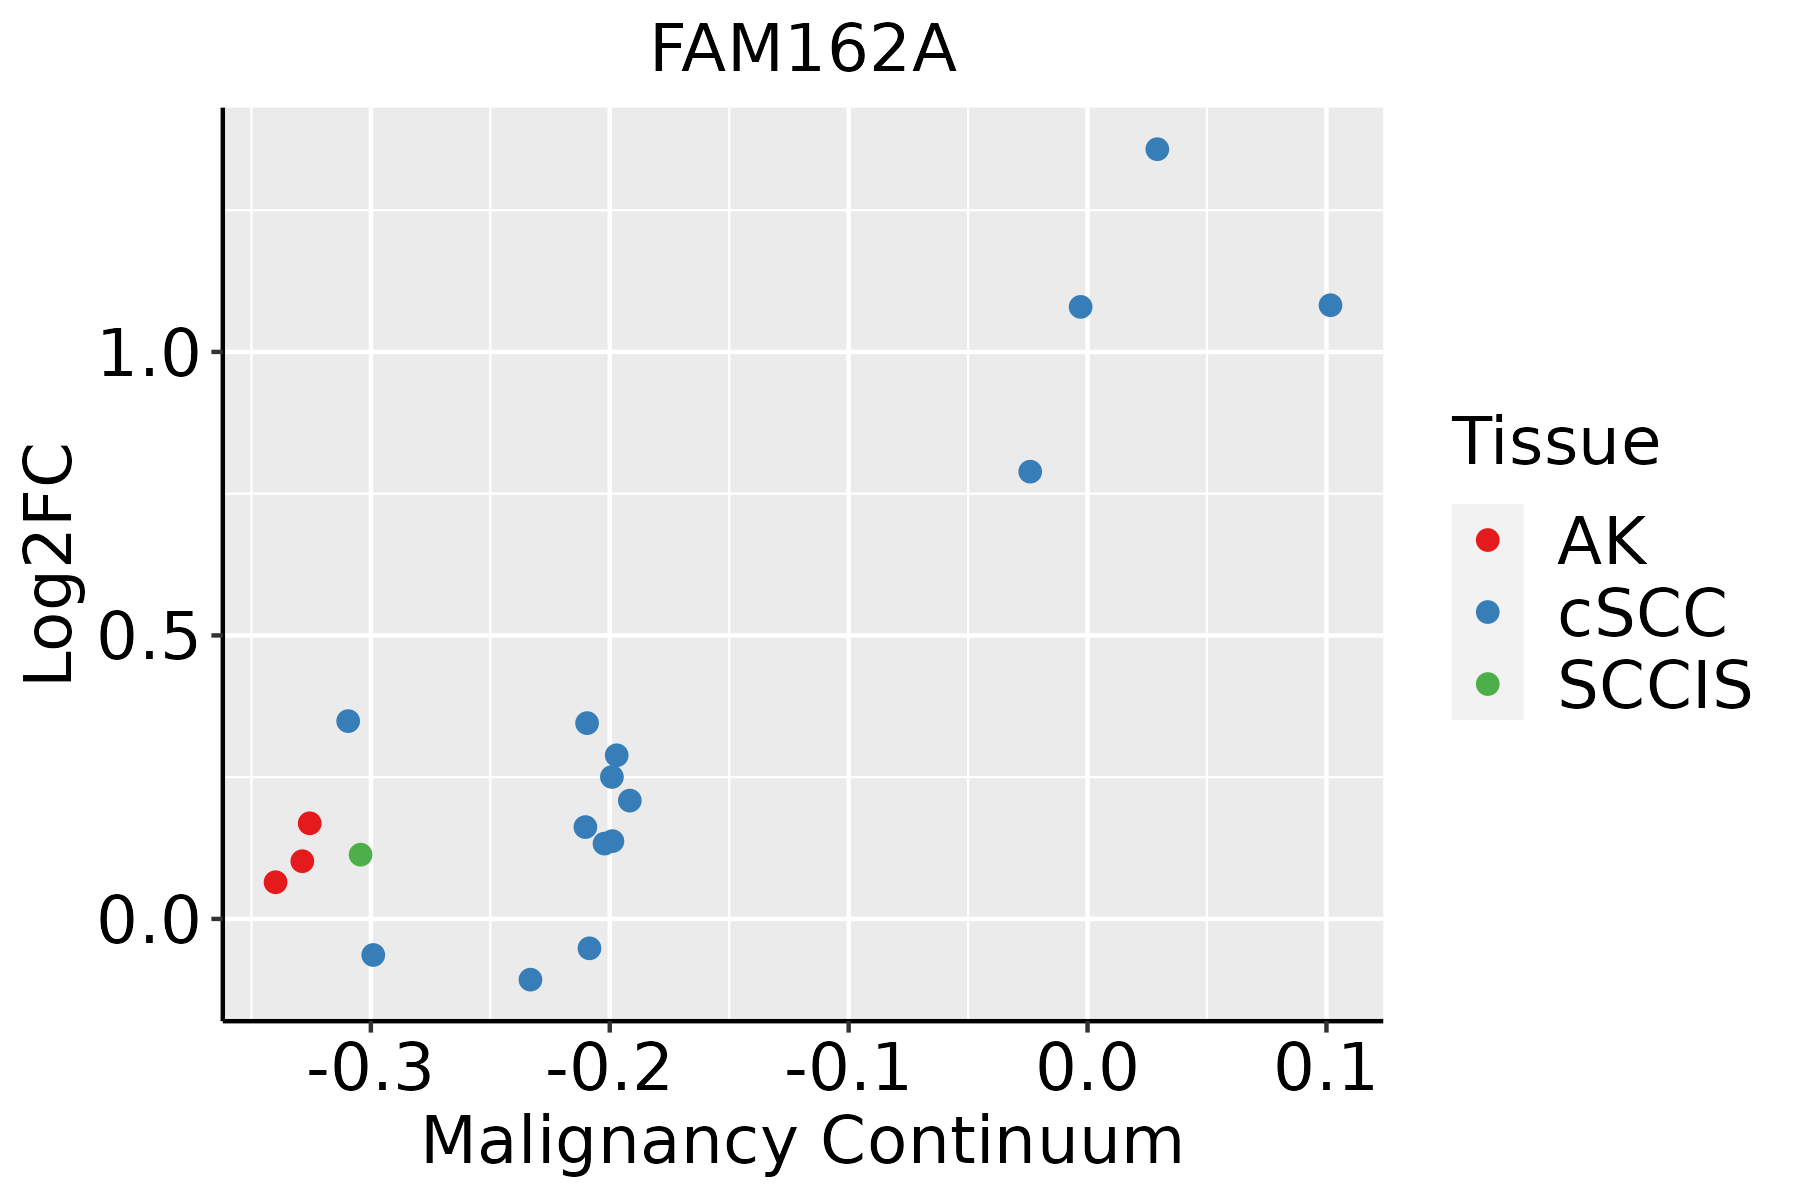 | AK: Actinic keratosis |
| cSCC: Cutaneous squamous cell carcinoma |
| SCCIS:squamous cell carcinoma in situ |
| Thyroid |  | ATC: Anaplastic thyroid cancer |
| HT: Hashimoto's thyroiditis |
| PTC: Papillary thyroid cancer |
| GO ID | Tissue | Disease Stage | Description | Gene Ratio | Bg Ratio | pvalue | p.adjust | Count |
| GO:00525479 | Breast | Precancer | regulation of peptidase activity | 71/1080 | 461/18723 | 2.72e-14 | 6.94e-12 | 71 |
| GO:00525489 | Breast | Precancer | regulation of endopeptidase activity | 67/1080 | 432/18723 | 1.06e-13 | 2.36e-11 | 67 |
| GO:00362939 | Breast | Precancer | response to decreased oxygen levels | 53/1080 | 322/18723 | 4.09e-12 | 6.84e-10 | 53 |
| GO:00016669 | Breast | Precancer | response to hypoxia | 51/1080 | 307/18723 | 7.33e-12 | 1.11e-09 | 51 |
| GO:00704829 | Breast | Precancer | response to oxygen levels | 55/1080 | 347/18723 | 7.47e-12 | 1.11e-09 | 55 |
| GO:20001169 | Breast | Precancer | regulation of cysteine-type endopeptidase activity | 43/1080 | 235/18723 | 1.30e-11 | 1.83e-09 | 43 |
| GO:00432819 | Breast | Precancer | regulation of cysteine-type endopeptidase activity involved in apoptotic process | 40/1080 | 209/18723 | 1.59e-11 | 2.07e-09 | 40 |
| GO:00362948 | Breast | Precancer | cellular response to decreased oxygen levels | 31/1080 | 161/18723 | 2.61e-09 | 2.11e-07 | 31 |
| GO:00714538 | Breast | Precancer | cellular response to oxygen levels | 32/1080 | 177/18723 | 7.32e-09 | 5.52e-07 | 32 |
| GO:00709979 | Breast | Precancer | neuron death | 50/1080 | 361/18723 | 7.75e-09 | 5.70e-07 | 50 |
| GO:00458629 | Breast | Precancer | positive regulation of proteolysis | 51/1080 | 372/18723 | 7.77e-09 | 5.70e-07 | 51 |
| GO:00714565 | Breast | Precancer | cellular response to hypoxia | 29/1080 | 151/18723 | 8.98e-09 | 6.50e-07 | 29 |
| GO:00514029 | Breast | Precancer | neuron apoptotic process | 38/1080 | 246/18723 | 2.68e-08 | 1.75e-06 | 38 |
| GO:00109529 | Breast | Precancer | positive regulation of peptidase activity | 33/1080 | 197/18723 | 3.01e-08 | 1.89e-06 | 33 |
| GO:00086378 | Breast | Precancer | apoptotic mitochondrial changes | 23/1080 | 107/18723 | 3.44e-08 | 2.12e-06 | 23 |
| GO:00432808 | Breast | Precancer | positive regulation of cysteine-type endopeptidase activity involved in apoptotic process | 24/1080 | 129/18723 | 3.13e-07 | 1.50e-05 | 24 |
| GO:00109509 | Breast | Precancer | positive regulation of endopeptidase activity | 29/1080 | 179/18723 | 4.23e-07 | 1.90e-05 | 29 |
| GO:20010568 | Breast | Precancer | positive regulation of cysteine-type endopeptidase activity | 25/1080 | 148/18723 | 1.19e-06 | 4.60e-05 | 25 |
| GO:00018367 | Breast | Precancer | release of cytochrome c from mitochondria | 14/1080 | 59/18723 | 4.80e-06 | 1.47e-04 | 14 |
| GO:00069193 | Breast | Precancer | activation of cysteine-type endopeptidase activity involved in apoptotic process | 14/1080 | 78/18723 | 1.33e-04 | 2.31e-03 | 14 |
| Hugo Symbol | Variant Class | Variant Classification | dbSNP RS | HGVSc | HGVSp | HGVSp Short | SWISSPROT | BIOTYPE | SIFT | PolyPhen | Tumor Sample Barcode | Tissue | Histology | Sex | Age | Stage | Therapy Types | Drugs | Outcome |
| FAM162A | SNV | Missense_Mutation | novel | c.392N>T | p.Thr131Ile | p.T131I | Q96A26 | protein_coding | deleterious(0) | benign(0.037) | TCGA-AN-A046-01 | Breast | breast invasive carcinoma | Female | >=65 | I/II | Unknown | Unknown | SD |
| FAM162A | SNV | Missense_Mutation | | c.175N>T | p.Pro59Ser | p.P59S | Q96A26 | protein_coding | deleterious(0) | probably_damaging(0.926) | TCGA-BH-A18G-01 | Breast | breast invasive carcinoma | Female | >=65 | I/II | Unknown | Unknown | SD |
| FAM162A | SNV | Missense_Mutation | | c.102N>C | p.Leu34Phe | p.L34F | Q96A26 | protein_coding | tolerated(0.07) | benign(0.037) | TCGA-D8-A1JN-01 | Breast | breast invasive carcinoma | Female | >=65 | III/IV | Hormone Therapy | anastrozolum | SD |
| FAM162A | SNV | Missense_Mutation | | c.107G>T | p.Arg36Ile | p.R36I | Q96A26 | protein_coding | tolerated(0.55) | benign(0.003) | TCGA-2W-A8YY-01 | Cervix | cervical & endocervical cancer | Female | <65 | I/II | Chemotherapy | cisplatin | CR |
| FAM162A | SNV | Missense_Mutation | | c.452N>T | p.Ala151Val | p.A151V | Q96A26 | protein_coding | deleterious(0) | possibly_damaging(0.795) | TCGA-AA-A01P-01 | Colorectum | colon adenocarcinoma | Female | >=65 | III/IV | Unknown | Unknown | PD |
| FAM162A | SNV | Missense_Mutation | novel | c.402N>A | p.Ser134Arg | p.S134R | Q96A26 | protein_coding | tolerated(0.08) | benign(0.017) | TCGA-A5-A0G1-01 | Endometrium | uterine corpus endometrioid carcinoma | Female | >=65 | I/II | Unknown | Unknown | SD |
| FAM162A | SNV | Missense_Mutation | rs149572114 | c.227N>A | p.Arg76His | p.R76H | Q96A26 | protein_coding | tolerated(0.15) | benign(0.146) | TCGA-AP-A0LM-01 | Endometrium | uterine corpus endometrioid carcinoma | Female | <65 | III/IV | Chemotherapy | cisplatin | SD |
| FAM162A | SNV | Missense_Mutation | | c.107N>A | p.Arg36Lys | p.R36K | Q96A26 | protein_coding | tolerated(0.52) | benign(0.122) | TCGA-AX-A0J0-01 | Endometrium | uterine corpus endometrioid carcinoma | Female | <65 | I/II | Unknown | Unknown | SD |
| FAM162A | SNV | Missense_Mutation | novel | c.451N>A | p.Ala151Thr | p.A151T | Q96A26 | protein_coding | deleterious(0) | possibly_damaging(0.589) | TCGA-DF-A2KN-01 | Endometrium | uterine corpus endometrioid carcinoma | Female | Unknown | I/II | Unknown | Unknown | SD |
| FAM162A | SNV | Missense_Mutation | novel | c.299G>A | p.Arg100Gln | p.R100Q | Q96A26 | protein_coding | deleterious(0.03) | probably_damaging(0.971) | TCGA-E6-A1LX-01 | Endometrium | uterine corpus endometrioid carcinoma | Female | <65 | I/II | Unknown | Unknown | SD |


