
|
|||||
|
 | |
| |
| |
| |
| |
| |
|
Gene: FAM161A |
Gene summary for FAM161A |
| Gene information | Species | Human | Gene symbol | FAM161A | Gene ID | 84140 |
| Gene name | FAM161 centrosomal protein A | |
| Gene Alias | RP28 | |
| Cytomap | 2p15 | |
| Gene Type | protein-coding | GO ID | GO:0003008 | UniProtAcc | Q3B820 |
Top |
Malignant transformation analysis |
| Identification of the aberrant gene expression in precancerous and cancerous lesions by comparing the gene expression of stem-like cells in diseased tissues with normal stem cells |
| Entrez ID | Symbol | Replicates | Species | Organ | Tissue | Adj P-value | Log2FC | Malignancy |
| 84140 | FAM161A | LZE4T | Human | Esophagus | ESCC | 2.62e-09 | 3.12e-01 | 0.0811 |
| 84140 | FAM161A | LZE7T | Human | Esophagus | ESCC | 3.85e-04 | 2.78e-01 | 0.0667 |
| 84140 | FAM161A | LZE21T | Human | Esophagus | ESCC | 8.32e-05 | 2.31e-01 | 0.0655 |
| 84140 | FAM161A | P1T-E | Human | Esophagus | ESCC | 3.36e-04 | 3.07e-01 | 0.0875 |
| 84140 | FAM161A | P2T-E | Human | Esophagus | ESCC | 9.57e-28 | 5.90e-01 | 0.1177 |
| 84140 | FAM161A | P4T-E | Human | Esophagus | ESCC | 1.30e-08 | 3.05e-01 | 0.1323 |
| 84140 | FAM161A | P5T-E | Human | Esophagus | ESCC | 6.31e-07 | 1.04e-01 | 0.1327 |
| 84140 | FAM161A | P8T-E | Human | Esophagus | ESCC | 2.86e-03 | 1.54e-01 | 0.0889 |
| 84140 | FAM161A | P10T-E | Human | Esophagus | ESCC | 2.65e-19 | 3.96e-01 | 0.116 |
| 84140 | FAM161A | P11T-E | Human | Esophagus | ESCC | 1.05e-07 | 3.39e-01 | 0.1426 |
| 84140 | FAM161A | P12T-E | Human | Esophagus | ESCC | 1.32e-16 | 3.73e-01 | 0.1122 |
| 84140 | FAM161A | P15T-E | Human | Esophagus | ESCC | 2.58e-08 | 2.45e-01 | 0.1149 |
| 84140 | FAM161A | P16T-E | Human | Esophagus | ESCC | 2.67e-13 | 3.22e-01 | 0.1153 |
| 84140 | FAM161A | P21T-E | Human | Esophagus | ESCC | 3.28e-02 | 1.16e-01 | 0.1617 |
| 84140 | FAM161A | P22T-E | Human | Esophagus | ESCC | 2.49e-10 | 1.87e-01 | 0.1236 |
| 84140 | FAM161A | P23T-E | Human | Esophagus | ESCC | 4.59e-02 | 1.18e-01 | 0.108 |
| 84140 | FAM161A | P24T-E | Human | Esophagus | ESCC | 4.84e-03 | 6.55e-02 | 0.1287 |
| 84140 | FAM161A | P26T-E | Human | Esophagus | ESCC | 8.88e-16 | 4.06e-01 | 0.1276 |
| 84140 | FAM161A | P27T-E | Human | Esophagus | ESCC | 8.90e-14 | 3.65e-01 | 0.1055 |
| 84140 | FAM161A | P28T-E | Human | Esophagus | ESCC | 1.18e-10 | 3.21e-01 | 0.1149 |
| Page: 1 2 3 4 |
| Tissue | Expression Dynamics | Abbreviation |
| Esophagus |  | ESCC: Esophageal squamous cell carcinoma |
| HGIN: High-grade intraepithelial neoplasias | ||
| LGIN: Low-grade intraepithelial neoplasias | ||
| Liver | 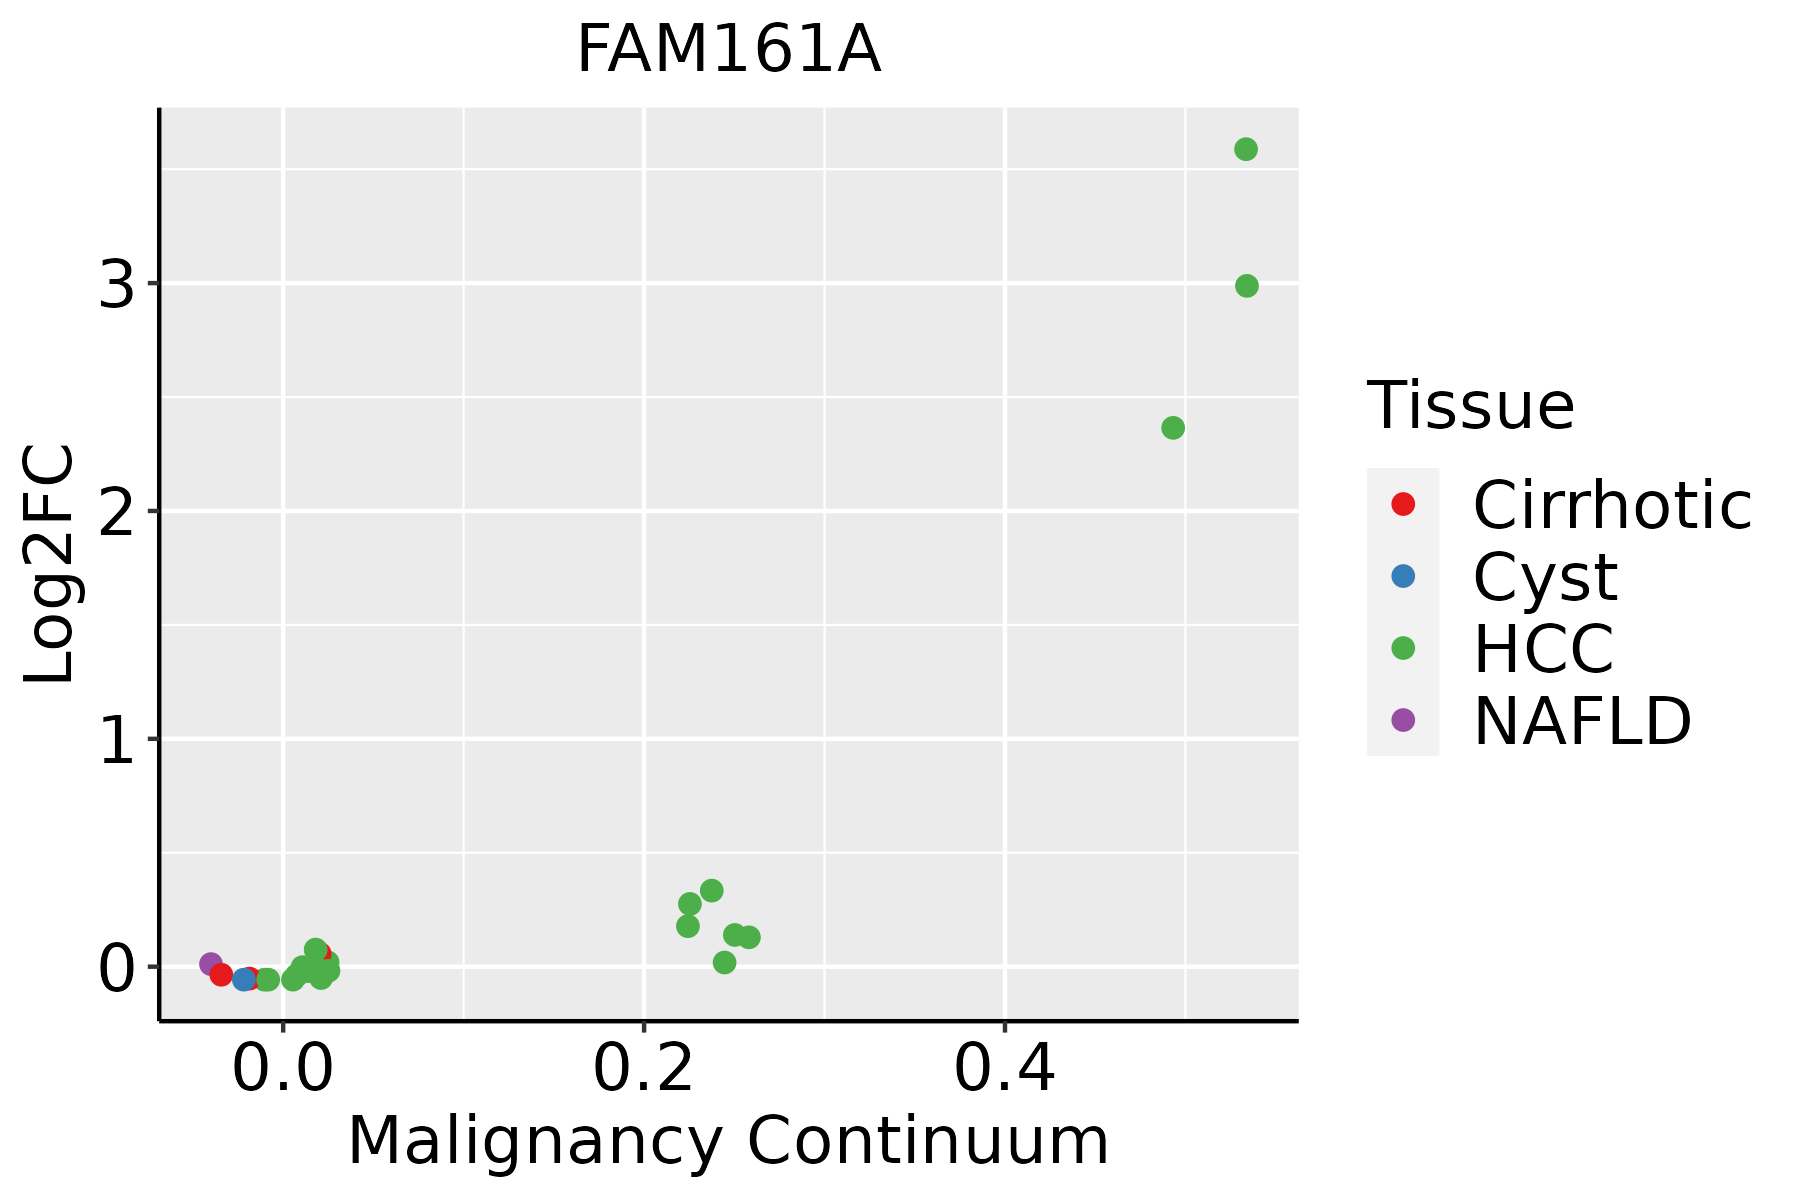 | HCC: Hepatocellular carcinoma |
| NAFLD: Non-alcoholic fatty liver disease | ||
| Thyroid | 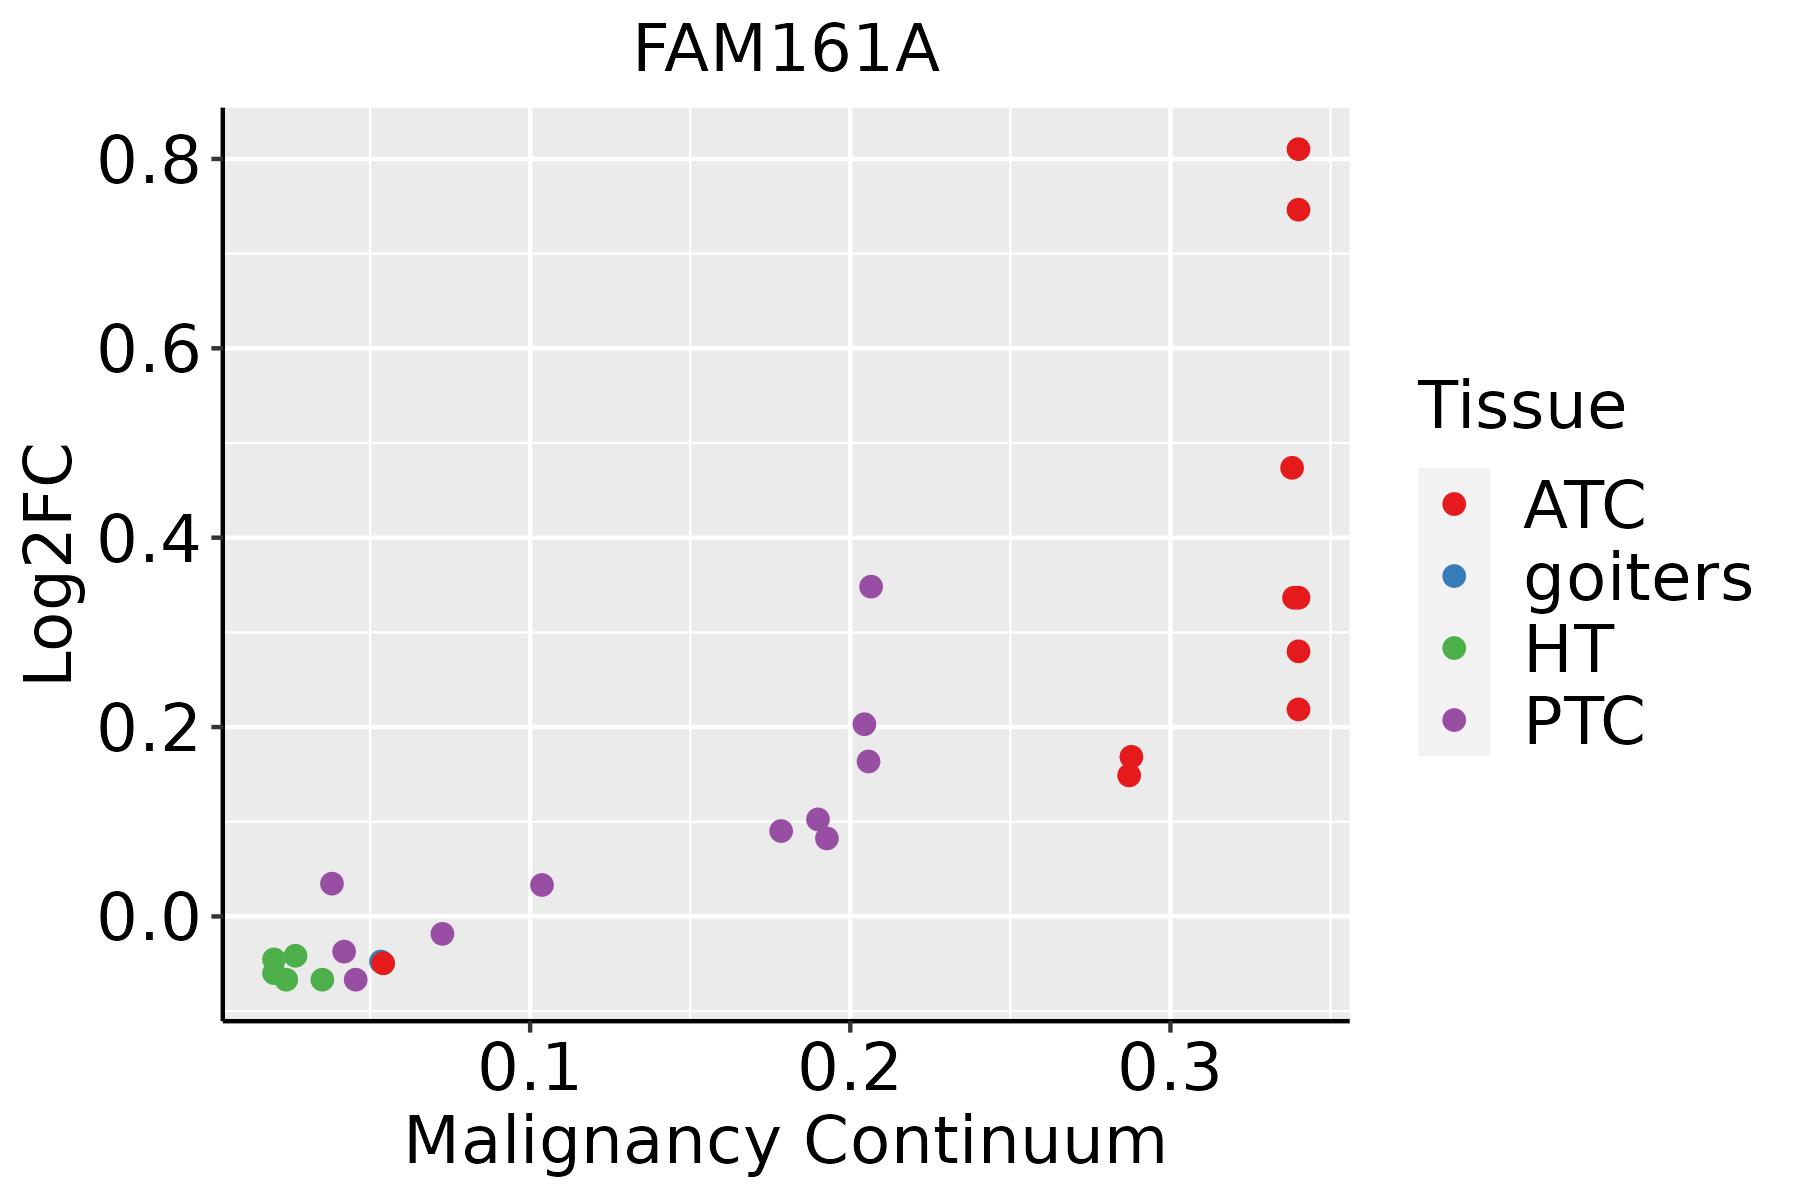 | ATC: Anaplastic thyroid cancer |
| HT: Hashimoto's thyroiditis | ||
| PTC: Papillary thyroid cancer |
| ∗log2FC in expression of this searched gene in stem-like cells from each diseased tissue sample relative to stem-like cells in normal samples in each tissue plotted against the malignancy continuum. Samples are colored based on if they are from different disease stage. |
Top |
Malignant transformation related pathway analysis |
| Find out the enriched GO biological processes and KEGG pathways involved in transition from healthy to precancer to cancer |
| Tissue | Disease Stage | Enriched GO biological Processes |
| Colorectum | AD |  |
| Colorectum | SER |  |
| Colorectum | MSS |  |
| Colorectum | MSI-H |  |
| Colorectum | FAP |  |
| ∗Top 15 enriched GO BP terms are showed in the bar plot of each disease state in each tissue. Each row represents a significant GO biological process which is colored according to the -log10(p.adjust). |
| Page: 1 2 3 4 5 6 7 8 9 |
| GO ID | Tissue | Disease Stage | Description | Gene Ratio | Bg Ratio | pvalue | p.adjust | Count |
| GO:004354313 | Esophagus | ESCC | protein acylation | 165/8552 | 243/18723 | 1.69e-12 | 7.14e-11 | 165 |
| GO:000647313 | Esophagus | ESCC | protein acetylation | 140/8552 | 201/18723 | 4.37e-12 | 1.69e-10 | 140 |
| GO:19019835 | Esophagus | ESCC | regulation of protein acetylation | 49/8552 | 77/18723 | 1.12e-03 | 5.60e-03 | 49 |
| GO:00064732 | Liver | HCC | protein acetylation | 135/7958 | 201/18723 | 1.20e-12 | 5.92e-11 | 135 |
| GO:00435432 | Liver | HCC | protein acylation | 157/7958 | 243/18723 | 2.40e-12 | 1.12e-10 | 157 |
| GO:19019831 | Liver | HCC | regulation of protein acetylation | 48/7958 | 77/18723 | 3.49e-04 | 2.43e-03 | 48 |
| GO:1901985 | Liver | HCC | positive regulation of protein acetylation | 27/7958 | 45/18723 | 1.35e-02 | 4.80e-02 | 27 |
| GO:00064737 | Thyroid | PTC | protein acetylation | 116/5968 | 201/18723 | 3.05e-14 | 1.92e-12 | 116 |
| GO:00435437 | Thyroid | PTC | protein acylation | 134/5968 | 243/18723 | 4.22e-14 | 2.58e-12 | 134 |
| GO:19019837 | Thyroid | PTC | regulation of protein acetylation | 46/5968 | 77/18723 | 4.26e-07 | 7.03e-06 | 46 |
| GO:19019852 | Thyroid | PTC | positive regulation of protein acetylation | 26/5968 | 45/18723 | 2.94e-04 | 2.08e-03 | 26 |
| GO:000647315 | Thyroid | ATC | protein acetylation | 116/6293 | 201/18723 | 1.75e-12 | 7.33e-11 | 116 |
| GO:004354315 | Thyroid | ATC | protein acylation | 134/6293 | 243/18723 | 3.46e-12 | 1.40e-10 | 134 |
| GO:190198314 | Thyroid | ATC | regulation of protein acetylation | 45/6293 | 77/18723 | 6.70e-06 | 6.93e-05 | 45 |
| GO:19019851 | Thyroid | ATC | positive regulation of protein acetylation | 24/6293 | 45/18723 | 4.97e-03 | 2.03e-02 | 24 |
| Page: 1 |
| Pathway ID | Tissue | Disease Stage | Description | Gene Ratio | Bg Ratio | pvalue | p.adjust | qvalue | Count |
| Page: 1 |
Top |
Cell-cell communication analysis |
| Identification of potential cell-cell interactions between two cell types and their ligand-receptor pairs for different disease states |
| Ligand | Receptor | LRpair | Pathway | Tissue | Disease Stage |
| Page: 1 |
Top |
Single-cell gene regulatory network inference analysis |
| Find out the significant the regulons (TFs) and the target genes of each regulon across cell types for different disease states |
| TF | Cell Type | Tissue | Disease Stage | Target Gene | RSS | Regulon Activity |
| ∗The dot plots of a searched regulon are shown for all cell subpopulations in each disease state of each tissue based on the regulon specific score inferred using pySCENIC and by calculating the average expression. |
| Page: 1 |
Top |
Somatic mutation of malignant transformation related genes |
| Annotation of somatic variants for genes involved in malignant transformation |
| Hugo Symbol | Variant Class | Variant Classification | dbSNP RS | HGVSc | HGVSp | HGVSp Short | SWISSPROT | BIOTYPE | SIFT | PolyPhen | Tumor Sample Barcode | Tissue | Histology | Sex | Age | Stage | Therapy Types | Drugs | Outcome |
| FAM161A | SNV | Missense_Mutation | rs267599420 | c.1285N>T | p.Pro429Ser | p.P429S | Q3B820 | protein_coding | deleterious(0.05) | probably_damaging(0.959) | TCGA-AC-A23H-01 | Breast | breast invasive carcinoma | Female | >=65 | I/II | Unknown | Unknown | PD |
| FAM161A | SNV | Missense_Mutation | novel | c.2036N>T | p.Arg679Ile | p.R679I | Q3B820 | protein_coding | deleterious(0.01) | possibly_damaging(0.748) | TCGA-AN-A046-01 | Breast | breast invasive carcinoma | Female | >=65 | I/II | Unknown | Unknown | SD |
| FAM161A | SNV | Missense_Mutation | rs747223820 | c.1429N>A | p.Glu477Lys | p.E477K | Q3B820 | protein_coding | tolerated(0.52) | benign(0.009) | TCGA-AN-A046-01 | Breast | breast invasive carcinoma | Female | >=65 | I/II | Unknown | Unknown | SD |
| FAM161A | SNV | Missense_Mutation | rs766328719 | c.787N>A | p.Glu263Lys | p.E263K | Q3B820 | protein_coding | deleterious(0.02) | possibly_damaging(0.828) | TCGA-AN-A046-01 | Breast | breast invasive carcinoma | Female | >=65 | I/II | Unknown | Unknown | SD |
| FAM161A | SNV | Missense_Mutation | c.127G>A | p.Glu43Lys | p.E43K | Q3B820 | protein_coding | tolerated(0.31) | benign(0.009) | TCGA-AN-A0XN-01 | Breast | breast invasive carcinoma | Female | >=65 | III/IV | Unknown | Unknown | SD | |
| FAM161A | SNV | Missense_Mutation | c.2041N>G | p.Asn681Asp | p.N681D | Q3B820 | protein_coding | tolerated(0.18) | benign(0.012) | TCGA-D8-A1XQ-01 | Breast | breast invasive carcinoma | Female | >=65 | I/II | Unknown | Unknown | SD | |
| FAM161A | SNV | Missense_Mutation | c.1419N>C | p.Leu473Phe | p.L473F | Q3B820 | protein_coding | deleterious(0) | probably_damaging(0.951) | TCGA-E9-A1NC-01 | Breast | breast invasive carcinoma | Female | <65 | I/II | Chemotherapy | doxorubicin | CR | |
| FAM161A | SNV | Missense_Mutation | novel | c.674G>A | p.Arg225Lys | p.R225K | Q3B820 | protein_coding | tolerated(0.85) | benign(0) | TCGA-2W-A8YY-01 | Cervix | cervical & endocervical cancer | Female | <65 | I/II | Chemotherapy | cisplatin | CR |
| FAM161A | SNV | Missense_Mutation | novel | c.716N>T | p.Pro239Leu | p.P239L | Q3B820 | protein_coding | deleterious(0) | probably_damaging(1) | TCGA-EA-A410-01 | Cervix | cervical & endocervical cancer | Female | <65 | I/II | Unknown | Unknown | SD |
| FAM161A | SNV | Missense_Mutation | novel | c.322N>A | p.Glu108Lys | p.E108K | Q3B820 | protein_coding | tolerated(0.09) | benign(0.055) | TCGA-VS-A8EI-01 | Cervix | cervical & endocervical cancer | Female | <65 | I/II | Chemotherapy | cisplatin | CR |
| Page: 1 2 3 4 5 6 7 8 9 |
Top |
Related drugs of malignant transformation related genes |
| Identification of chemicals and drugs interact with genes involved in malignant transfromation |
| (DGIdb 4.0) |
| Entrez ID | Symbol | Category | Interaction Types | Drug Claim Name | Drug Name | PMIDs |
| Page: 1 |

Copyright 2023-Present -The University of Texas Health Science Center at Houston |