
|
|||||
|
 | |
| |
| |
| |
| |
| |
|
Gene: FAM160B2 |
Gene summary for FAM160B2 |
| Gene information | Species | Human | Gene symbol | FAM160B2 | Gene ID | 64760 |
| Gene name | FHF complex subunit HOOK interacting protein 2B | |
| Gene Alias | FAM160B2 | |
| Cytomap | 8p21.3 | |
| Gene Type | protein-coding | GO ID | NA | UniProtAcc | Q86V87 |
Top |
Malignant transformation analysis |
| Identification of the aberrant gene expression in precancerous and cancerous lesions by comparing the gene expression of stem-like cells in diseased tissues with normal stem cells |
| Entrez ID | Symbol | Replicates | Species | Organ | Tissue | Adj P-value | Log2FC | Malignancy |
| 64760 | FAM160B2 | LZE4T | Human | Esophagus | ESCC | 1.25e-08 | 2.46e-01 | 0.0811 |
| 64760 | FAM160B2 | LZE8T | Human | Esophagus | ESCC | 8.64e-09 | 1.99e-01 | 0.067 |
| 64760 | FAM160B2 | LZE20T | Human | Esophagus | ESCC | 2.10e-04 | 1.30e-01 | 0.0662 |
| 64760 | FAM160B2 | LZE24T | Human | Esophagus | ESCC | 7.37e-16 | 3.01e-01 | 0.0596 |
| 64760 | FAM160B2 | P1T-E | Human | Esophagus | ESCC | 1.37e-15 | 6.08e-01 | 0.0875 |
| 64760 | FAM160B2 | P2T-E | Human | Esophagus | ESCC | 1.06e-13 | 3.34e-01 | 0.1177 |
| 64760 | FAM160B2 | P4T-E | Human | Esophagus | ESCC | 5.54e-13 | 2.13e-01 | 0.1323 |
| 64760 | FAM160B2 | P5T-E | Human | Esophagus | ESCC | 4.93e-10 | 9.87e-02 | 0.1327 |
| 64760 | FAM160B2 | P8T-E | Human | Esophagus | ESCC | 1.05e-19 | 2.20e-01 | 0.0889 |
| 64760 | FAM160B2 | P9T-E | Human | Esophagus | ESCC | 1.89e-07 | 2.12e-01 | 0.1131 |
| 64760 | FAM160B2 | P10T-E | Human | Esophagus | ESCC | 3.71e-56 | 9.17e-01 | 0.116 |
| 64760 | FAM160B2 | P11T-E | Human | Esophagus | ESCC | 1.31e-09 | 2.46e-01 | 0.1426 |
| 64760 | FAM160B2 | P12T-E | Human | Esophagus | ESCC | 4.27e-14 | 2.49e-01 | 0.1122 |
| 64760 | FAM160B2 | P15T-E | Human | Esophagus | ESCC | 8.54e-10 | 1.74e-01 | 0.1149 |
| 64760 | FAM160B2 | P16T-E | Human | Esophagus | ESCC | 8.98e-18 | 1.31e-01 | 0.1153 |
| 64760 | FAM160B2 | P19T-E | Human | Esophagus | ESCC | 8.75e-05 | 4.00e-01 | 0.1662 |
| 64760 | FAM160B2 | P20T-E | Human | Esophagus | ESCC | 1.44e-22 | 4.34e-01 | 0.1124 |
| 64760 | FAM160B2 | P21T-E | Human | Esophagus | ESCC | 1.39e-12 | 1.75e-01 | 0.1617 |
| 64760 | FAM160B2 | P22T-E | Human | Esophagus | ESCC | 6.97e-10 | 1.47e-01 | 0.1236 |
| 64760 | FAM160B2 | P23T-E | Human | Esophagus | ESCC | 5.33e-10 | 1.51e-01 | 0.108 |
| Page: 1 2 3 4 |
| Tissue | Expression Dynamics | Abbreviation |
| Esophagus | 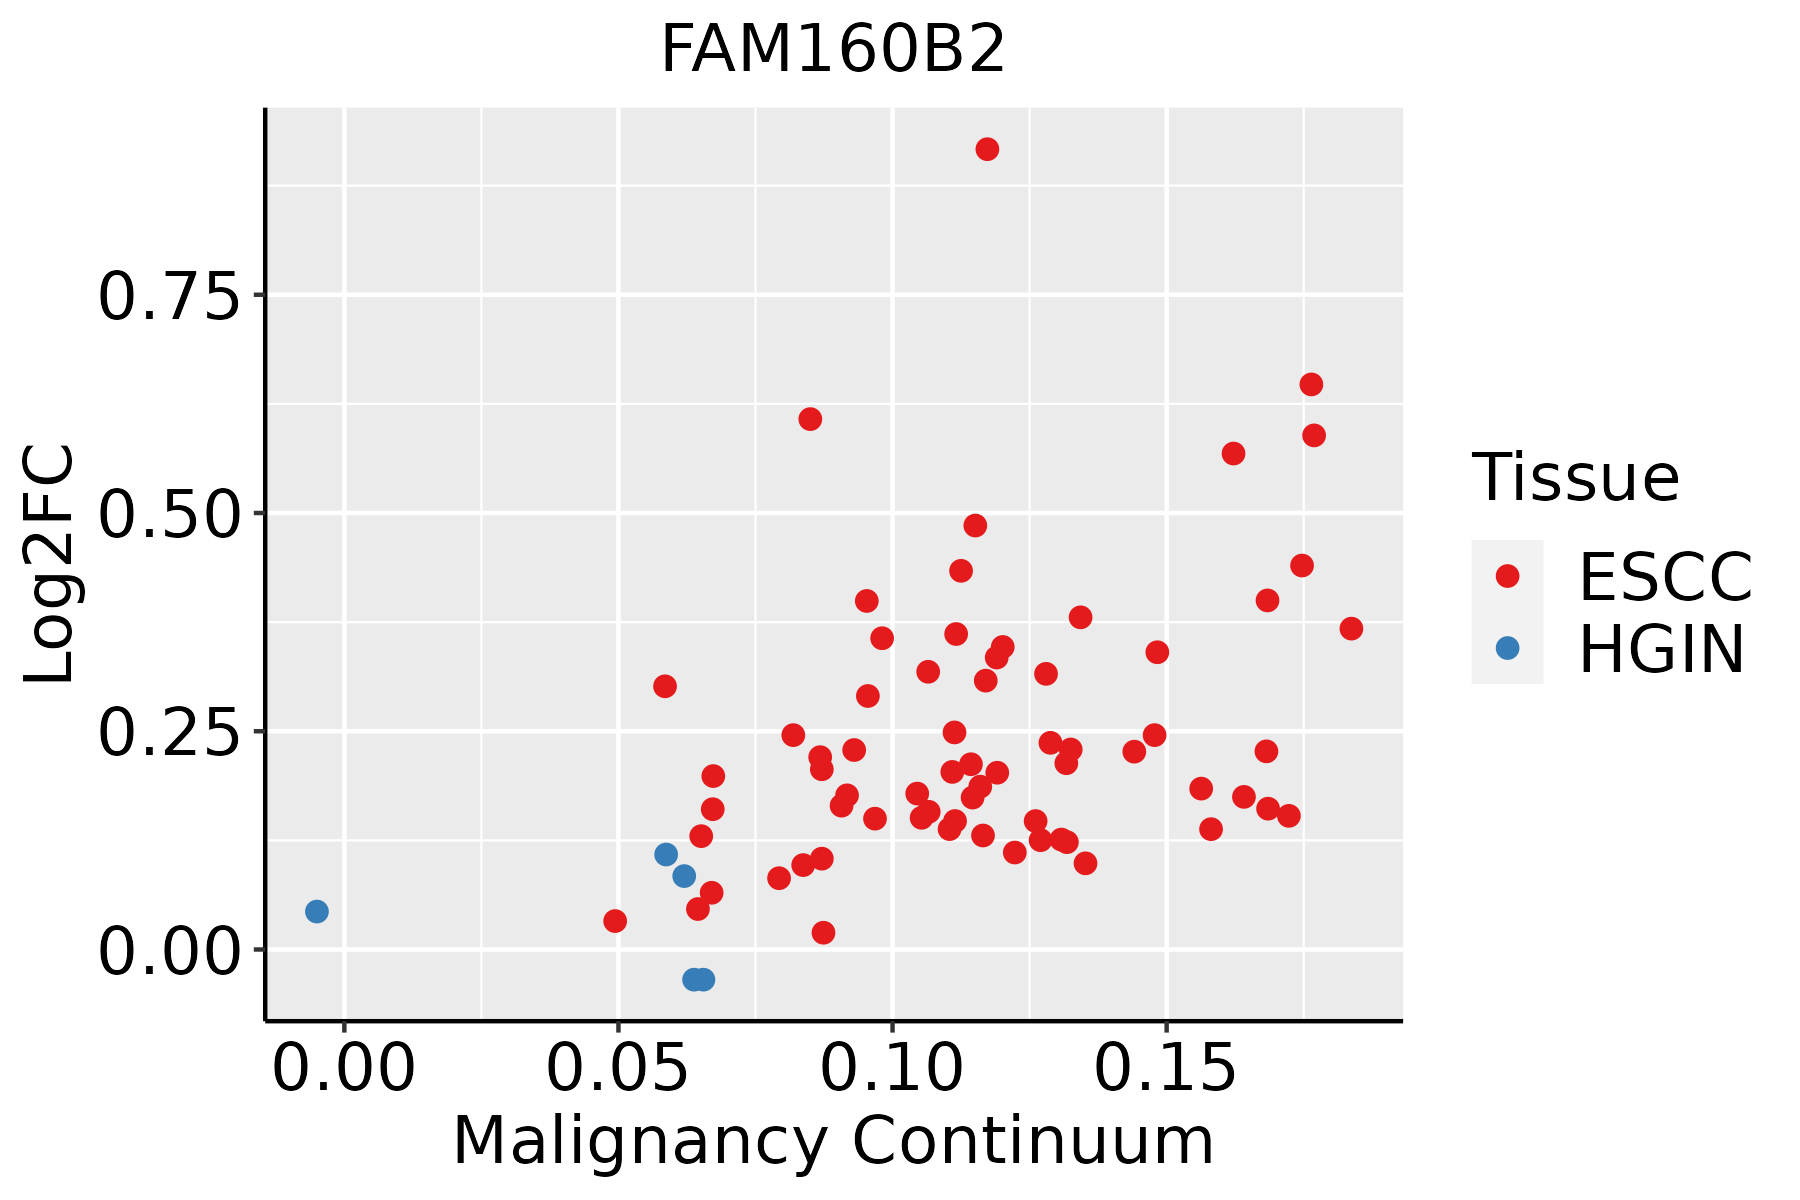 | ESCC: Esophageal squamous cell carcinoma |
| HGIN: High-grade intraepithelial neoplasias | ||
| LGIN: Low-grade intraepithelial neoplasias | ||
| Oral Cavity | 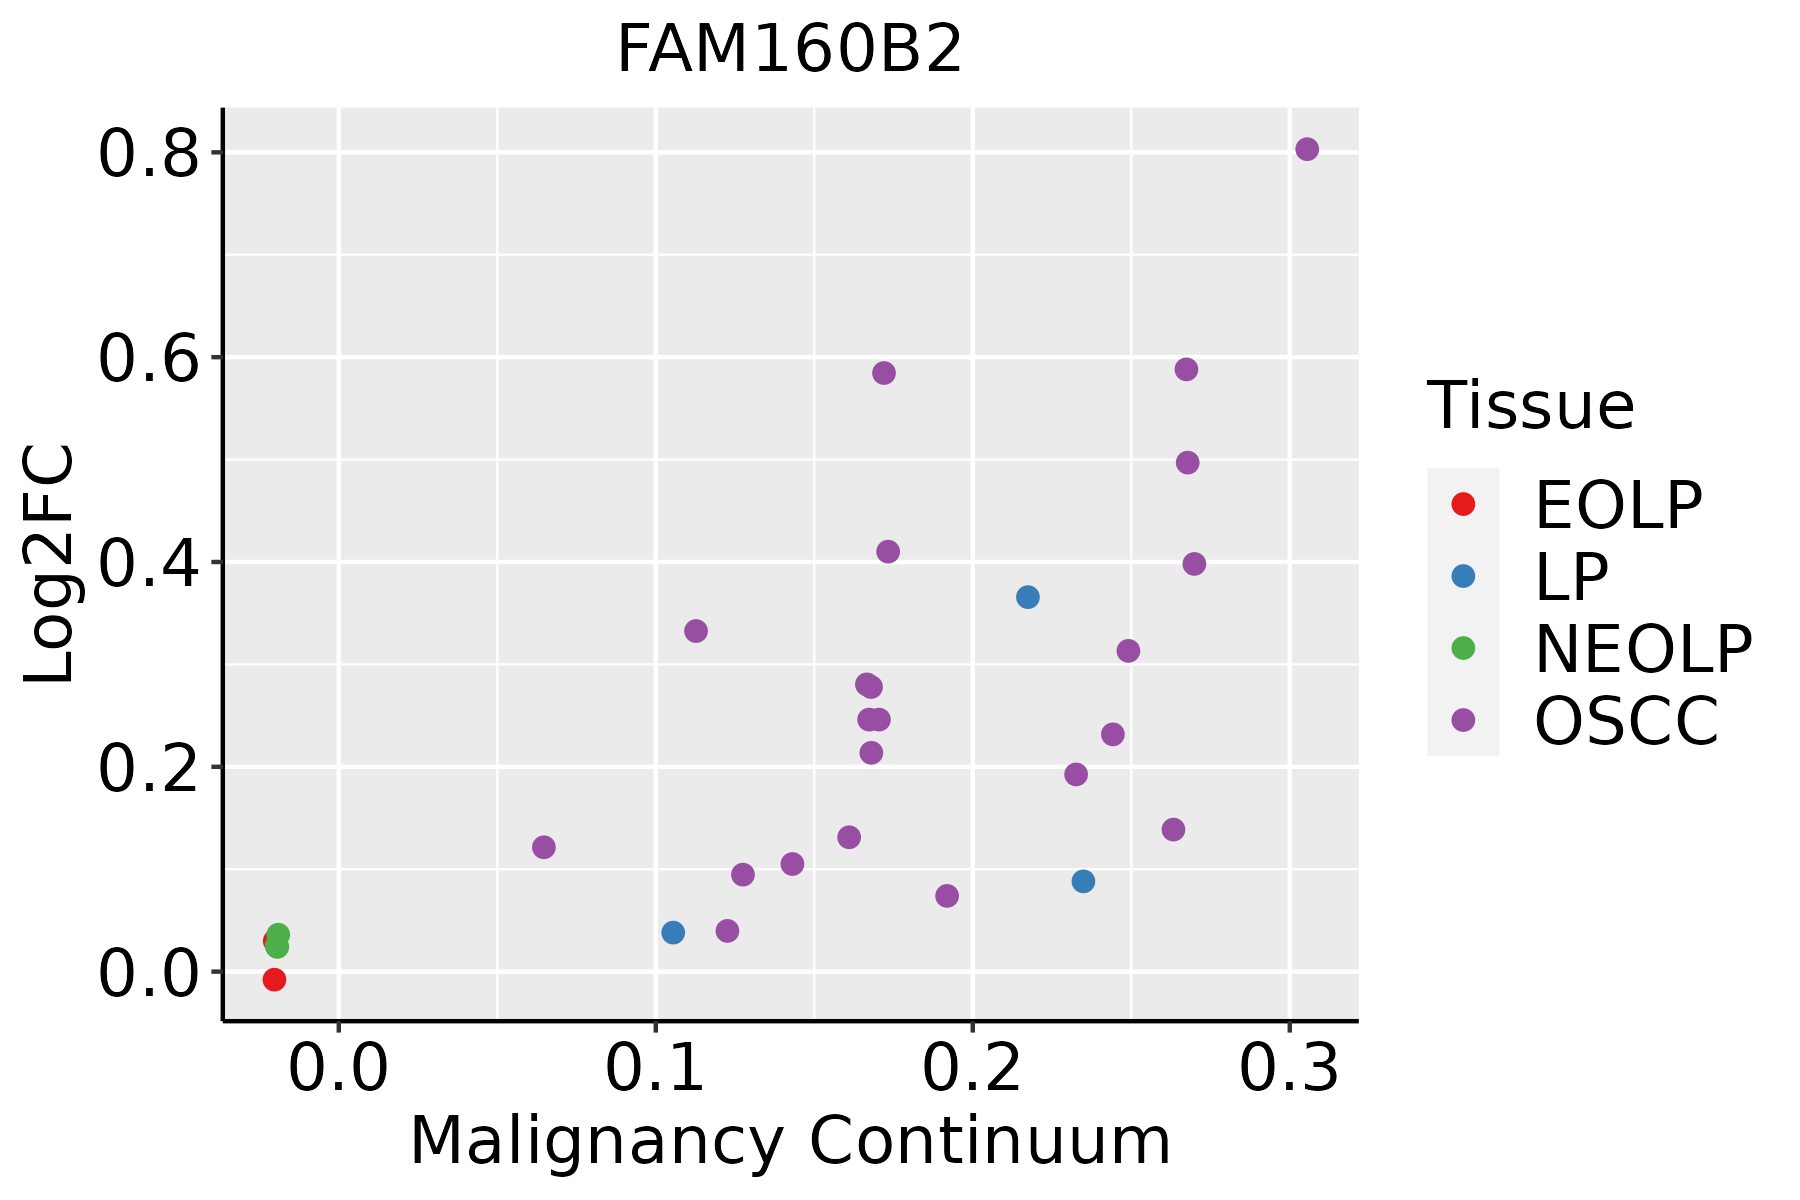 | EOLP: Erosive Oral lichen planus |
| LP: leukoplakia | ||
| NEOLP: Non-erosive oral lichen planus | ||
| OSCC: Oral squamous cell carcinoma |
| ∗log2FC in expression of this searched gene in stem-like cells from each diseased tissue sample relative to stem-like cells in normal samples in each tissue plotted against the malignancy continuum. Samples are colored based on if they are from different disease stage. |
Top |
Malignant transformation related pathway analysis |
| Find out the enriched GO biological processes and KEGG pathways involved in transition from healthy to precancer to cancer |
| Tissue | Disease Stage | Enriched GO biological Processes |
| Colorectum | AD |  |
| Colorectum | SER |  |
| Colorectum | MSS |  |
| Colorectum | MSI-H |  |
| Colorectum | FAP |  |
| ∗Top 15 enriched GO BP terms are showed in the bar plot of each disease state in each tissue. Each row represents a significant GO biological process which is colored according to the -log10(p.adjust). |
| Page: 1 2 3 4 5 6 7 8 9 |
| GO ID | Tissue | Disease Stage | Description | Gene Ratio | Bg Ratio | pvalue | p.adjust | Count |
| Page: 1 |
| Pathway ID | Tissue | Disease Stage | Description | Gene Ratio | Bg Ratio | pvalue | p.adjust | qvalue | Count |
| Page: 1 |
Top |
Cell-cell communication analysis |
| Identification of potential cell-cell interactions between two cell types and their ligand-receptor pairs for different disease states |
| Ligand | Receptor | LRpair | Pathway | Tissue | Disease Stage |
| Page: 1 |
Top |
Single-cell gene regulatory network inference analysis |
| Find out the significant the regulons (TFs) and the target genes of each regulon across cell types for different disease states |
| TF | Cell Type | Tissue | Disease Stage | Target Gene | RSS | Regulon Activity |
| ∗The dot plots of a searched regulon are shown for all cell subpopulations in each disease state of each tissue based on the regulon specific score inferred using pySCENIC and by calculating the average expression. |
| Page: 1 |
Top |
Somatic mutation of malignant transformation related genes |
| Annotation of somatic variants for genes involved in malignant transformation |
| Hugo Symbol | Variant Class | Variant Classification | dbSNP RS | HGVSc | HGVSp | HGVSp Short | SWISSPROT | BIOTYPE | SIFT | PolyPhen | Tumor Sample Barcode | Tissue | Histology | Sex | Age | Stage | Therapy Types | Drugs | Outcome |
| FAM160B2 | SNV | Missense_Mutation | novel | c.2227G>T | p.Val743Phe | p.V743F | Q86V87 | protein_coding | deleterious_low_confidence(0) | benign(0.122) | TCGA-A2-A0CP-01 | Breast | breast invasive carcinoma | Female | <65 | I/II | Chemotherapy | cytoxan | SD |
| FAM160B2 | SNV | Missense_Mutation | c.1339N>A | p.Glu447Lys | p.E447K | Q86V87 | protein_coding | deleterious(0) | probably_damaging(0.934) | TCGA-BH-A0HP-01 | Breast | breast invasive carcinoma | Female | >=65 | III/IV | Chemotherapy | doxorubicin | SD | |
| FAM160B2 | SNV | Missense_Mutation | c.1306N>T | p.His436Tyr | p.H436Y | Q86V87 | protein_coding | tolerated(0.13) | benign(0.007) | TCGA-D8-A27G-01 | Breast | breast invasive carcinoma | Female | >=65 | I/II | Unknown | Unknown | SD | |
| FAM160B2 | SNV | Missense_Mutation | rs777012787 | c.133N>C | p.Thr45Pro | p.T45P | Q86V87 | protein_coding | tolerated(0.09) | possibly_damaging(0.658) | TCGA-D8-A3Z5-01 | Breast | breast invasive carcinoma | Female | <65 | III/IV | Unknown | Unknown | SD |
| FAM160B2 | deletion | Frame_Shift_Del | novel | c.1241delC | p.Ala414ValfsTer83 | p.A414Vfs*83 | Q86V87 | protein_coding | TCGA-EW-A2FV-01 | Breast | breast invasive carcinoma | Female | <65 | III/IV | Chemotherapy | docetaxel | SD | ||
| FAM160B2 | SNV | Missense_Mutation | rs762032351 | c.1940N>T | p.Pro647Leu | p.P647L | Q86V87 | protein_coding | deleterious(0) | probably_damaging(0.997) | TCGA-2W-A8YY-01 | Cervix | cervical & endocervical cancer | Female | <65 | I/II | Chemotherapy | cisplatin | CR |
| FAM160B2 | SNV | Missense_Mutation | novel | c.1369N>A | p.Glu457Lys | p.E457K | Q86V87 | protein_coding | deleterious(0) | probably_damaging(0.997) | TCGA-C5-A2LZ-01 | Cervix | cervical & endocervical cancer | Female | >=65 | III/IV | Unknown | Unknown | PD |
| FAM160B2 | SNV | Missense_Mutation | c.1270N>A | p.Glu424Lys | p.E424K | Q86V87 | protein_coding | deleterious(0.02) | possibly_damaging(0.861) | TCGA-IR-A3LI-01 | Cervix | cervical & endocervical cancer | Female | <65 | I/II | Chemotherapy | cisplatin | CR | |
| FAM160B2 | insertion | In_Frame_Ins | novel | c.63_64insTTACAAACAATCAATCACCAGGTAGTACCAGCAACAACAGTATCAAAA | p.Leu22_Leu23insGlnThrIleAsnHisGlnValValProAlaThrThrValSerLysLeu | p.L22_L23insQTINHQVVPATTVSKL | Q86V87 | protein_coding | TCGA-VS-A8Q9-01 | Cervix | cervical & endocervical cancer | Female | >=65 | I/II | Unknown | Unknown | SD | ||
| FAM160B2 | SNV | Missense_Mutation | novel | c.242N>C | p.Glu81Ala | p.E81A | Q86V87 | protein_coding | deleterious(0) | probably_damaging(0.996) | TCGA-AA-3947-01 | Colorectum | colon adenocarcinoma | Female | <65 | I/II | Unknown | Unknown | SD |
| Page: 1 2 3 4 5 6 |
Top |
Related drugs of malignant transformation related genes |
| Identification of chemicals and drugs interact with genes involved in malignant transfromation |
| (DGIdb 4.0) |
| Entrez ID | Symbol | Category | Interaction Types | Drug Claim Name | Drug Name | PMIDs |
| Page: 1 |

Copyright 2023-Present -The University of Texas Health Science Center at Houston |