
|
|||||
|
 | |
| |
| |
| |
| |
| |
|
Gene: FAM160B1 |
Gene summary for FAM160B1 |
| Gene information | Species | Human | Gene symbol | FAM160B1 | Gene ID | 57700 |
| Gene name | FHF complex subunit HOOK interacting protein 2A | |
| Gene Alias | FAM160B1 | |
| Cytomap | 10q25.3 | |
| Gene Type | protein-coding | GO ID | NA | UniProtAcc | Q5W0V3 |
Top |
Malignant transformation analysis |
| Identification of the aberrant gene expression in precancerous and cancerous lesions by comparing the gene expression of stem-like cells in diseased tissues with normal stem cells |
| Entrez ID | Symbol | Replicates | Species | Organ | Tissue | Adj P-value | Log2FC | Malignancy |
| 57700 | FAM160B1 | NAFLD1 | Human | Liver | NAFLD | 7.35e-07 | 6.09e-01 | -0.04 |
| 57700 | FAM160B1 | HCC1_Meng | Human | Liver | HCC | 1.72e-18 | -5.99e-02 | 0.0246 |
| 57700 | FAM160B1 | HCC2_Meng | Human | Liver | HCC | 1.90e-04 | 3.06e-03 | 0.0107 |
| 57700 | FAM160B1 | HCC1 | Human | Liver | HCC | 6.85e-04 | 2.41e+00 | 0.5336 |
| 57700 | FAM160B1 | HCC2 | Human | Liver | HCC | 9.53e-08 | 2.57e+00 | 0.5341 |
| 57700 | FAM160B1 | S027 | Human | Liver | HCC | 2.75e-03 | 4.77e-01 | 0.2446 |
| 57700 | FAM160B1 | S028 | Human | Liver | HCC | 7.86e-05 | 3.47e-01 | 0.2503 |
| 57700 | FAM160B1 | S029 | Human | Liver | HCC | 4.57e-08 | 4.58e-01 | 0.2581 |
| 57700 | FAM160B1 | male-WTA | Human | Thyroid | PTC | 2.88e-14 | 9.92e-02 | 0.1037 |
| 57700 | FAM160B1 | PTC01 | Human | Thyroid | PTC | 1.31e-13 | 7.54e-02 | 0.1899 |
| 57700 | FAM160B1 | PTC03 | Human | Thyroid | PTC | 7.86e-05 | 1.99e-01 | 0.1784 |
| 57700 | FAM160B1 | PTC04 | Human | Thyroid | PTC | 1.47e-14 | 2.66e-01 | 0.1927 |
| 57700 | FAM160B1 | PTC05 | Human | Thyroid | PTC | 2.13e-19 | 5.96e-01 | 0.2065 |
| 57700 | FAM160B1 | PTC06 | Human | Thyroid | PTC | 1.64e-24 | 4.21e-01 | 0.2057 |
| 57700 | FAM160B1 | PTC07 | Human | Thyroid | PTC | 6.53e-11 | 1.68e-01 | 0.2044 |
| 57700 | FAM160B1 | ATC11 | Human | Thyroid | ATC | 1.06e-04 | 5.28e-01 | 0.3386 |
| 57700 | FAM160B1 | ATC12 | Human | Thyroid | ATC | 1.56e-07 | 1.06e-01 | 0.34 |
| 57700 | FAM160B1 | ATC13 | Human | Thyroid | ATC | 9.29e-27 | 4.83e-01 | 0.34 |
| 57700 | FAM160B1 | ATC2 | Human | Thyroid | ATC | 6.33e-08 | 7.01e-01 | 0.34 |
| 57700 | FAM160B1 | ATC3 | Human | Thyroid | ATC | 1.76e-05 | 4.91e-01 | 0.338 |
| Page: 1 2 |
| Tissue | Expression Dynamics | Abbreviation |
| Liver |  | HCC: Hepatocellular carcinoma |
| NAFLD: Non-alcoholic fatty liver disease | ||
| Thyroid | 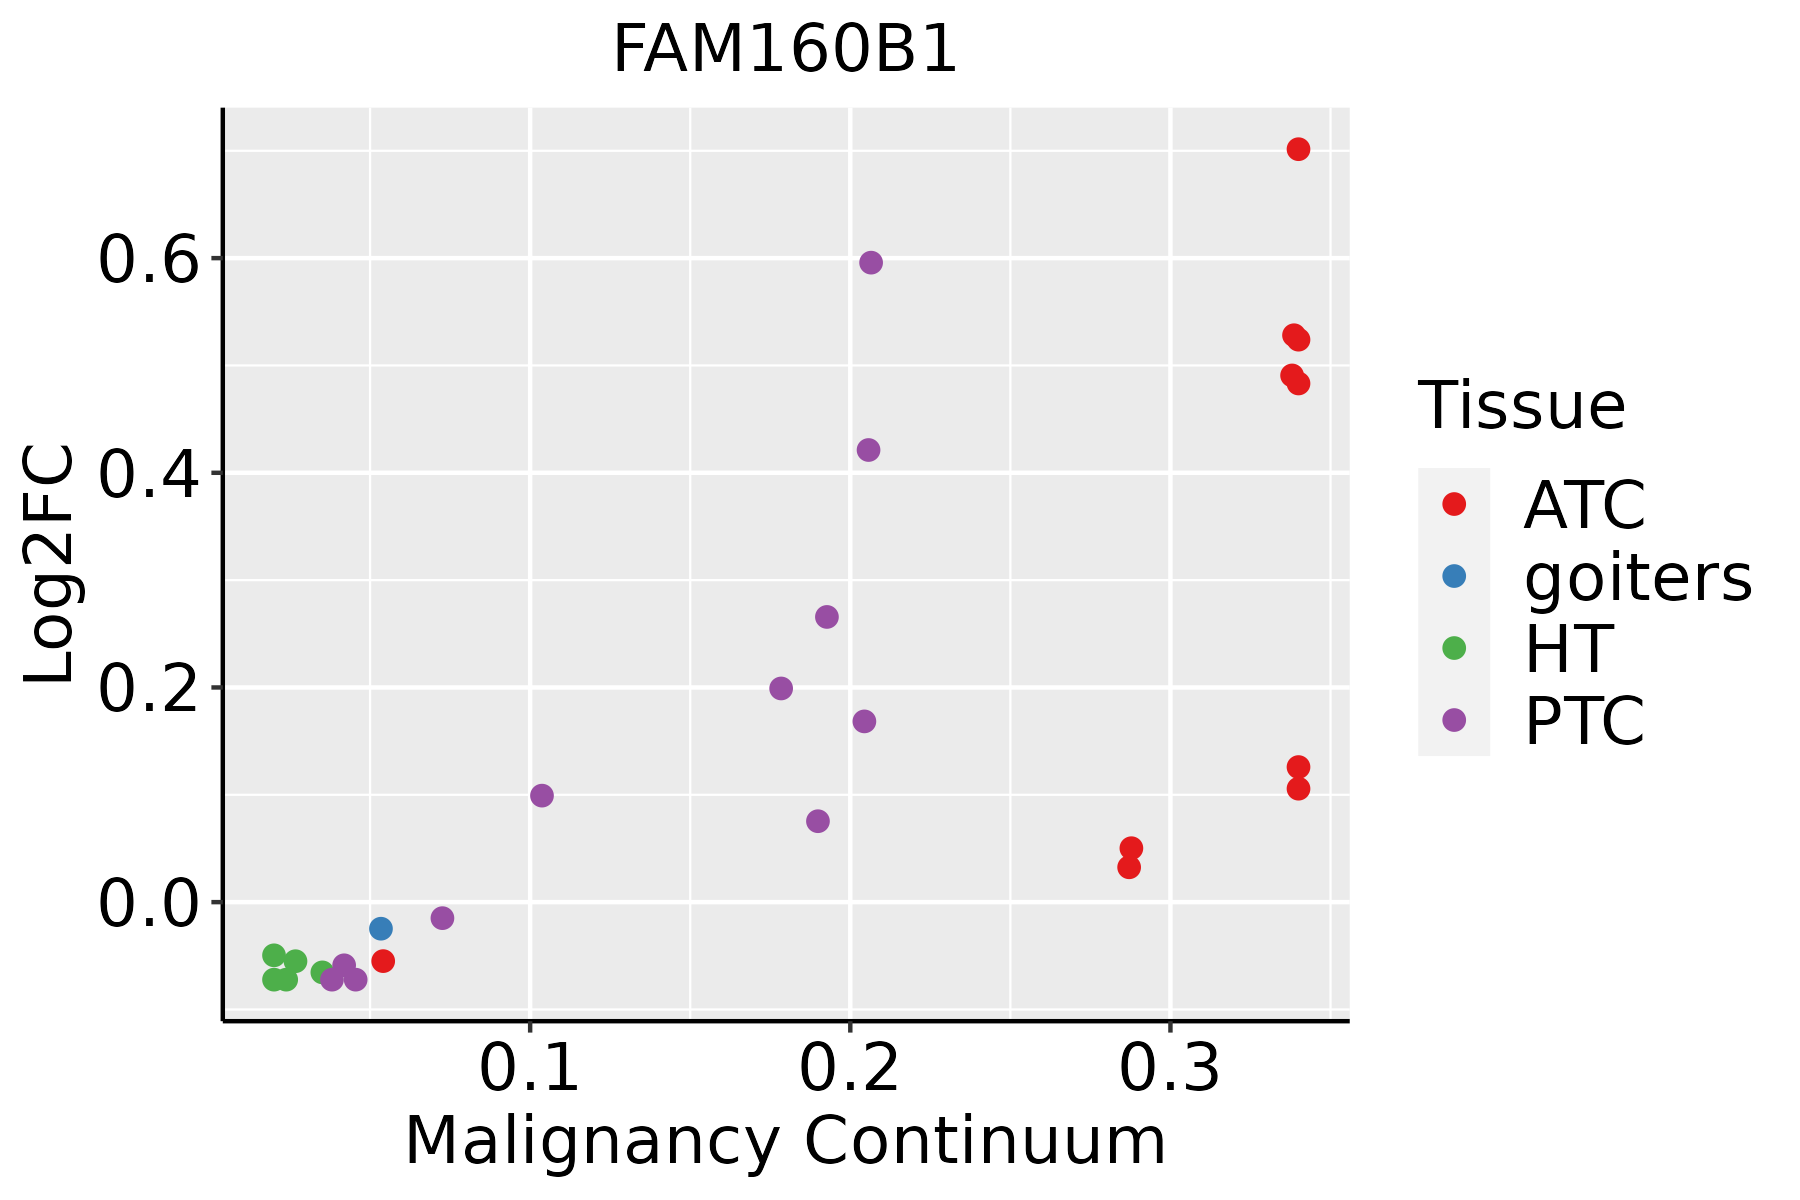 | ATC: Anaplastic thyroid cancer |
| HT: Hashimoto's thyroiditis | ||
| PTC: Papillary thyroid cancer |
| ∗log2FC in expression of this searched gene in stem-like cells from each diseased tissue sample relative to stem-like cells in normal samples in each tissue plotted against the malignancy continuum. Samples are colored based on if they are from different disease stage. |
Top |
Malignant transformation related pathway analysis |
| Find out the enriched GO biological processes and KEGG pathways involved in transition from healthy to precancer to cancer |
| Tissue | Disease Stage | Enriched GO biological Processes |
| Colorectum | AD |  |
| Colorectum | SER |  |
| Colorectum | MSS |  |
| Colorectum | MSI-H |  |
| Colorectum | FAP |  |
| ∗Top 15 enriched GO BP terms are showed in the bar plot of each disease state in each tissue. Each row represents a significant GO biological process which is colored according to the -log10(p.adjust). |
| Page: 1 2 3 4 5 6 7 8 9 |
| GO ID | Tissue | Disease Stage | Description | Gene Ratio | Bg Ratio | pvalue | p.adjust | Count |
| Page: 1 |
| Pathway ID | Tissue | Disease Stage | Description | Gene Ratio | Bg Ratio | pvalue | p.adjust | qvalue | Count |
| Page: 1 |
Top |
Cell-cell communication analysis |
| Identification of potential cell-cell interactions between two cell types and their ligand-receptor pairs for different disease states |
| Ligand | Receptor | LRpair | Pathway | Tissue | Disease Stage |
| Page: 1 |
Top |
Single-cell gene regulatory network inference analysis |
| Find out the significant the regulons (TFs) and the target genes of each regulon across cell types for different disease states |
| TF | Cell Type | Tissue | Disease Stage | Target Gene | RSS | Regulon Activity |
| ∗The dot plots of a searched regulon are shown for all cell subpopulations in each disease state of each tissue based on the regulon specific score inferred using pySCENIC and by calculating the average expression. |
| Page: 1 |
Top |
Somatic mutation of malignant transformation related genes |
| Annotation of somatic variants for genes involved in malignant transformation |
| Hugo Symbol | Variant Class | Variant Classification | dbSNP RS | HGVSc | HGVSp | HGVSp Short | SWISSPROT | BIOTYPE | SIFT | PolyPhen | Tumor Sample Barcode | Tissue | Histology | Sex | Age | Stage | Therapy Types | Drugs | Outcome |
| FAM160B1 | SNV | Missense_Mutation | c.1832G>A | p.Arg611Lys | p.R611K | Q5W0V3 | protein_coding | tolerated(0.77) | benign(0) | TCGA-AC-A23H-01 | Breast | breast invasive carcinoma | Female | >=65 | I/II | Unknown | Unknown | PD | |
| FAM160B1 | SNV | Missense_Mutation | novel | c.133G>T | p.Ala45Ser | p.A45S | Q5W0V3 | protein_coding | tolerated(0.11) | benign(0.13) | TCGA-AC-A8OR-01 | Breast | breast invasive carcinoma | Female | >=65 | I/II | Unknown | Unknown | SD |
| FAM160B1 | SNV | Missense_Mutation | c.137N>T | p.Pro46Leu | p.P46L | Q5W0V3 | protein_coding | deleterious(0) | probably_damaging(0.94) | TCGA-BH-A0DZ-01 | Breast | breast invasive carcinoma | Female | <65 | I/II | Chemotherapy | docetaxel | SD | |
| FAM160B1 | SNV | Missense_Mutation | c.490N>G | p.Gln164Glu | p.Q164E | Q5W0V3 | protein_coding | tolerated(0.08) | benign(0.003) | TCGA-C8-A1HJ-01 | Breast | breast invasive carcinoma | Female | <65 | I/II | Unknown | Unknown | SD | |
| FAM160B1 | SNV | Missense_Mutation | novel | c.330N>G | p.Phe110Leu | p.F110L | Q5W0V3 | protein_coding | deleterious(0) | benign(0.438) | TCGA-S3-AA15-01 | Breast | breast invasive carcinoma | Female | <65 | I/II | Chemotherapy | adriamycin | CR |
| FAM160B1 | SNV | Missense_Mutation | c.903N>C | p.Gln301His | p.Q301H | Q5W0V3 | protein_coding | tolerated(0.15) | benign(0.343) | TCGA-Q1-A73O-01 | Cervix | cervical & endocervical cancer | Female | <65 | I/II | Chemotherapy | cisplatin | CR | |
| FAM160B1 | SNV | Missense_Mutation | novel | c.22A>G | p.Ile8Val | p.I8V | Q5W0V3 | protein_coding | tolerated(0.19) | benign(0.007) | TCGA-VS-A959-01 | Cervix | cervical & endocervical cancer | Female | >=65 | I/II | Unknown | Unknown | SD |
| FAM160B1 | SNV | Missense_Mutation | novel | c.1432C>G | p.Leu478Val | p.L478V | Q5W0V3 | protein_coding | deleterious(0) | probably_damaging(0.972) | TCGA-ZJ-AAXD-01 | Cervix | cervical & endocervical cancer | Female | <65 | III/IV | Unknown | Unknown | SD |
| FAM160B1 | SNV | Missense_Mutation | c.139N>C | p.Val47Leu | p.V47L | Q5W0V3 | protein_coding | deleterious(0.02) | possibly_damaging(0.71) | TCGA-A6-2686-01 | Colorectum | colon adenocarcinoma | Female | >=65 | I/II | Unknown | Unknown | SD | |
| FAM160B1 | SNV | Missense_Mutation | rs138422469 | c.2263N>A | p.Ala755Thr | p.A755T | Q5W0V3 | protein_coding | deleterious(0) | possibly_damaging(0.726) | TCGA-A6-6780-01 | Colorectum | colon adenocarcinoma | Male | >=65 | I/II | Unknown | Unknown | SD |
| Page: 1 2 3 4 5 6 7 |
Top |
Related drugs of malignant transformation related genes |
| Identification of chemicals and drugs interact with genes involved in malignant transfromation |
| (DGIdb 4.0) |
| Entrez ID | Symbol | Category | Interaction Types | Drug Claim Name | Drug Name | PMIDs |
| Page: 1 |

Copyright 2023-Present -The University of Texas Health Science Center at Houston |