
|
|||||
|
 | |
| |
| |
| |
| |
| |
|
Gene: FAM155A |
Gene summary for FAM155A |
| Gene information | Species | Human | Gene symbol | FAM155A | Gene ID | 728215 |
| Gene name | NALCN channel auxiliary factor 1 | |
| Gene Alias | FAM155A | |
| Cytomap | 13q33.3 | |
| Gene Type | protein-coding | GO ID | GO:0006810 | UniProtAcc | B1AL88 |
Top |
Malignant transformation analysis |
| Identification of the aberrant gene expression in precancerous and cancerous lesions by comparing the gene expression of stem-like cells in diseased tissues with normal stem cells |
| Entrez ID | Symbol | Replicates | Species | Organ | Tissue | Adj P-value | Log2FC | Malignancy |
| 728215 | FAM155A | HTA11_78_2000001011 | Human | Colorectum | AD | 6.80e-04 | 4.64e-01 | -0.1088 |
| 728215 | FAM155A | HTA11_1391_2000001011 | Human | Colorectum | AD | 1.31e-05 | 4.62e-01 | -0.059 |
| 728215 | FAM155A | HTA11_10711_2000001011 | Human | Colorectum | AD | 1.23e-03 | 3.41e-01 | 0.0338 |
| 728215 | FAM155A | HTA11_6818_2000001021 | Human | Colorectum | AD | 7.20e-05 | 4.78e-01 | 0.0588 |
| 728215 | FAM155A | HTA11_99999973899_84307 | Human | Colorectum | MSS | 3.63e-13 | 8.23e-01 | 0.2585 |
| 728215 | FAM155A | F072B | Human | Colorectum | FAP | 2.11e-24 | 7.94e-01 | 0.257 |
| 728215 | FAM155A | AEH-subject1 | Human | Endometrium | AEH | 4.46e-58 | 1.09e+00 | -0.3059 |
| 728215 | FAM155A | AEH-subject2 | Human | Endometrium | AEH | 4.54e-35 | 9.65e-01 | -0.2525 |
| 728215 | FAM155A | AEH-subject3 | Human | Endometrium | AEH | 2.18e-44 | 1.00e+00 | -0.2576 |
| 728215 | FAM155A | AEH-subject4 | Human | Endometrium | AEH | 1.70e-34 | 9.98e-01 | -0.2657 |
| 728215 | FAM155A | AEH-subject5 | Human | Endometrium | AEH | 3.96e-49 | 1.27e+00 | -0.2953 |
| 728215 | FAM155A | EEC-subject1 | Human | Endometrium | EEC | 1.78e-49 | 1.06e+00 | -0.2682 |
| 728215 | FAM155A | EEC-subject2 | Human | Endometrium | EEC | 8.03e-03 | -1.11e-02 | -0.2607 |
| 728215 | FAM155A | EEC-subject3 | Human | Endometrium | EEC | 1.71e-26 | 7.11e-01 | -0.2525 |
| 728215 | FAM155A | EEC-subject4 | Human | Endometrium | EEC | 2.35e-10 | 4.37e-01 | -0.2571 |
| 728215 | FAM155A | EEC-subject5 | Human | Endometrium | EEC | 5.97e-07 | -5.84e-02 | -0.249 |
| 728215 | FAM155A | GSM6177620_NYU_UCEC1_lib3_lib3 | Human | Endometrium | EEC | 7.52e-05 | -9.20e-02 | -0.1883 |
| 728215 | FAM155A | GSM6177621_NYU_UCEC2_lib1_lib1 | Human | Endometrium | EEC | 5.42e-15 | 4.26e-01 | -0.1934 |
| 728215 | FAM155A | GSM6177622_NYU_UCEC3_lib1_lib1 | Human | Endometrium | EEC | 2.72e-06 | -1.02e-01 | -0.1917 |
| 728215 | FAM155A | GSM6177622_NYU_UCEC3_lib2_lib2 | Human | Endometrium | EEC | 5.78e-05 | -9.51e-02 | -0.1916 |
| Page: 1 2 |
| Tissue | Expression Dynamics | Abbreviation |
| Colorectum (GSE201348) |  | FAP: Familial adenomatous polyposis |
| CRC: Colorectal cancer | ||
| Colorectum (HTA11) |  | AD: Adenomas |
| SER: Sessile serrated lesions | ||
| MSI-H: Microsatellite-high colorectal cancer | ||
| MSS: Microsatellite stable colorectal cancer | ||
| Endometrium | 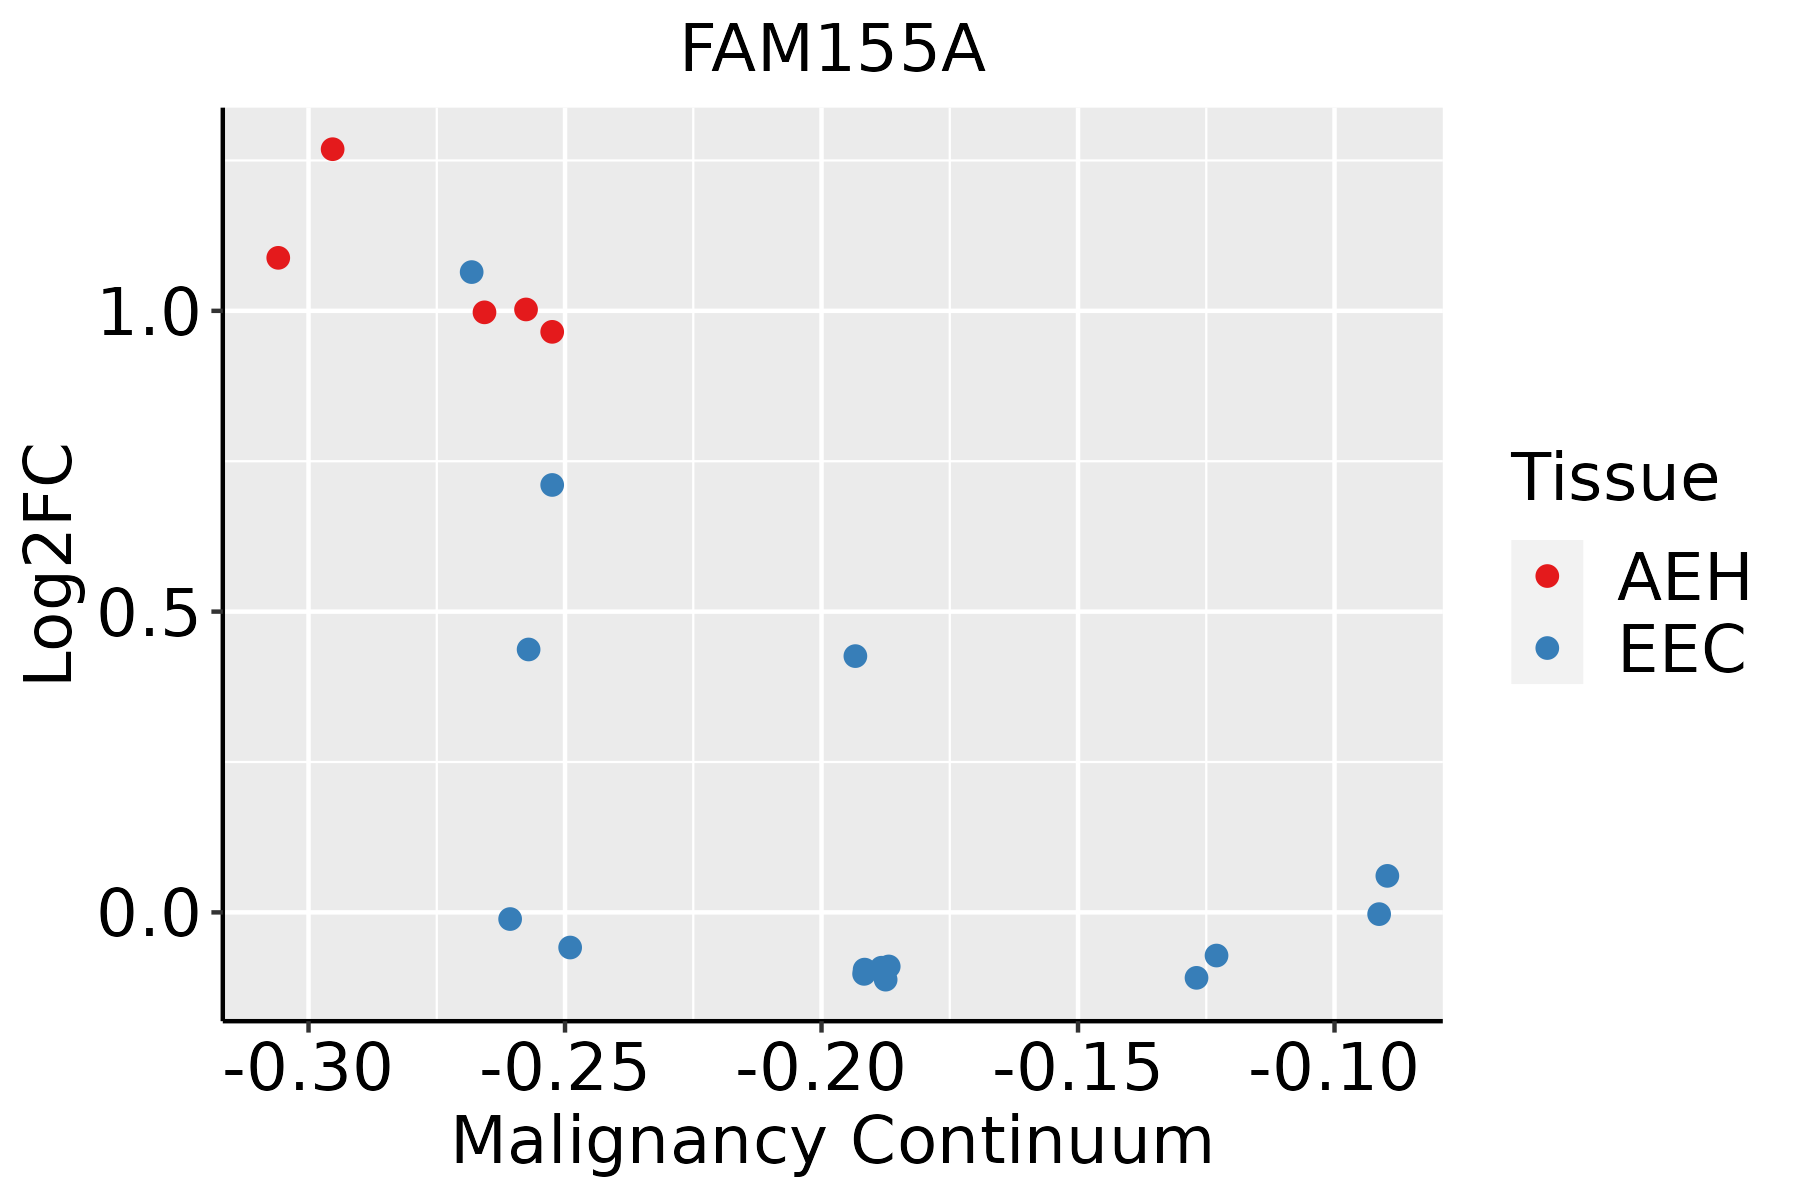 | AEH: Atypical endometrial hyperplasia |
| EEC: Endometrioid Cancer | ||
| Lung | 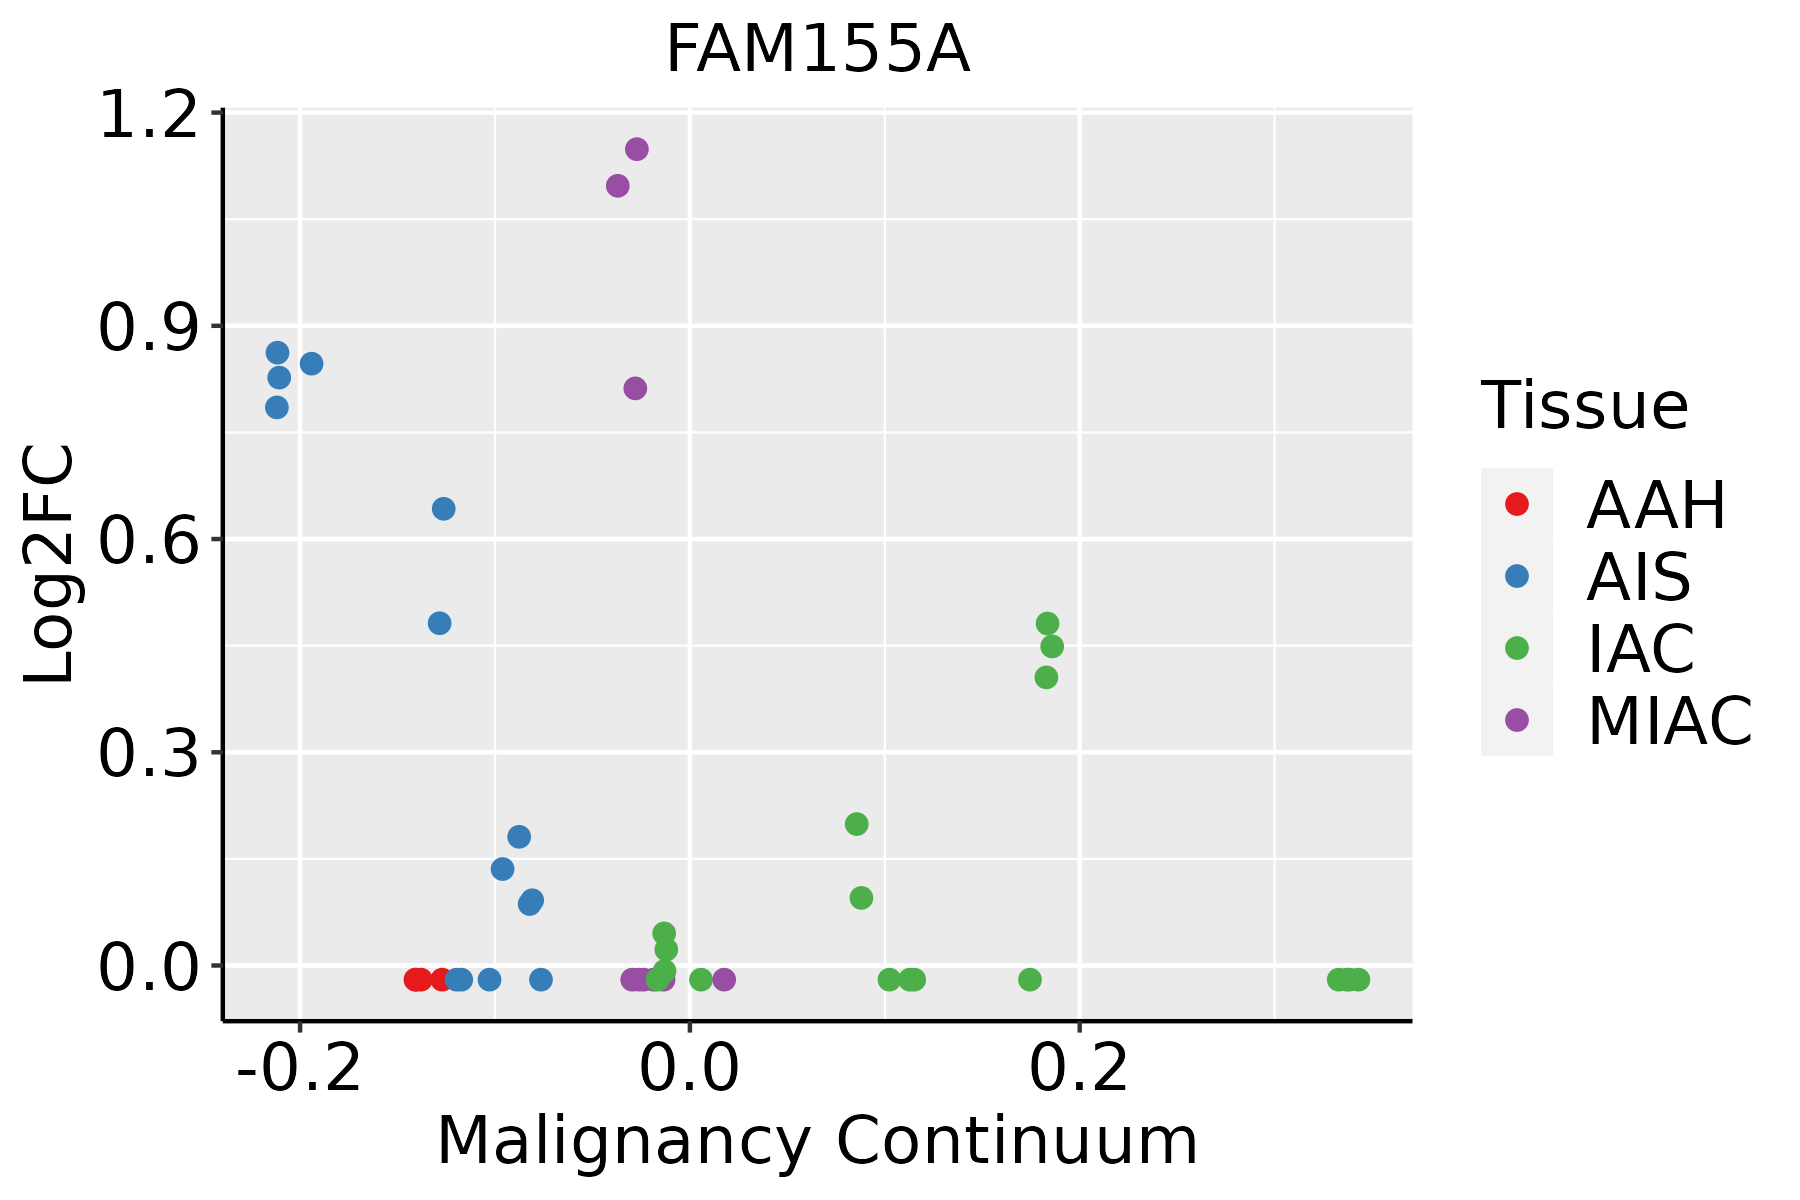 | AAH: Atypical adenomatous hyperplasia |
| AIS: Adenocarcinoma in situ | ||
| IAC: Invasive lung adenocarcinoma | ||
| MIA: Minimally invasive adenocarcinoma |
| ∗log2FC in expression of this searched gene in stem-like cells from each diseased tissue sample relative to stem-like cells in normal samples in each tissue plotted against the malignancy continuum. Samples are colored based on if they are from different disease stage. |
Top |
Malignant transformation related pathway analysis |
| Find out the enriched GO biological processes and KEGG pathways involved in transition from healthy to precancer to cancer |
| Tissue | Disease Stage | Enriched GO biological Processes |
| Colorectum | AD |  |
| Colorectum | SER |  |
| Colorectum | MSS |  |
| Colorectum | MSI-H |  |
| Colorectum | FAP |  |
| ∗Top 15 enriched GO BP terms are showed in the bar plot of each disease state in each tissue. Each row represents a significant GO biological process which is colored according to the -log10(p.adjust). |
| Page: 1 2 3 4 5 6 7 8 9 |
| GO ID | Tissue | Disease Stage | Description | Gene Ratio | Bg Ratio | pvalue | p.adjust | Count |
| Page: 1 |
| Pathway ID | Tissue | Disease Stage | Description | Gene Ratio | Bg Ratio | pvalue | p.adjust | qvalue | Count |
| Page: 1 |
Top |
Cell-cell communication analysis |
| Identification of potential cell-cell interactions between two cell types and their ligand-receptor pairs for different disease states |
| Ligand | Receptor | LRpair | Pathway | Tissue | Disease Stage |
| Page: 1 |
Top |
Single-cell gene regulatory network inference analysis |
| Find out the significant the regulons (TFs) and the target genes of each regulon across cell types for different disease states |
| TF | Cell Type | Tissue | Disease Stage | Target Gene | RSS | Regulon Activity |
| ∗The dot plots of a searched regulon are shown for all cell subpopulations in each disease state of each tissue based on the regulon specific score inferred using pySCENIC and by calculating the average expression. |
| Page: 1 |
Top |
Somatic mutation of malignant transformation related genes |
| Annotation of somatic variants for genes involved in malignant transformation |
| Hugo Symbol | Variant Class | Variant Classification | dbSNP RS | HGVSc | HGVSp | HGVSp Short | SWISSPROT | BIOTYPE | SIFT | PolyPhen | Tumor Sample Barcode | Tissue | Histology | Sex | Age | Stage | Therapy Types | Drugs | Outcome |
| FAM155A | SNV | Missense_Mutation | c.909N>A | p.Asp303Glu | p.D303E | B1AL88 | protein_coding | tolerated(0.52) | benign(0.069) | TCGA-A2-A0YJ-01 | Breast | breast invasive carcinoma | Female | <65 | III/IV | Chemotherapy | cytoxan | PD | |
| FAM155A | SNV | Missense_Mutation | c.745N>A | p.Asp249Asn | p.D249N | B1AL88 | protein_coding | deleterious(0.04) | probably_damaging(0.984) | TCGA-AN-A0XW-01 | Breast | breast invasive carcinoma | Female | <65 | III/IV | Unknown | Unknown | SD | |
| FAM155A | SNV | Missense_Mutation | c.158C>G | p.Ser53Cys | p.S53C | B1AL88 | protein_coding | deleterious(0) | probably_damaging(0.992) | TCGA-BH-A18P-01 | Breast | breast invasive carcinoma | Female | <65 | I/II | Unknown | Unknown | PD | |
| FAM155A | SNV | Missense_Mutation | c.1291N>G | p.Leu431Val | p.L431V | B1AL88 | protein_coding | tolerated(1) | probably_damaging(0.996) | TCGA-BH-A18U-01 | Breast | breast invasive carcinoma | Female | >=65 | III/IV | Unknown | Unknown | SD | |
| FAM155A | insertion | Frame_Shift_Ins | novel | c.523_524insTTGGCTCATTCAACTTCCACCT | p.Gly175ValfsTer60 | p.G175Vfs*60 | B1AL88 | protein_coding | TCGA-AR-A0TY-01 | Breast | breast invasive carcinoma | Female | <65 | I/II | Unspecific | Paclitaxel | PD | ||
| FAM155A | SNV | Missense_Mutation | c.1361N>T | p.Ser454Leu | p.S454L | B1AL88 | protein_coding | tolerated(0.25) | benign(0.178) | TCGA-AA-3842-01 | Colorectum | colon adenocarcinoma | Male | <65 | III/IV | Chemotherapy | folinic | PD | |
| FAM155A | SNV | Missense_Mutation | c.108G>T | p.Gln36His | p.Q36H | B1AL88 | protein_coding | deleterious(0) | probably_damaging(0.993) | TCGA-AA-3984-01 | Colorectum | colon adenocarcinoma | Female | <65 | I/II | Unknown | Unknown | SD | |
| FAM155A | SNV | Missense_Mutation | c.362G>T | p.Arg121Ile | p.R121I | B1AL88 | protein_coding | tolerated_low_confidence(0.17) | probably_damaging(0.974) | TCGA-AA-A010-01 | Colorectum | colon adenocarcinoma | Female | <65 | I/II | Chemotherapy | folinic | CR | |
| FAM155A | SNV | Missense_Mutation | c.785N>T | p.Arg262Met | p.R262M | B1AL88 | protein_coding | deleterious(0.05) | possibly_damaging(0.891) | TCGA-AA-A029-01 | Colorectum | colon adenocarcinoma | Male | >=65 | I/II | Unknown | Unknown | SD | |
| FAM155A | SNV | Missense_Mutation | c.394N>A | p.Pro132Thr | p.P132T | B1AL88 | protein_coding | tolerated_low_confidence(0.2) | benign(0.187) | TCGA-CM-4744-01 | Colorectum | colon adenocarcinoma | Male | >=65 | I/II | Unknown | Unknown | SD |
| Page: 1 2 3 4 5 6 7 8 9 |
Top |
Related drugs of malignant transformation related genes |
| Identification of chemicals and drugs interact with genes involved in malignant transfromation |
| (DGIdb 4.0) |
| Entrez ID | Symbol | Category | Interaction Types | Drug Claim Name | Drug Name | PMIDs |
| Page: 1 |

Copyright 2023-Present -The University of Texas Health Science Center at Houston |