
|
|||||
|
 | |
| |
| |
| |
| |
| |
|
Gene: FAM13B |
Gene summary for FAM13B |
| Gene information | Species | Human | Gene symbol | FAM13B | Gene ID | 51306 |
| Gene name | family with sequence similarity 13 member B | |
| Gene Alias | ARHGAP49 | |
| Cytomap | 5q31.2 | |
| Gene Type | protein-coding | GO ID | GO:0007154 | UniProtAcc | Q9NYF5 |
Top |
Malignant transformation analysis |
| Identification of the aberrant gene expression in precancerous and cancerous lesions by comparing the gene expression of stem-like cells in diseased tissues with normal stem cells |
| Entrez ID | Symbol | Replicates | Species | Organ | Tissue | Adj P-value | Log2FC | Malignancy |
| 51306 | FAM13B | CCI_2 | Human | Cervix | CC | 1.19e-07 | 1.34e+00 | 0.5249 |
| 51306 | FAM13B | CCI_3 | Human | Cervix | CC | 5.29e-05 | 6.98e-01 | 0.516 |
| 51306 | FAM13B | AEH-subject1 | Human | Endometrium | AEH | 8.83e-05 | 3.28e-01 | -0.3059 |
| 51306 | FAM13B | AEH-subject2 | Human | Endometrium | AEH | 5.29e-04 | 2.33e-01 | -0.2525 |
| 51306 | FAM13B | AEH-subject3 | Human | Endometrium | AEH | 1.86e-10 | 3.31e-01 | -0.2576 |
| 51306 | FAM13B | AEH-subject4 | Human | Endometrium | AEH | 7.44e-06 | 3.51e-01 | -0.2657 |
| 51306 | FAM13B | AEH-subject5 | Human | Endometrium | AEH | 7.60e-08 | 4.01e-01 | -0.2953 |
| 51306 | FAM13B | EEC-subject1 | Human | Endometrium | EEC | 2.70e-08 | 3.37e-01 | -0.2682 |
| 51306 | FAM13B | EEC-subject4 | Human | Endometrium | EEC | 7.92e-03 | 2.00e-01 | -0.2571 |
| 51306 | FAM13B | EEC-subject5 | Human | Endometrium | EEC | 1.20e-02 | 1.96e-01 | -0.249 |
| 51306 | FAM13B | GSM6177620_NYU_UCEC1_lib1_lib1 | Human | Endometrium | EEC | 1.31e-09 | -1.36e-01 | -0.1869 |
| 51306 | FAM13B | GSM6177620_NYU_UCEC1_lib2_lib2 | Human | Endometrium | EEC | 3.65e-04 | -1.77e-01 | -0.1875 |
| 51306 | FAM13B | GSM6177620_NYU_UCEC1_lib3_lib3 | Human | Endometrium | EEC | 1.43e-09 | -1.40e-01 | -0.1883 |
| 51306 | FAM13B | GSM6177621_NYU_UCEC2_lib1_lib1 | Human | Endometrium | EEC | 6.20e-09 | -7.39e-02 | -0.1934 |
| 51306 | FAM13B | GSM6177622_NYU_UCEC3_lib1_lib1 | Human | Endometrium | EEC | 2.43e-11 | -1.75e-02 | -0.1917 |
| 51306 | FAM13B | GSM6177622_NYU_UCEC3_lib2_lib2 | Human | Endometrium | EEC | 6.79e-13 | -7.98e-02 | -0.1916 |
| 51306 | FAM13B | LZE4T | Human | Esophagus | ESCC | 8.27e-08 | 2.74e-01 | 0.0811 |
| 51306 | FAM13B | LZE5T | Human | Esophagus | ESCC | 1.87e-05 | 2.19e-01 | 0.0514 |
| 51306 | FAM13B | LZE7T | Human | Esophagus | ESCC | 1.82e-06 | 2.56e-01 | 0.0667 |
| 51306 | FAM13B | LZE8T | Human | Esophagus | ESCC | 3.84e-11 | 4.28e-01 | 0.067 |
| Page: 1 2 3 4 5 6 7 |
| Tissue | Expression Dynamics | Abbreviation |
| Cervix |  | CC: Cervix cancer |
| HSIL_HPV: HPV-infected high-grade squamous intraepithelial lesions | ||
| N_HPV: HPV-infected normal cervix | ||
| Endometrium |  | AEH: Atypical endometrial hyperplasia |
| EEC: Endometrioid Cancer | ||
| Esophagus |  | ESCC: Esophageal squamous cell carcinoma |
| HGIN: High-grade intraepithelial neoplasias | ||
| LGIN: Low-grade intraepithelial neoplasias | ||
| Liver | 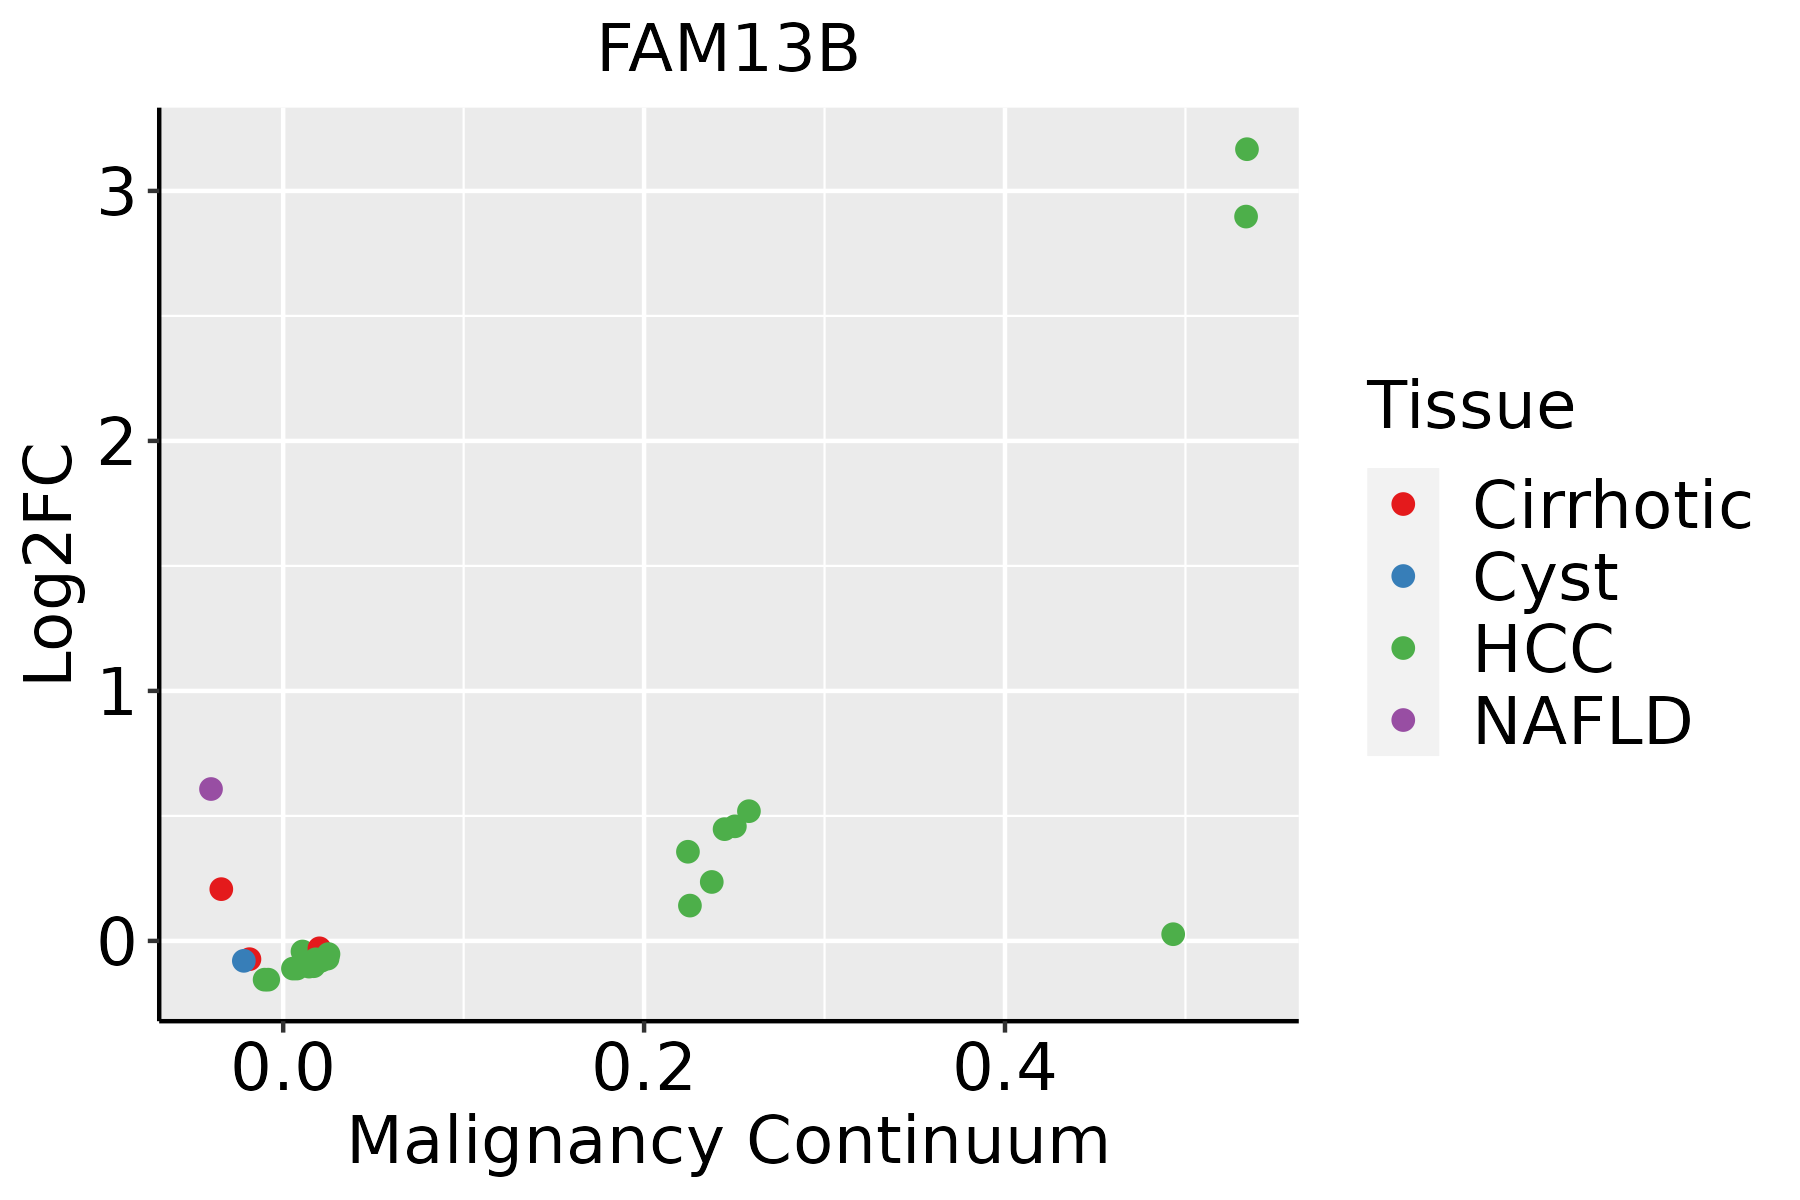 | HCC: Hepatocellular carcinoma |
| NAFLD: Non-alcoholic fatty liver disease | ||
| Lung | 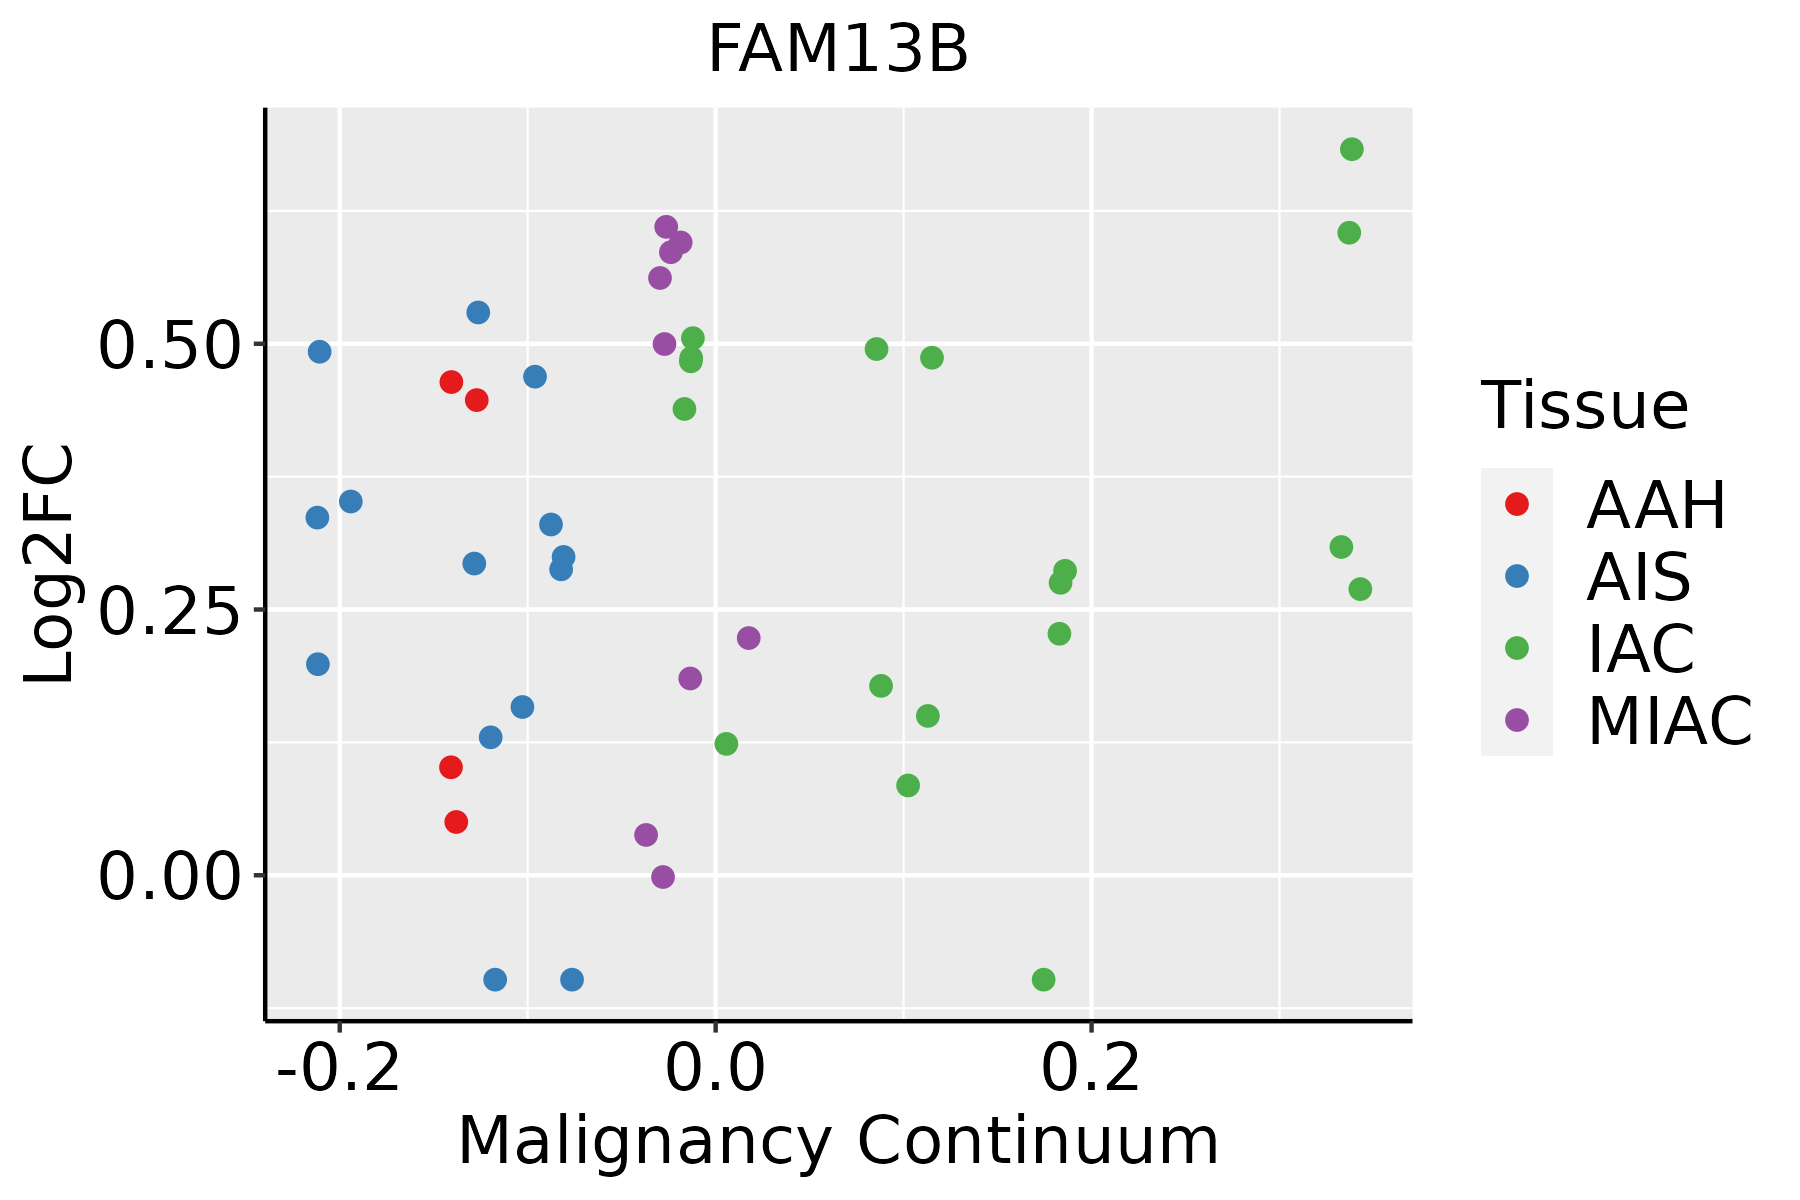 | AAH: Atypical adenomatous hyperplasia |
| AIS: Adenocarcinoma in situ | ||
| IAC: Invasive lung adenocarcinoma | ||
| MIA: Minimally invasive adenocarcinoma | ||
| Prostate | 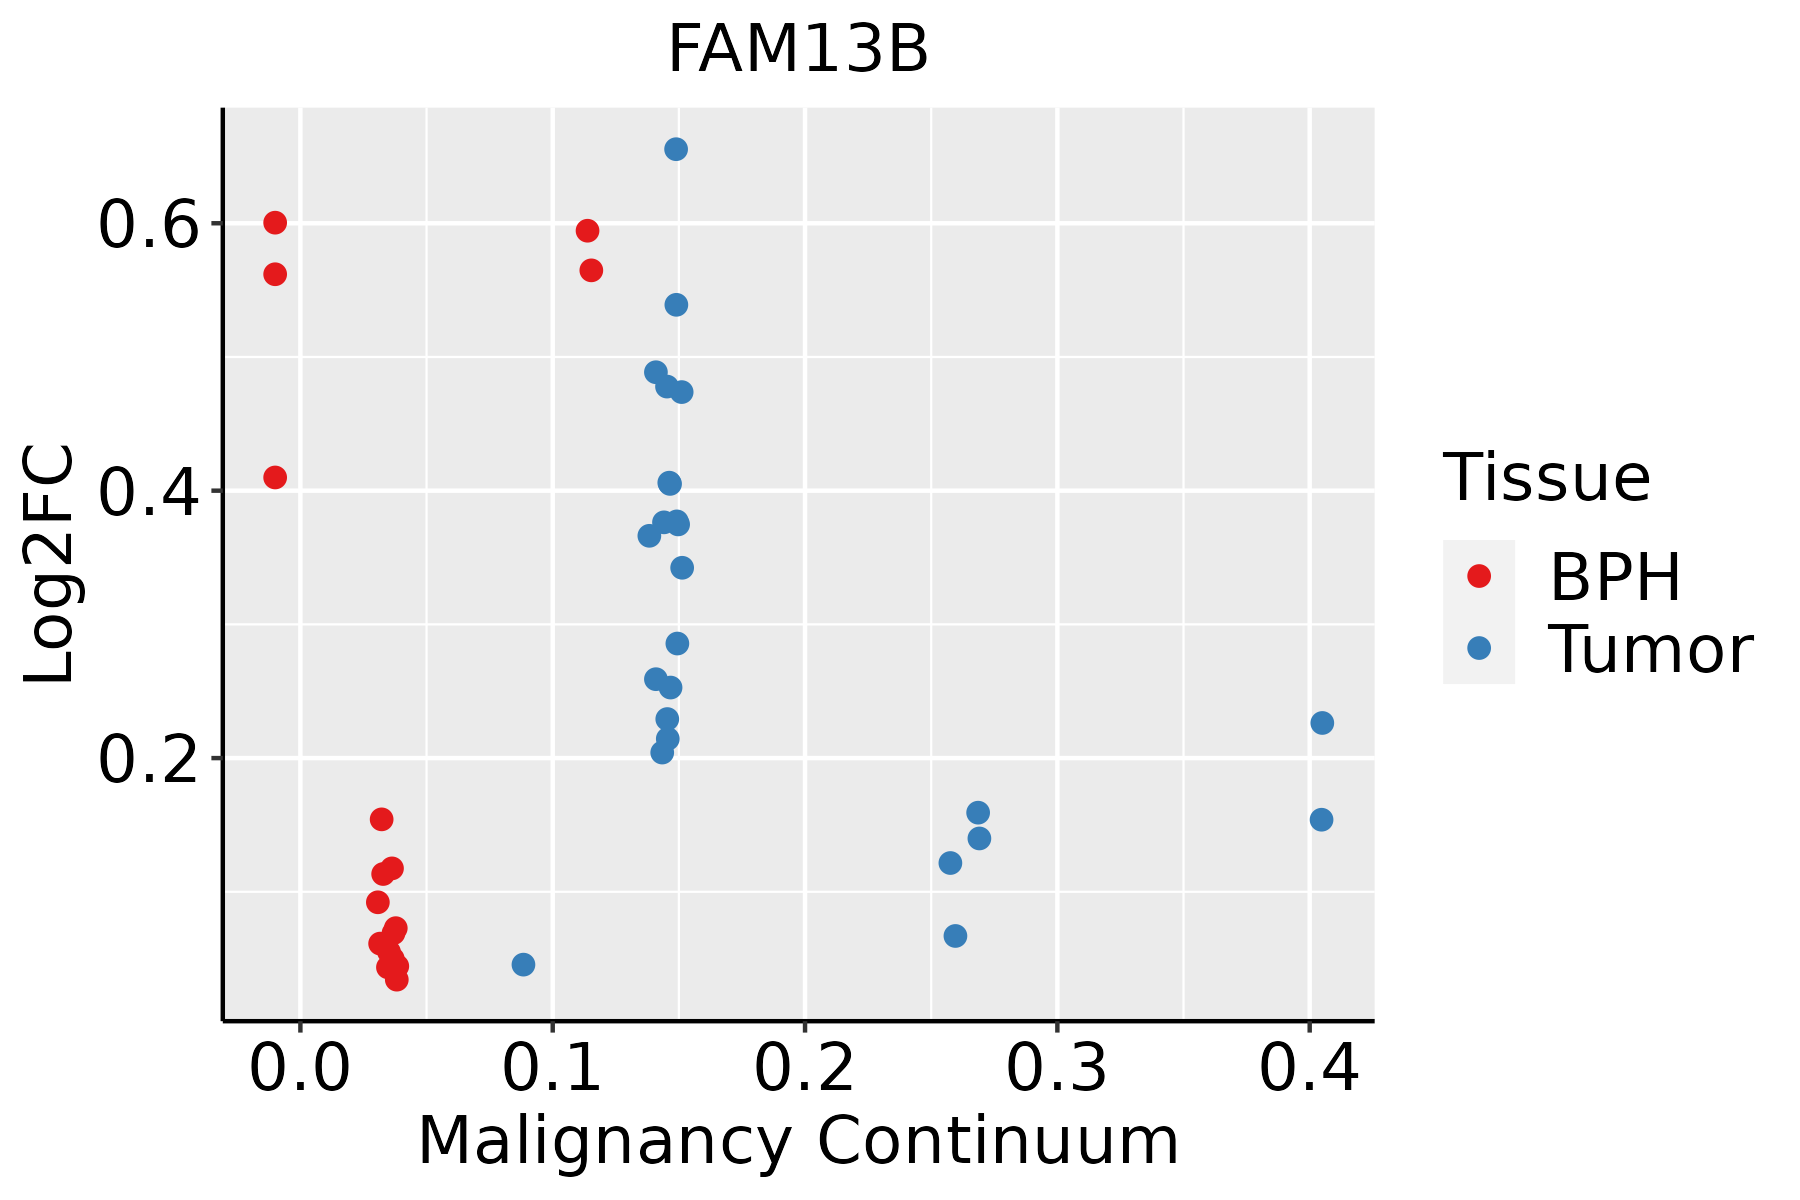 | BPH: Benign Prostatic Hyperplasia |
| Thyroid | 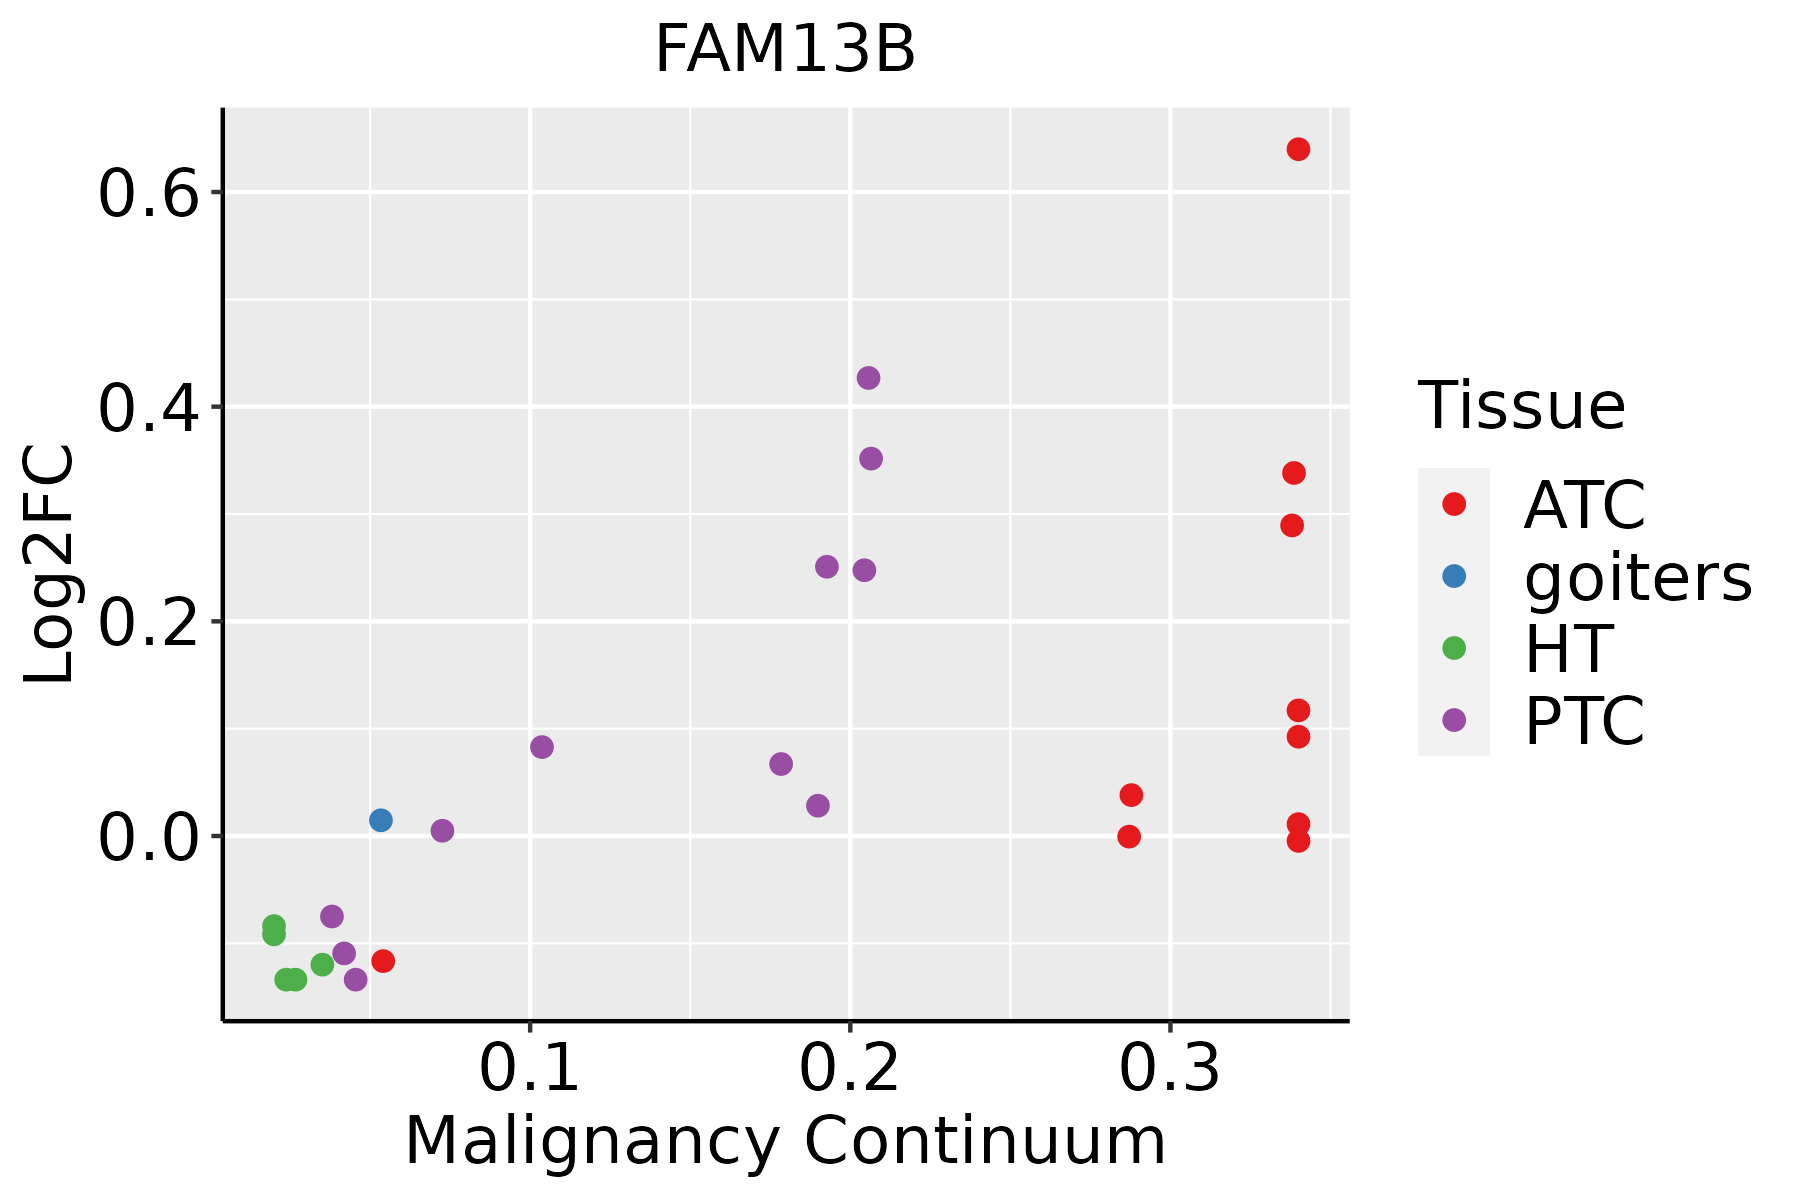 | ATC: Anaplastic thyroid cancer |
| HT: Hashimoto's thyroiditis | ||
| PTC: Papillary thyroid cancer |
| ∗log2FC in expression of this searched gene in stem-like cells from each diseased tissue sample relative to stem-like cells in normal samples in each tissue plotted against the malignancy continuum. Samples are colored based on if they are from different disease stage. |
Top |
Malignant transformation related pathway analysis |
| Find out the enriched GO biological processes and KEGG pathways involved in transition from healthy to precancer to cancer |
| Tissue | Disease Stage | Enriched GO biological Processes |
| Colorectum | AD |  |
| Colorectum | SER |  |
| Colorectum | MSS |  |
| Colorectum | MSI-H |  |
| Colorectum | FAP |  |
| ∗Top 15 enriched GO BP terms are showed in the bar plot of each disease state in each tissue. Each row represents a significant GO biological process which is colored according to the -log10(p.adjust). |
| Page: 1 2 3 4 5 6 7 8 9 |
| GO ID | Tissue | Disease Stage | Description | Gene Ratio | Bg Ratio | pvalue | p.adjust | Count |
| GO:00510566 | Cervix | CC | regulation of small GTPase mediated signal transduction | 75/2311 | 302/18723 | 1.54e-09 | 1.74e-07 | 75 |
| GO:00510567 | Endometrium | AEH | regulation of small GTPase mediated signal transduction | 59/2100 | 302/18723 | 1.43e-05 | 3.03e-04 | 59 |
| GO:005105612 | Endometrium | EEC | regulation of small GTPase mediated signal transduction | 61/2168 | 302/18723 | 9.42e-06 | 2.08e-04 | 61 |
| GO:005105610 | Esophagus | ESCC | regulation of small GTPase mediated signal transduction | 157/8552 | 302/18723 | 1.55e-02 | 4.98e-02 | 157 |
| GO:00510564 | Liver | NAFLD | regulation of small GTPase mediated signal transduction | 56/1882 | 302/18723 | 4.62e-06 | 1.75e-04 | 56 |
| GO:00510565 | Lung | IAC | regulation of small GTPase mediated signal transduction | 70/2061 | 302/18723 | 9.44e-10 | 1.87e-07 | 70 |
| GO:005105611 | Lung | AIS | regulation of small GTPase mediated signal transduction | 66/1849 | 302/18723 | 4.26e-10 | 9.53e-08 | 66 |
| GO:005105621 | Lung | MIAC | regulation of small GTPase mediated signal transduction | 35/967 | 302/18723 | 6.81e-06 | 6.35e-04 | 35 |
| GO:00510568 | Prostate | BPH | regulation of small GTPase mediated signal transduction | 78/3107 | 302/18723 | 2.69e-05 | 3.16e-04 | 78 |
| GO:005105613 | Prostate | Tumor | regulation of small GTPase mediated signal transduction | 80/3246 | 302/18723 | 3.96e-05 | 4.57e-04 | 80 |
| GO:005105617 | Thyroid | PTC | regulation of small GTPase mediated signal transduction | 132/5968 | 302/18723 | 9.26e-06 | 1.04e-04 | 132 |
| GO:005105618 | Thyroid | ATC | regulation of small GTPase mediated signal transduction | 141/6293 | 302/18723 | 1.43e-06 | 1.77e-05 | 141 |
| Page: 1 |
| Pathway ID | Tissue | Disease Stage | Description | Gene Ratio | Bg Ratio | pvalue | p.adjust | qvalue | Count |
| Page: 1 |
Top |
Cell-cell communication analysis |
| Identification of potential cell-cell interactions between two cell types and their ligand-receptor pairs for different disease states |
| Ligand | Receptor | LRpair | Pathway | Tissue | Disease Stage |
| Page: 1 |
Top |
Single-cell gene regulatory network inference analysis |
| Find out the significant the regulons (TFs) and the target genes of each regulon across cell types for different disease states |
| TF | Cell Type | Tissue | Disease Stage | Target Gene | RSS | Regulon Activity |
| ∗The dot plots of a searched regulon are shown for all cell subpopulations in each disease state of each tissue based on the regulon specific score inferred using pySCENIC and by calculating the average expression. |
| Page: 1 |
Top |
Somatic mutation of malignant transformation related genes |
| Annotation of somatic variants for genes involved in malignant transformation |
| Hugo Symbol | Variant Class | Variant Classification | dbSNP RS | HGVSc | HGVSp | HGVSp Short | SWISSPROT | BIOTYPE | SIFT | PolyPhen | Tumor Sample Barcode | Tissue | Histology | Sex | Age | Stage | Therapy Types | Drugs | Outcome |
| FAM13B | SNV | Missense_Mutation | c.1552N>T | p.Pro518Ser | p.P518S | Q9NYF5 | protein_coding | deleterious(0) | probably_damaging(0.913) | TCGA-A7-A13D-01 | Breast | breast invasive carcinoma | Female | <65 | I/II | Chemotherapy | cytoxan | SD | |
| FAM13B | SNV | Missense_Mutation | rs201081598 | c.2445N>G | p.Asn815Lys | p.N815K | Q9NYF5 | protein_coding | tolerated(0.24) | benign(0.015) | TCGA-AR-A0U0-01 | Breast | breast invasive carcinoma | Female | >=65 | I/II | Unknown | Unknown | SD |
| FAM13B | SNV | Missense_Mutation | novel | c.715G>C | p.Glu239Gln | p.E239Q | Q9NYF5 | protein_coding | tolerated(0.41) | probably_damaging(0.986) | TCGA-BH-A2L8-01 | Breast | breast invasive carcinoma | Female | <65 | I/II | Chemotherapy | cytoxan | CR |
| FAM13B | SNV | Missense_Mutation | c.2071N>G | p.Arg691Gly | p.R691G | Q9NYF5 | protein_coding | tolerated(0.37) | benign(0.079) | TCGA-C8-A12K-01 | Breast | breast invasive carcinoma | Female | >=65 | I/II | Unknown | Unknown | SD | |
| FAM13B | SNV | Missense_Mutation | c.1521G>C | p.Met507Ile | p.M507I | Q9NYF5 | protein_coding | deleterious(0.04) | probably_damaging(0.985) | TCGA-D8-A1X9-01 | Breast | breast invasive carcinoma | Female | >=65 | I/II | Chemotherapy | adriamycin+cyclophosphamide | SD | |
| FAM13B | SNV | Missense_Mutation | c.500T>C | p.Ile167Thr | p.I167T | Q9NYF5 | protein_coding | tolerated(0.3) | benign(0.147) | TCGA-D8-A1XK-01 | Breast | breast invasive carcinoma | Female | <65 | I/II | Chemotherapy | doxorubicine+cyclophosphamide | SD | |
| FAM13B | SNV | Missense_Mutation | c.1480N>A | p.Glu494Lys | p.E494K | Q9NYF5 | protein_coding | deleterious(0.02) | probably_damaging(0.997) | TCGA-D8-A27G-01 | Breast | breast invasive carcinoma | Female | >=65 | I/II | Unknown | Unknown | SD | |
| FAM13B | SNV | Missense_Mutation | c.1700N>C | p.Arg567Thr | p.R567T | Q9NYF5 | protein_coding | tolerated(0.32) | benign(0.047) | TCGA-EW-A1J5-01 | Breast | breast invasive carcinoma | Female | <65 | I/II | Chemotherapy | adriamycin | SD | |
| FAM13B | insertion | Nonsense_Mutation | novel | c.815_816insTTAATTTATTACTATTTTTTGAGACCAGAGT | p.Ile273Ter | p.I273* | Q9NYF5 | protein_coding | TCGA-BH-A0B4-01 | Breast | breast invasive carcinoma | Male | >=65 | III/IV | Hormone Therapy | tamoxiphen | SD | ||
| FAM13B | SNV | Missense_Mutation | c.2347N>A | p.Glu783Lys | p.E783K | Q9NYF5 | protein_coding | tolerated(0.91) | possibly_damaging(0.82) | TCGA-Q1-A73O-01 | Cervix | cervical & endocervical cancer | Female | <65 | I/II | Chemotherapy | cisplatin | CR |
| Page: 1 2 3 4 5 6 7 |
Top |
Related drugs of malignant transformation related genes |
| Identification of chemicals and drugs interact with genes involved in malignant transfromation |
| (DGIdb 4.0) |
| Entrez ID | Symbol | Category | Interaction Types | Drug Claim Name | Drug Name | PMIDs |
| Page: 1 |

Copyright 2023-Present -The University of Texas Health Science Center at Houston |