| Tissue | Expression Dynamics | Abbreviation |
| Cervix | 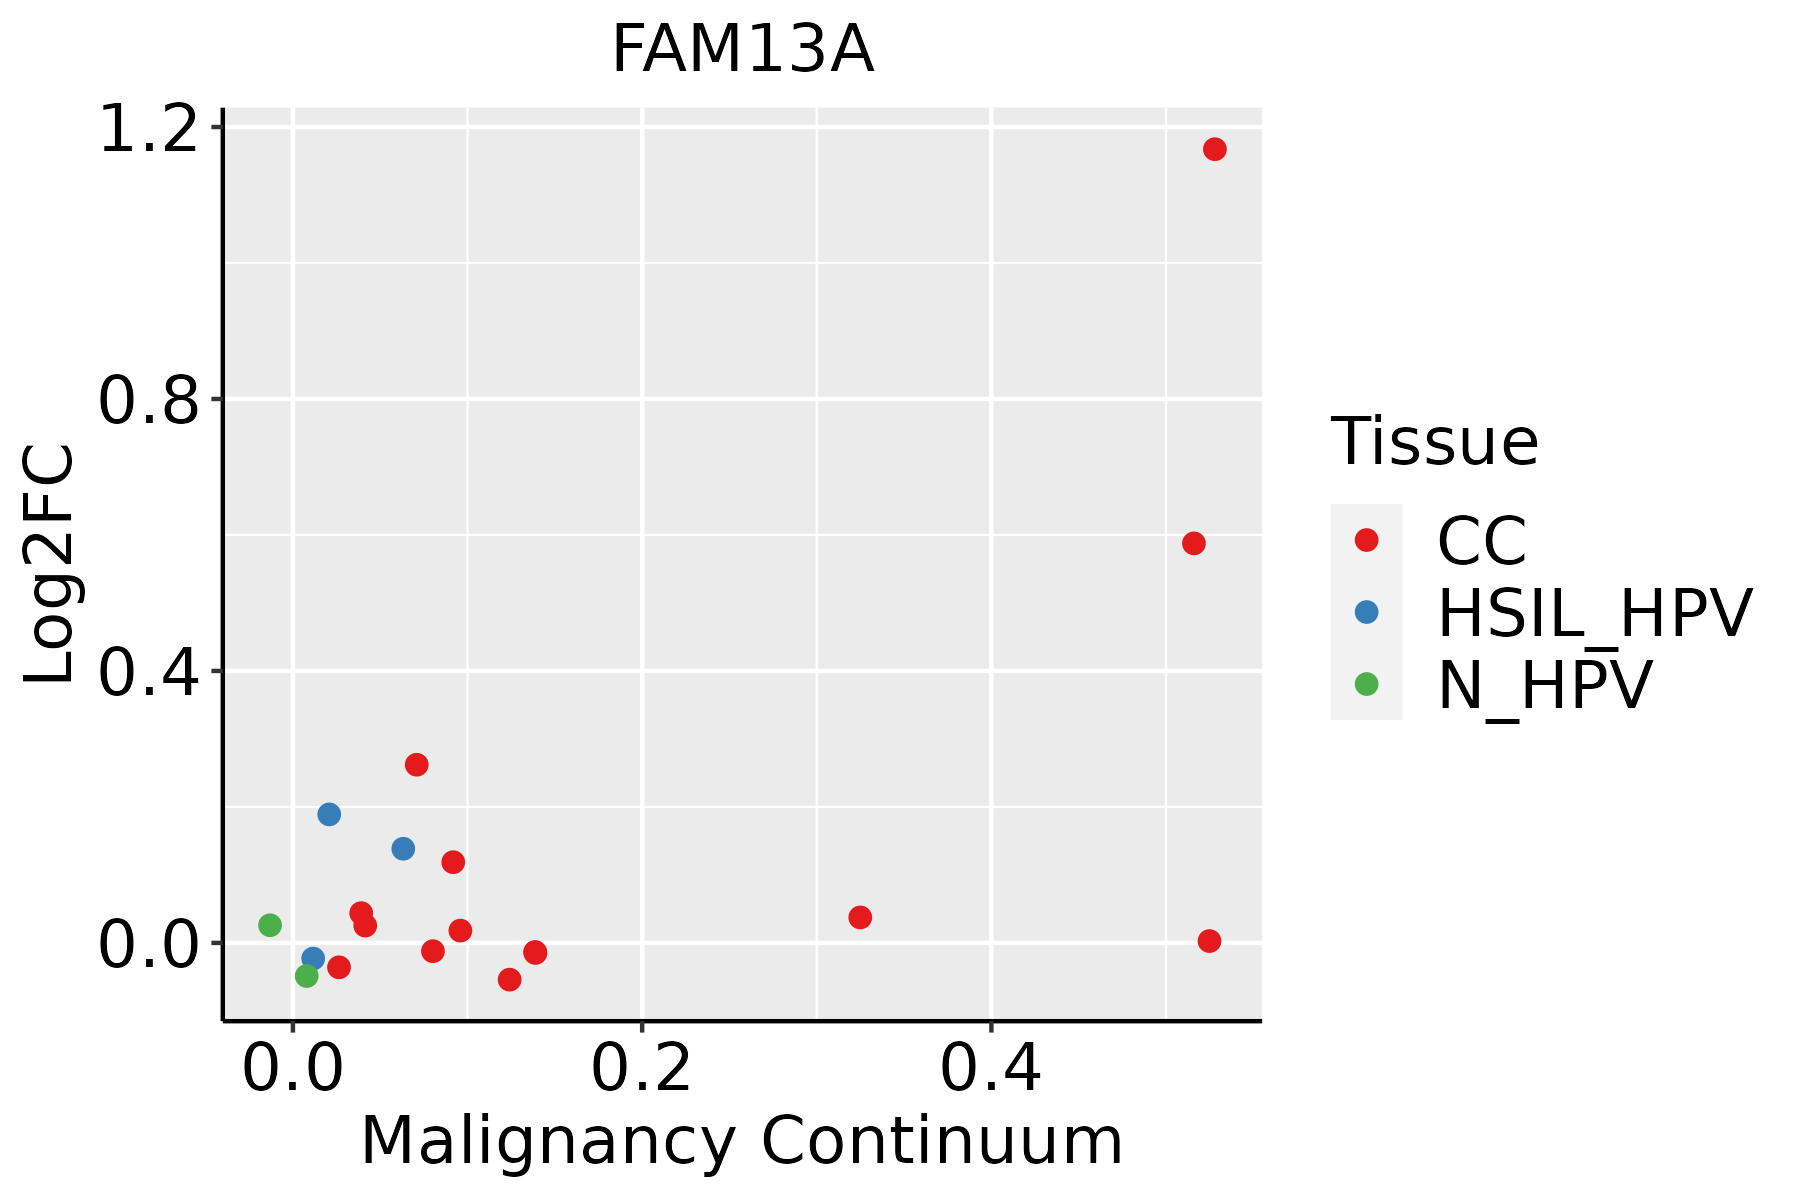 | CC: Cervix cancer |
| HSIL_HPV: HPV-infected high-grade squamous intraepithelial lesions |
| N_HPV: HPV-infected normal cervix |
| Colorectum (GSE201348) |  | FAP: Familial adenomatous polyposis |
| CRC: Colorectal cancer |
| Colorectum (HTA11) |  | AD: Adenomas |
| SER: Sessile serrated lesions |
| MSI-H: Microsatellite-high colorectal cancer |
| MSS: Microsatellite stable colorectal cancer |
| Esophagus | 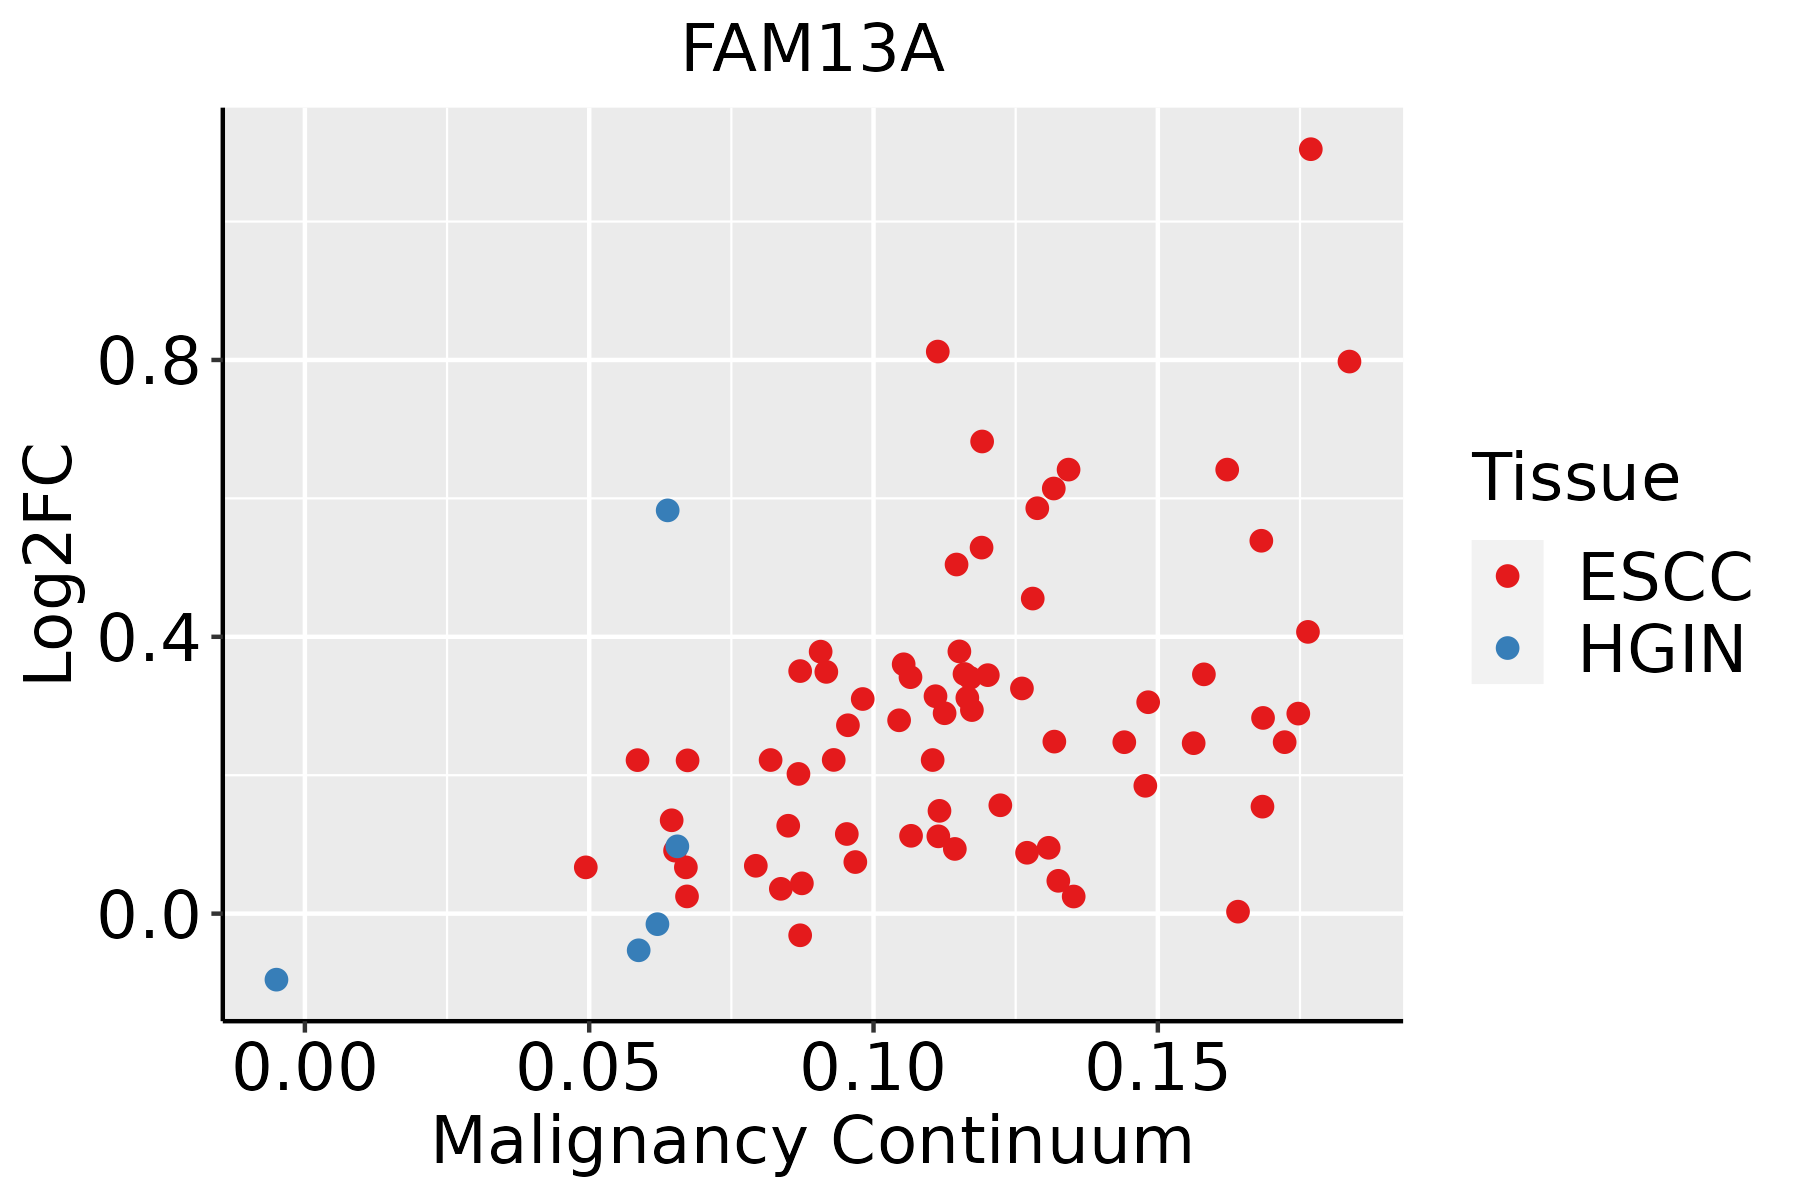 | ESCC: Esophageal squamous cell carcinoma |
| HGIN: High-grade intraepithelial neoplasias |
| LGIN: Low-grade intraepithelial neoplasias |
| Liver |  | HCC: Hepatocellular carcinoma |
| NAFLD: Non-alcoholic fatty liver disease |
| Lung | 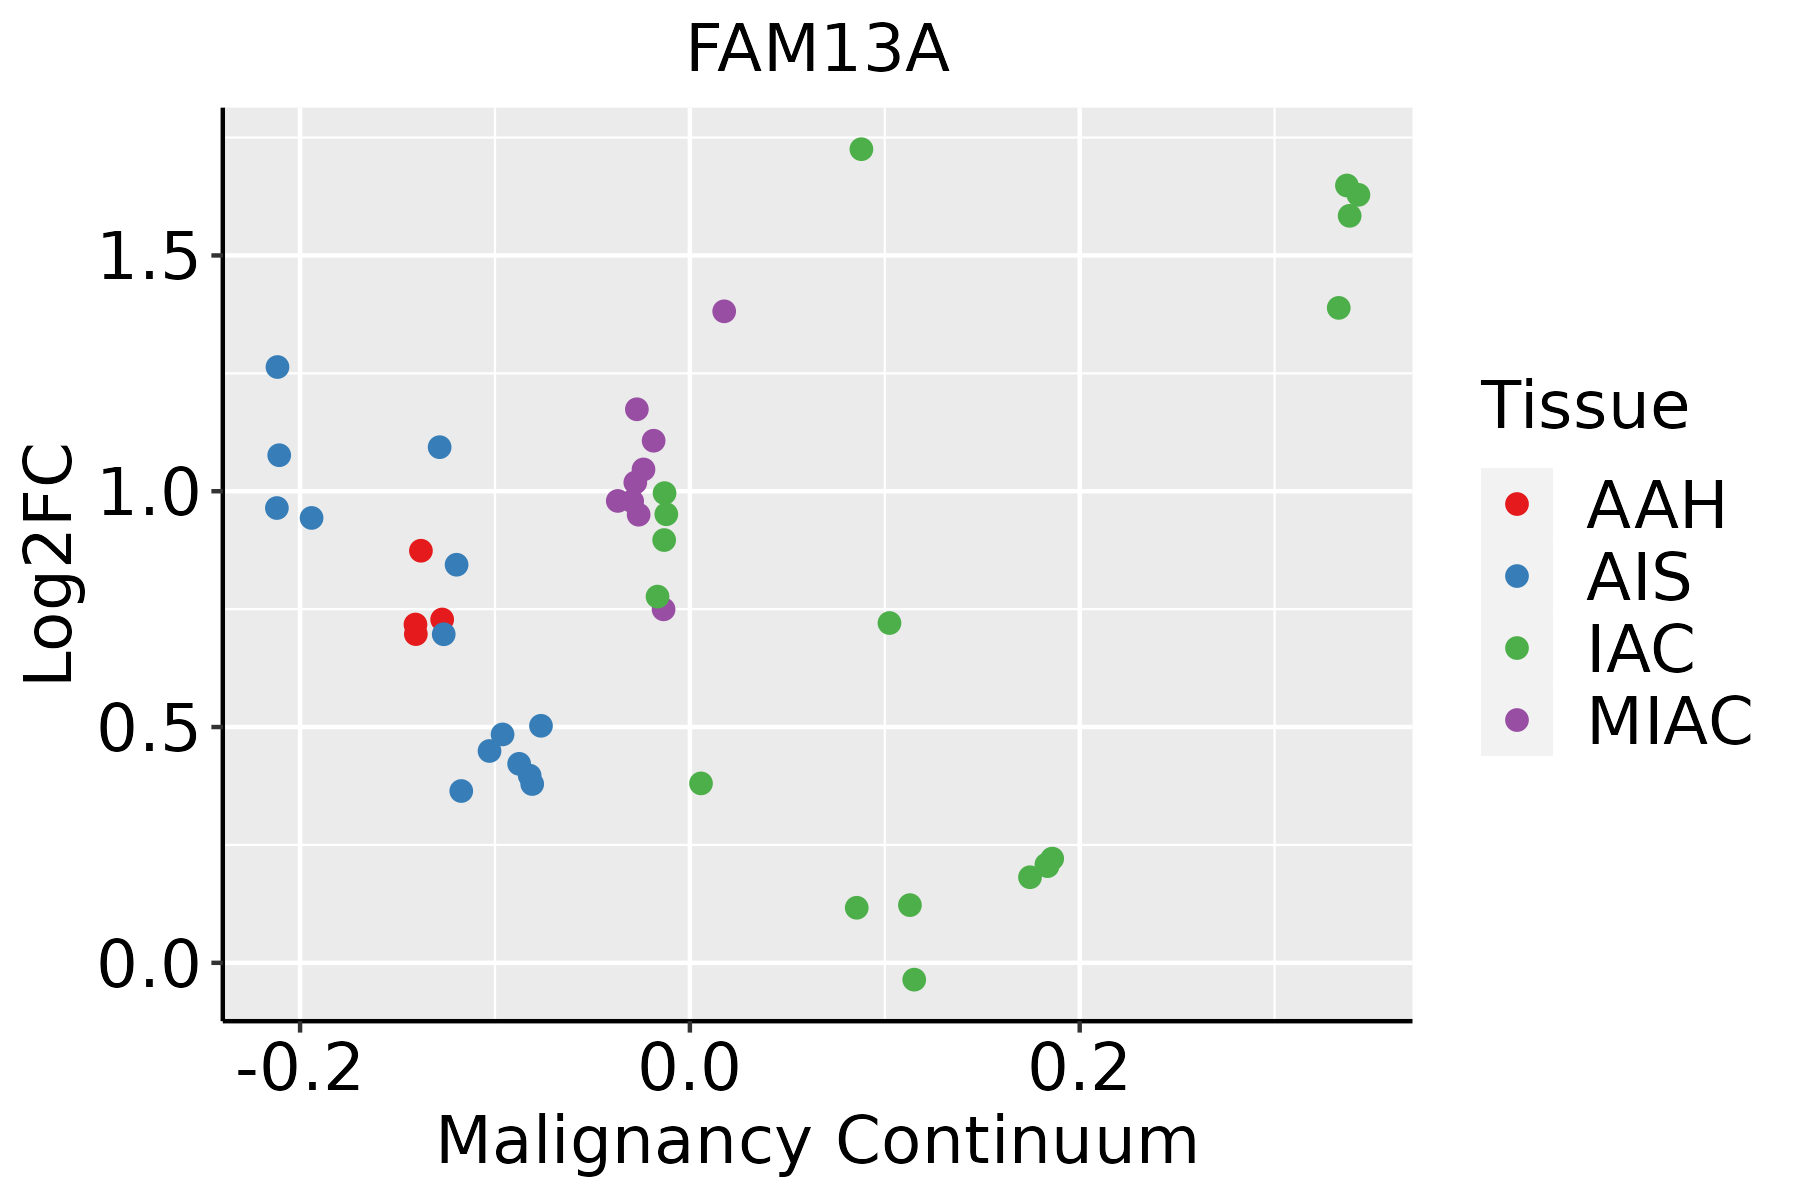 | AAH: Atypical adenomatous hyperplasia |
| AIS: Adenocarcinoma in situ |
| IAC: Invasive lung adenocarcinoma |
| MIA: Minimally invasive adenocarcinoma |
| Prostate | 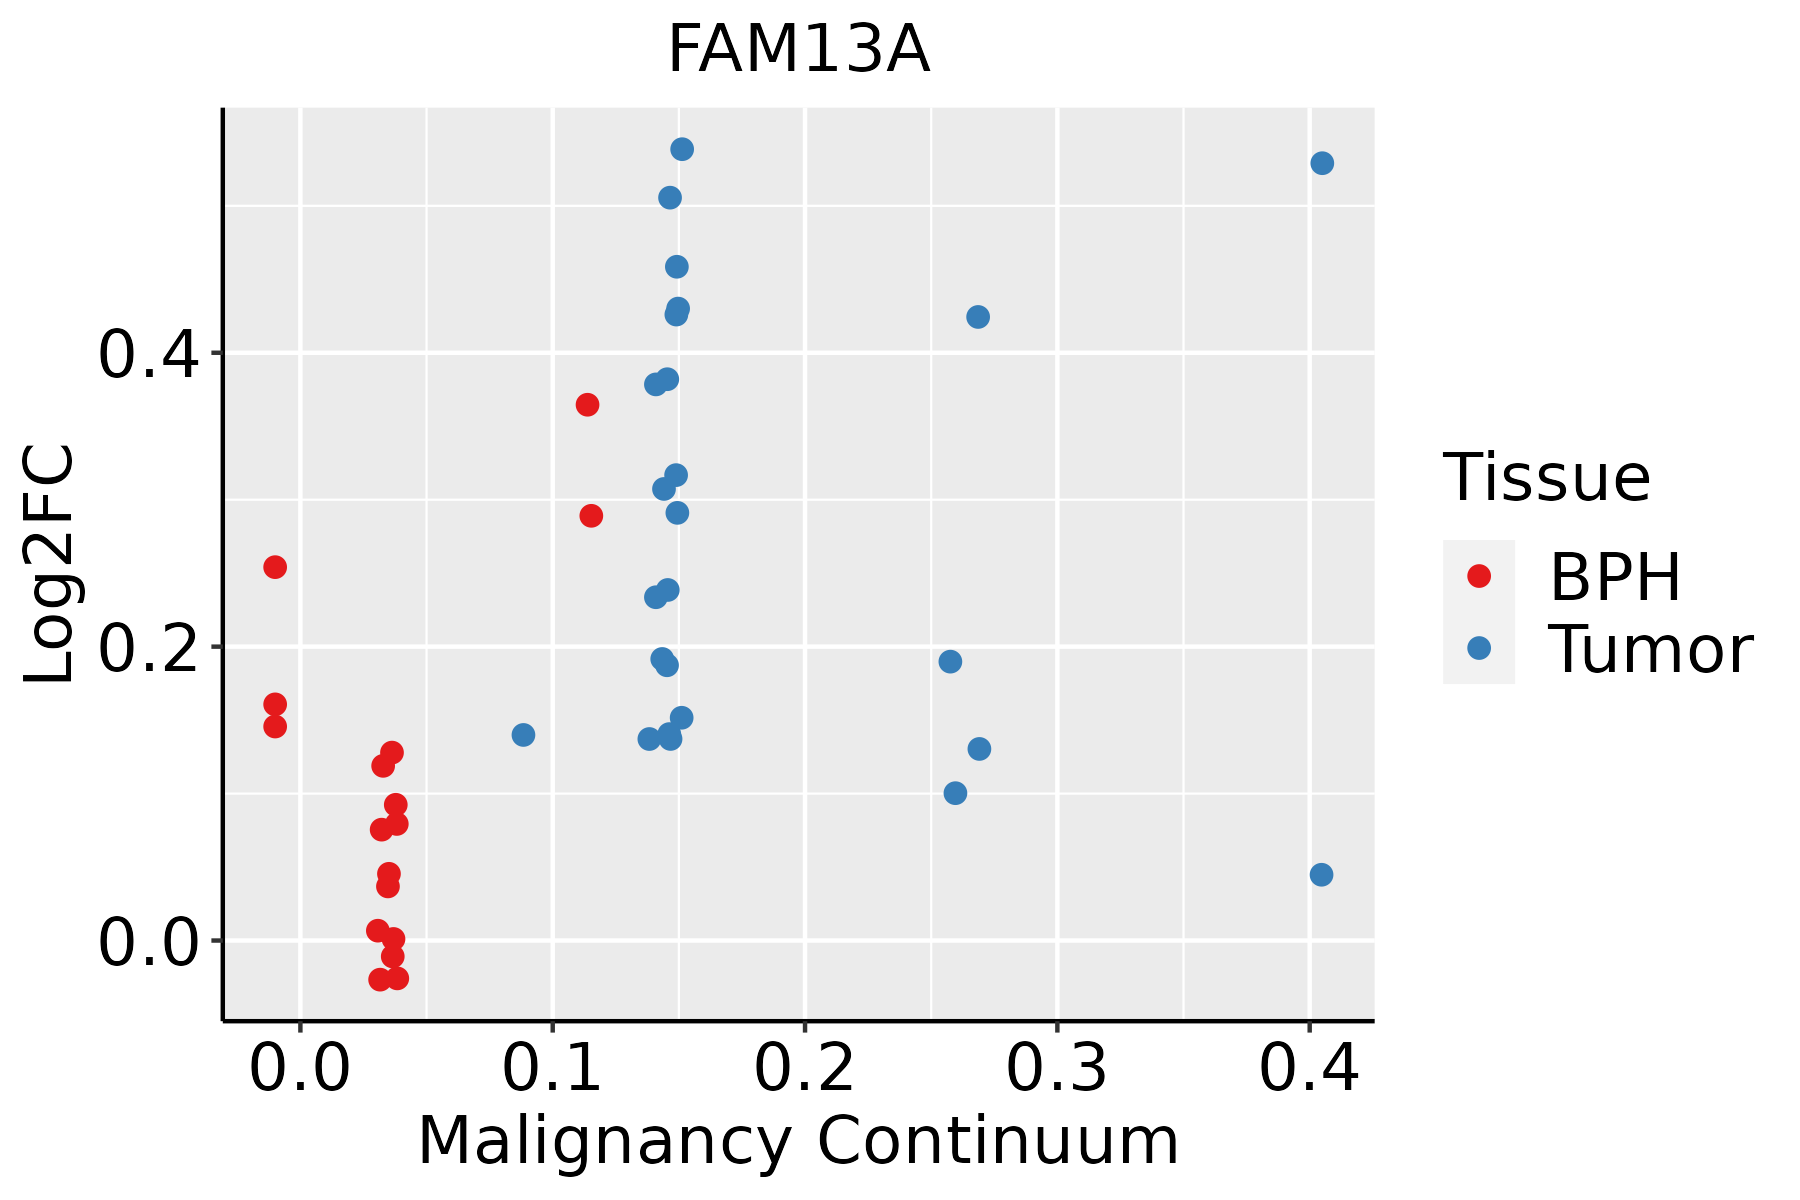 | BPH: Benign Prostatic Hyperplasia |
| Skin | 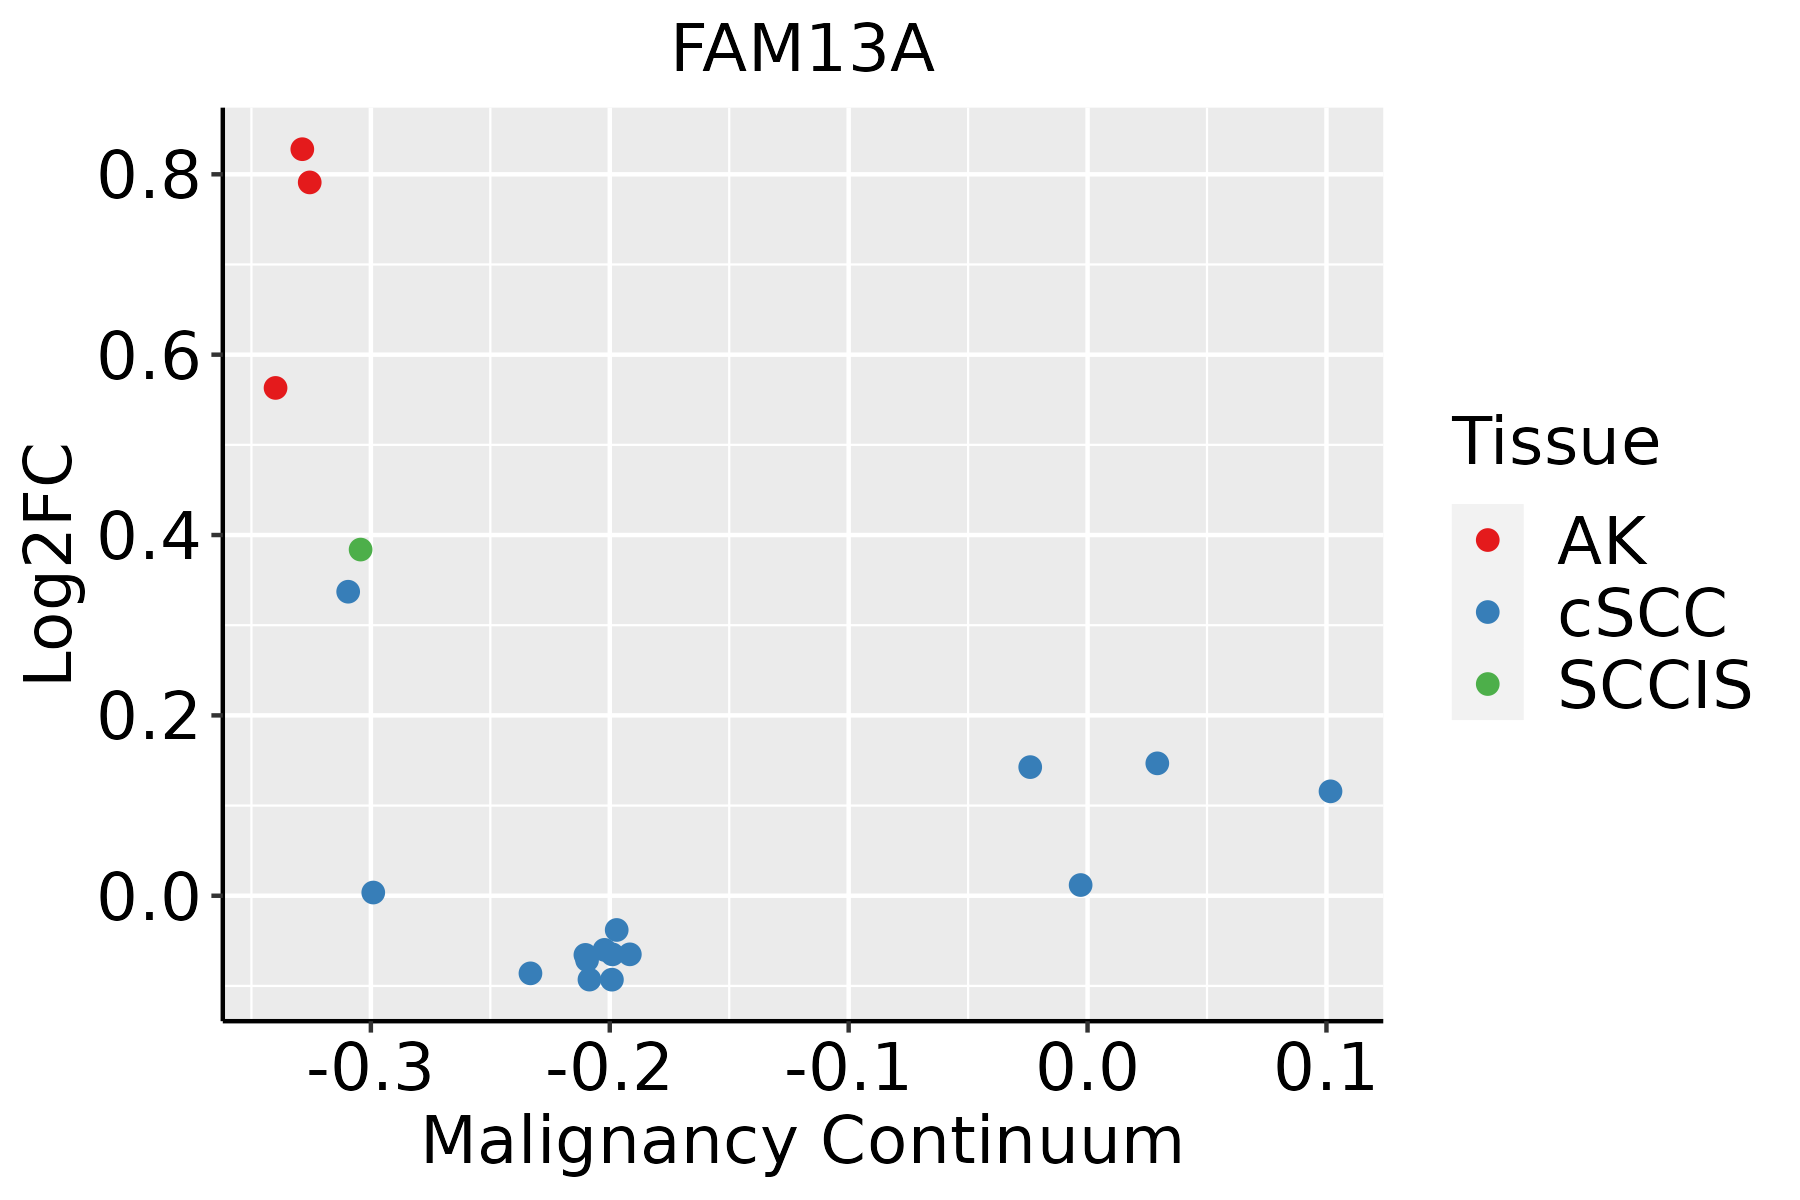 | AK: Actinic keratosis |
| cSCC: Cutaneous squamous cell carcinoma |
| SCCIS:squamous cell carcinoma in situ |
| Thyroid | 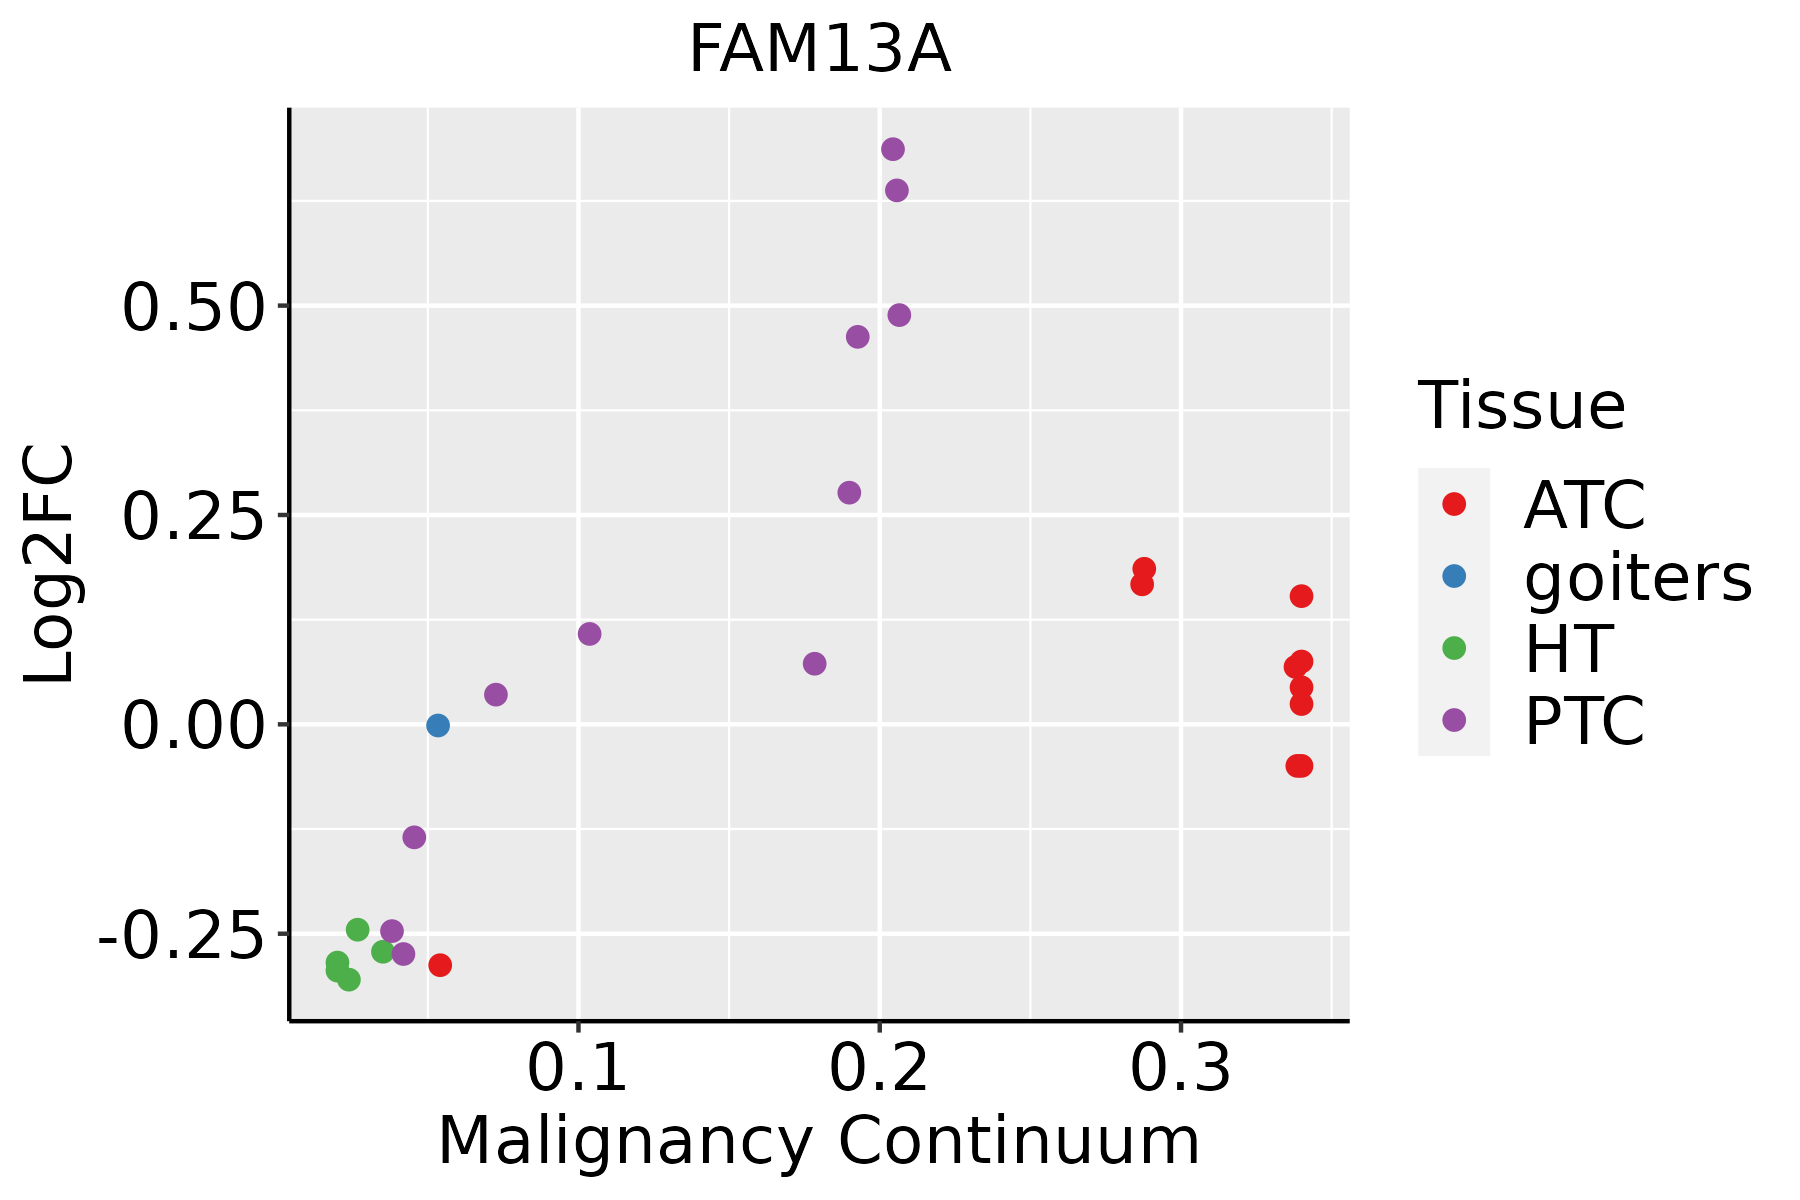 | ATC: Anaplastic thyroid cancer |
| HT: Hashimoto's thyroiditis |
| PTC: Papillary thyroid cancer |
| GO ID | Tissue | Disease Stage | Description | Gene Ratio | Bg Ratio | pvalue | p.adjust | Count |
| GO:00510566 | Cervix | CC | regulation of small GTPase mediated signal transduction | 75/2311 | 302/18723 | 1.54e-09 | 1.74e-07 | 75 |
| GO:0051056 | Colorectum | AD | regulation of small GTPase mediated signal transduction | 94/3918 | 302/18723 | 1.81e-05 | 3.76e-04 | 94 |
| GO:00510561 | Colorectum | MSS | regulation of small GTPase mediated signal transduction | 82/3467 | 302/18723 | 1.31e-04 | 1.99e-03 | 82 |
| GO:00510562 | Colorectum | FAP | regulation of small GTPase mediated signal transduction | 78/2622 | 302/18723 | 3.25e-08 | 2.85e-06 | 78 |
| GO:00510563 | Colorectum | CRC | regulation of small GTPase mediated signal transduction | 69/2078 | 302/18723 | 3.34e-09 | 9.08e-07 | 69 |
| GO:005105610 | Esophagus | ESCC | regulation of small GTPase mediated signal transduction | 157/8552 | 302/18723 | 1.55e-02 | 4.98e-02 | 157 |
| GO:00510564 | Liver | NAFLD | regulation of small GTPase mediated signal transduction | 56/1882 | 302/18723 | 4.62e-06 | 1.75e-04 | 56 |
| GO:00510565 | Lung | IAC | regulation of small GTPase mediated signal transduction | 70/2061 | 302/18723 | 9.44e-10 | 1.87e-07 | 70 |
| GO:005105611 | Lung | AIS | regulation of small GTPase mediated signal transduction | 66/1849 | 302/18723 | 4.26e-10 | 9.53e-08 | 66 |
| GO:005105621 | Lung | MIAC | regulation of small GTPase mediated signal transduction | 35/967 | 302/18723 | 6.81e-06 | 6.35e-04 | 35 |
| GO:00510568 | Prostate | BPH | regulation of small GTPase mediated signal transduction | 78/3107 | 302/18723 | 2.69e-05 | 3.16e-04 | 78 |
| GO:005105613 | Prostate | Tumor | regulation of small GTPase mediated signal transduction | 80/3246 | 302/18723 | 3.96e-05 | 4.57e-04 | 80 |
| GO:005105615 | Skin | AK | regulation of small GTPase mediated signal transduction | 48/1910 | 302/18723 | 1.28e-03 | 9.69e-03 | 48 |
| GO:005105616 | Skin | SCCIS | regulation of small GTPase mediated signal transduction | 33/919 | 302/18723 | 1.49e-05 | 4.86e-04 | 33 |
| GO:005105617 | Thyroid | PTC | regulation of small GTPase mediated signal transduction | 132/5968 | 302/18723 | 9.26e-06 | 1.04e-04 | 132 |
| GO:005105618 | Thyroid | ATC | regulation of small GTPase mediated signal transduction | 141/6293 | 302/18723 | 1.43e-06 | 1.77e-05 | 141 |
| Hugo Symbol | Variant Class | Variant Classification | dbSNP RS | HGVSc | HGVSp | HGVSp Short | SWISSPROT | BIOTYPE | SIFT | PolyPhen | Tumor Sample Barcode | Tissue | Histology | Sex | Age | Stage | Therapy Types | Drugs | Outcome |
| FAM13A | SNV | Missense_Mutation | | c.1177N>C | p.Glu393Gln | p.E393Q | O94988 | protein_coding | tolerated(0.4) | benign(0.13) | TCGA-3C-AALI-01 | Breast | breast invasive carcinoma | Female | <65 | I/II | Unspecific | Poly E | Complete Response |
| FAM13A | SNV | Missense_Mutation | | c.1047N>C | p.Leu349Phe | p.L349F | O94988 | protein_coding | deleterious(0.02) | benign(0.383) | TCGA-A2-A0EY-01 | Breast | breast invasive carcinoma | Female | <65 | I/II | Chemotherapy | adriamycin | SD |
| FAM13A | SNV | Missense_Mutation | | c.376N>A | p.Asp126Asn | p.D126N | O94988 | protein_coding | deleterious(0.01) | benign(0.125) | TCGA-A2-A0YK-01 | Breast | breast invasive carcinoma | Female | <65 | I/II | Chemotherapy | cytoxan | SD |
| FAM13A | SNV | Missense_Mutation | | c.2758G>A | p.Asp920Asn | p.D920N | O94988 | protein_coding | deleterious(0) | probably_damaging(0.997) | TCGA-BH-A0H5-01 | Breast | breast invasive carcinoma | Female | <65 | I/II | Chemotherapy | cytoxan | CR |
| FAM13A | SNV | Missense_Mutation | | c.1855C>T | p.Arg619Trp | p.R619W | O94988 | protein_coding | deleterious(0) | probably_damaging(0.999) | TCGA-D8-A1XZ-01 | Breast | breast invasive carcinoma | Female | >=65 | III/IV | Hormone Therapy | tamoxiphen+anastrozolum | SD |
| FAM13A | SNV | Missense_Mutation | | c.2410G>C | p.Glu804Gln | p.E804Q | O94988 | protein_coding | deleterious(0) | probably_damaging(0.996) | TCGA-D8-A27G-01 | Breast | breast invasive carcinoma | Female | >=65 | I/II | Unknown | Unknown | SD |
| FAM13A | insertion | Frame_Shift_Ins | novel | c.1834_1835insCACTCCCC | p.Ser612ThrfsTer38 | p.S612Tfs*38 | O94988 | protein_coding | | | TCGA-A8-A09E-01 | Breast | breast invasive carcinoma | Female | >=65 | III/IV | Hormone Therapy | anastrozole | SD |
| FAM13A | insertion | Nonsense_Mutation | novel | c.2867_2868insTACTTCTTGAAAGTTTGG | p.Gln956delinsHisThrSerTerLysPheGly | p.Q956delinsHTS*KFG | O94988 | protein_coding | | | TCGA-AN-A0FX-01 | Breast | breast invasive carcinoma | Female | <65 | I/II | Unknown | Unknown | SD |
| FAM13A | insertion | Frame_Shift_Ins | novel | c.2816_2817insAA | p.Leu940SerfsTer20 | p.L940Sfs*20 | O94988 | protein_coding | | | TCGA-AO-A0JM-01 | Breast | breast invasive carcinoma | Female | <65 | I/II | Chemotherapy | doxorubicin | SD |
| FAM13A | insertion | Frame_Shift_Ins | novel | c.2814_2815insAGAAACTTCGGGATTTTGAAGACAACTTTTTCAGACAGAAT | p.Gly939ArgfsTer34 | p.G939Rfs*34 | O94988 | protein_coding | | | TCGA-AO-A0JM-01 | Breast | breast invasive carcinoma | Female | <65 | I/II | Chemotherapy | doxorubicin | SD |


