
|
|||||
|
 | |
| |
| |
| |
| |
| |
|
Gene: FAM136A |
Gene summary for FAM136A |
| Gene information | Species | Human | Gene symbol | FAM136A | Gene ID | 84908 |
| Gene name | family with sequence similarity 136 member A | |
| Gene Alias | FAM136A | |
| Cytomap | 2p13.3 | |
| Gene Type | protein-coding | GO ID | GO:0005575 | UniProtAcc | E7EQY1 |
Top |
Malignant transformation analysis |
| Identification of the aberrant gene expression in precancerous and cancerous lesions by comparing the gene expression of stem-like cells in diseased tissues with normal stem cells |
| Entrez ID | Symbol | Replicates | Species | Organ | Tissue | Adj P-value | Log2FC | Malignancy |
| 84908 | FAM136A | LZE2T | Human | Esophagus | ESCC | 6.50e-08 | 1.30e+00 | 0.082 |
| 84908 | FAM136A | LZE4T | Human | Esophagus | ESCC | 4.94e-28 | 8.76e-01 | 0.0811 |
| 84908 | FAM136A | LZE5T | Human | Esophagus | ESCC | 1.23e-02 | 4.89e-01 | 0.0514 |
| 84908 | FAM136A | LZE7T | Human | Esophagus | ESCC | 2.66e-09 | 9.13e-01 | 0.0667 |
| 84908 | FAM136A | LZE8T | Human | Esophagus | ESCC | 4.98e-07 | 1.98e-01 | 0.067 |
| 84908 | FAM136A | LZE20T | Human | Esophagus | ESCC | 1.11e-07 | 3.37e-01 | 0.0662 |
| 84908 | FAM136A | LZE22D1 | Human | Esophagus | HGIN | 1.43e-03 | 3.07e-01 | 0.0595 |
| 84908 | FAM136A | LZE22T | Human | Esophagus | ESCC | 1.17e-06 | 5.55e-01 | 0.068 |
| 84908 | FAM136A | LZE24T | Human | Esophagus | ESCC | 3.56e-27 | 8.29e-01 | 0.0596 |
| 84908 | FAM136A | LZE21T | Human | Esophagus | ESCC | 7.70e-04 | 4.10e-01 | 0.0655 |
| 84908 | FAM136A | LZE6T | Human | Esophagus | ESCC | 6.09e-06 | 5.55e-01 | 0.0845 |
| 84908 | FAM136A | P1T-E | Human | Esophagus | ESCC | 5.07e-14 | 8.37e-01 | 0.0875 |
| 84908 | FAM136A | P2T-E | Human | Esophagus | ESCC | 3.45e-65 | 1.27e+00 | 0.1177 |
| 84908 | FAM136A | P4T-E | Human | Esophagus | ESCC | 9.21e-56 | 1.51e+00 | 0.1323 |
| 84908 | FAM136A | P5T-E | Human | Esophagus | ESCC | 6.81e-56 | 1.17e+00 | 0.1327 |
| 84908 | FAM136A | P8T-E | Human | Esophagus | ESCC | 2.14e-31 | 6.92e-01 | 0.0889 |
| 84908 | FAM136A | P9T-E | Human | Esophagus | ESCC | 2.33e-24 | 6.42e-01 | 0.1131 |
| 84908 | FAM136A | P10T-E | Human | Esophagus | ESCC | 3.56e-61 | 1.02e+00 | 0.116 |
| 84908 | FAM136A | P11T-E | Human | Esophagus | ESCC | 4.83e-10 | 6.59e-01 | 0.1426 |
| 84908 | FAM136A | P12T-E | Human | Esophagus | ESCC | 9.47e-41 | 8.09e-01 | 0.1122 |
| Page: 1 2 3 4 5 6 7 |
| Tissue | Expression Dynamics | Abbreviation |
| Esophagus | 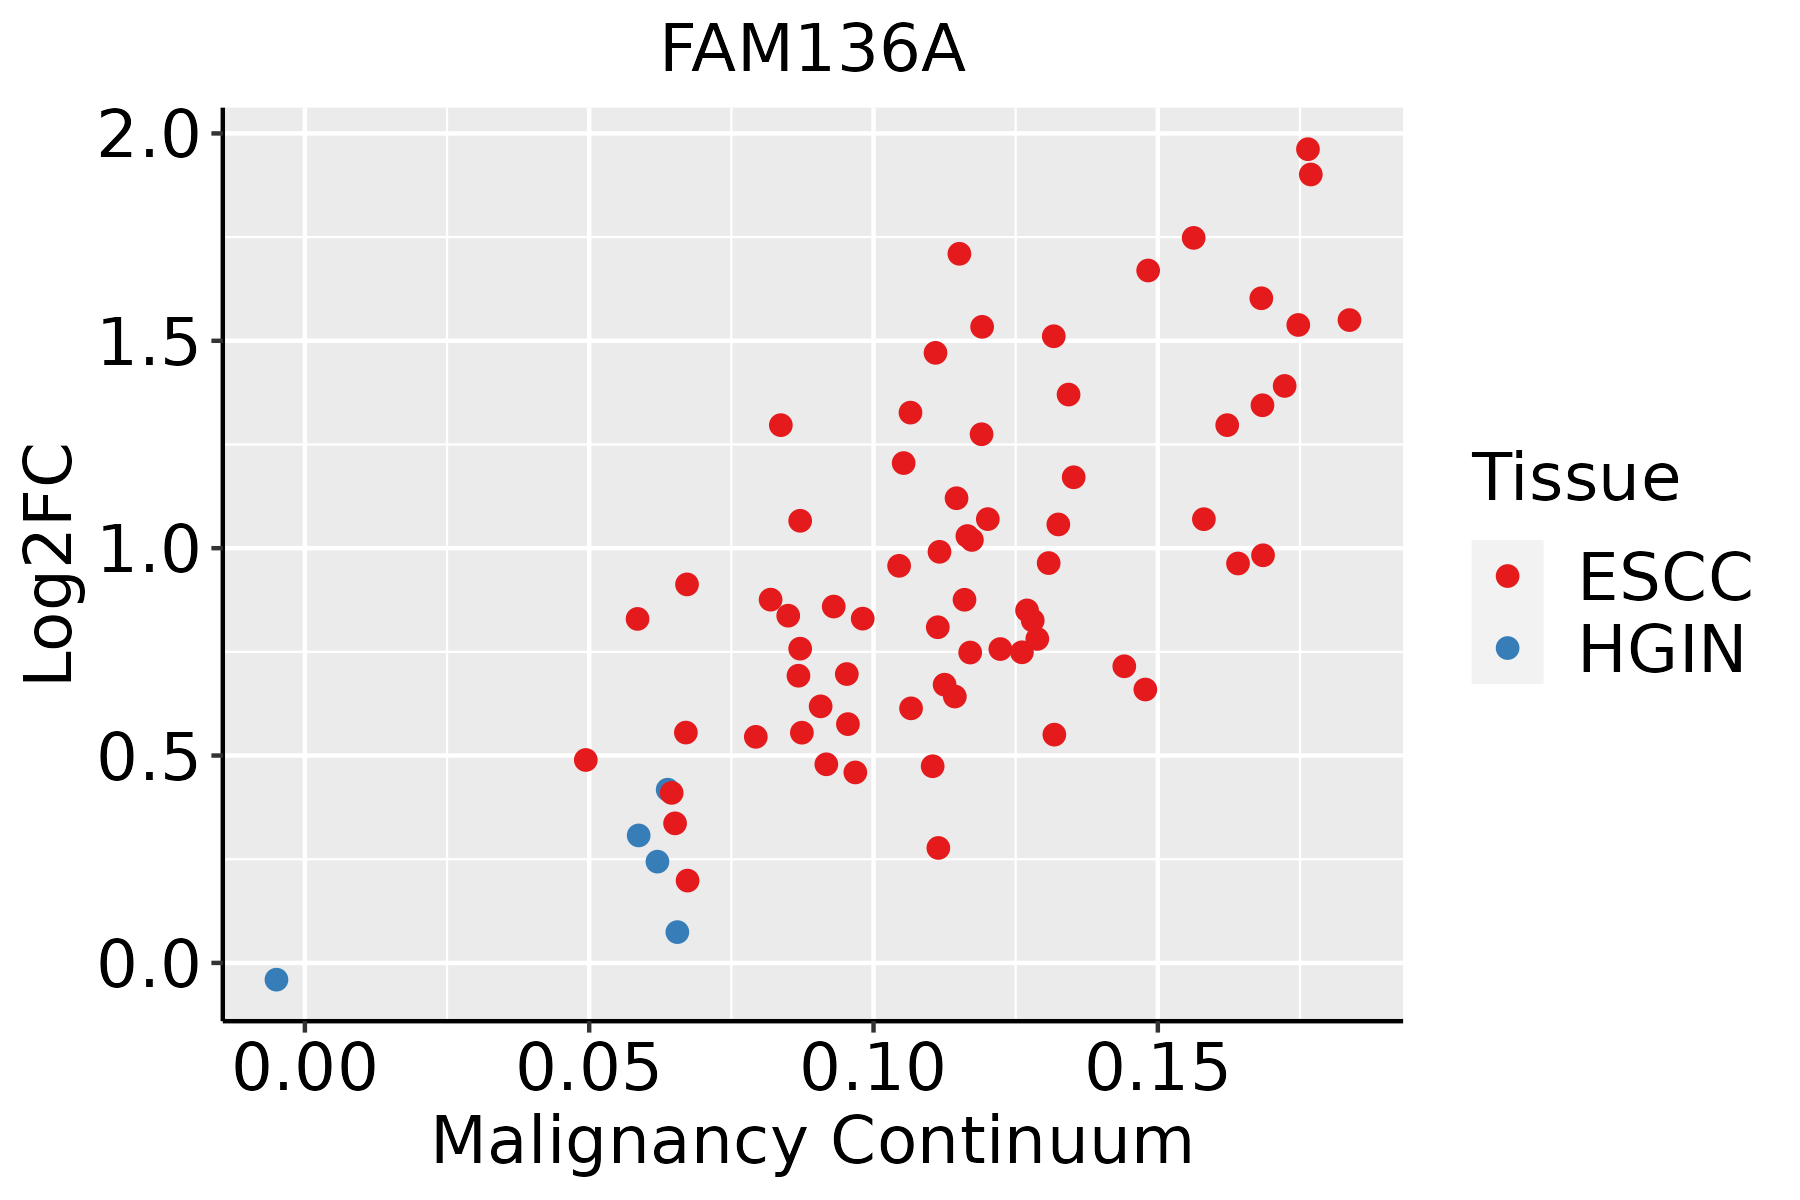 | ESCC: Esophageal squamous cell carcinoma |
| HGIN: High-grade intraepithelial neoplasias | ||
| LGIN: Low-grade intraepithelial neoplasias | ||
| Liver | 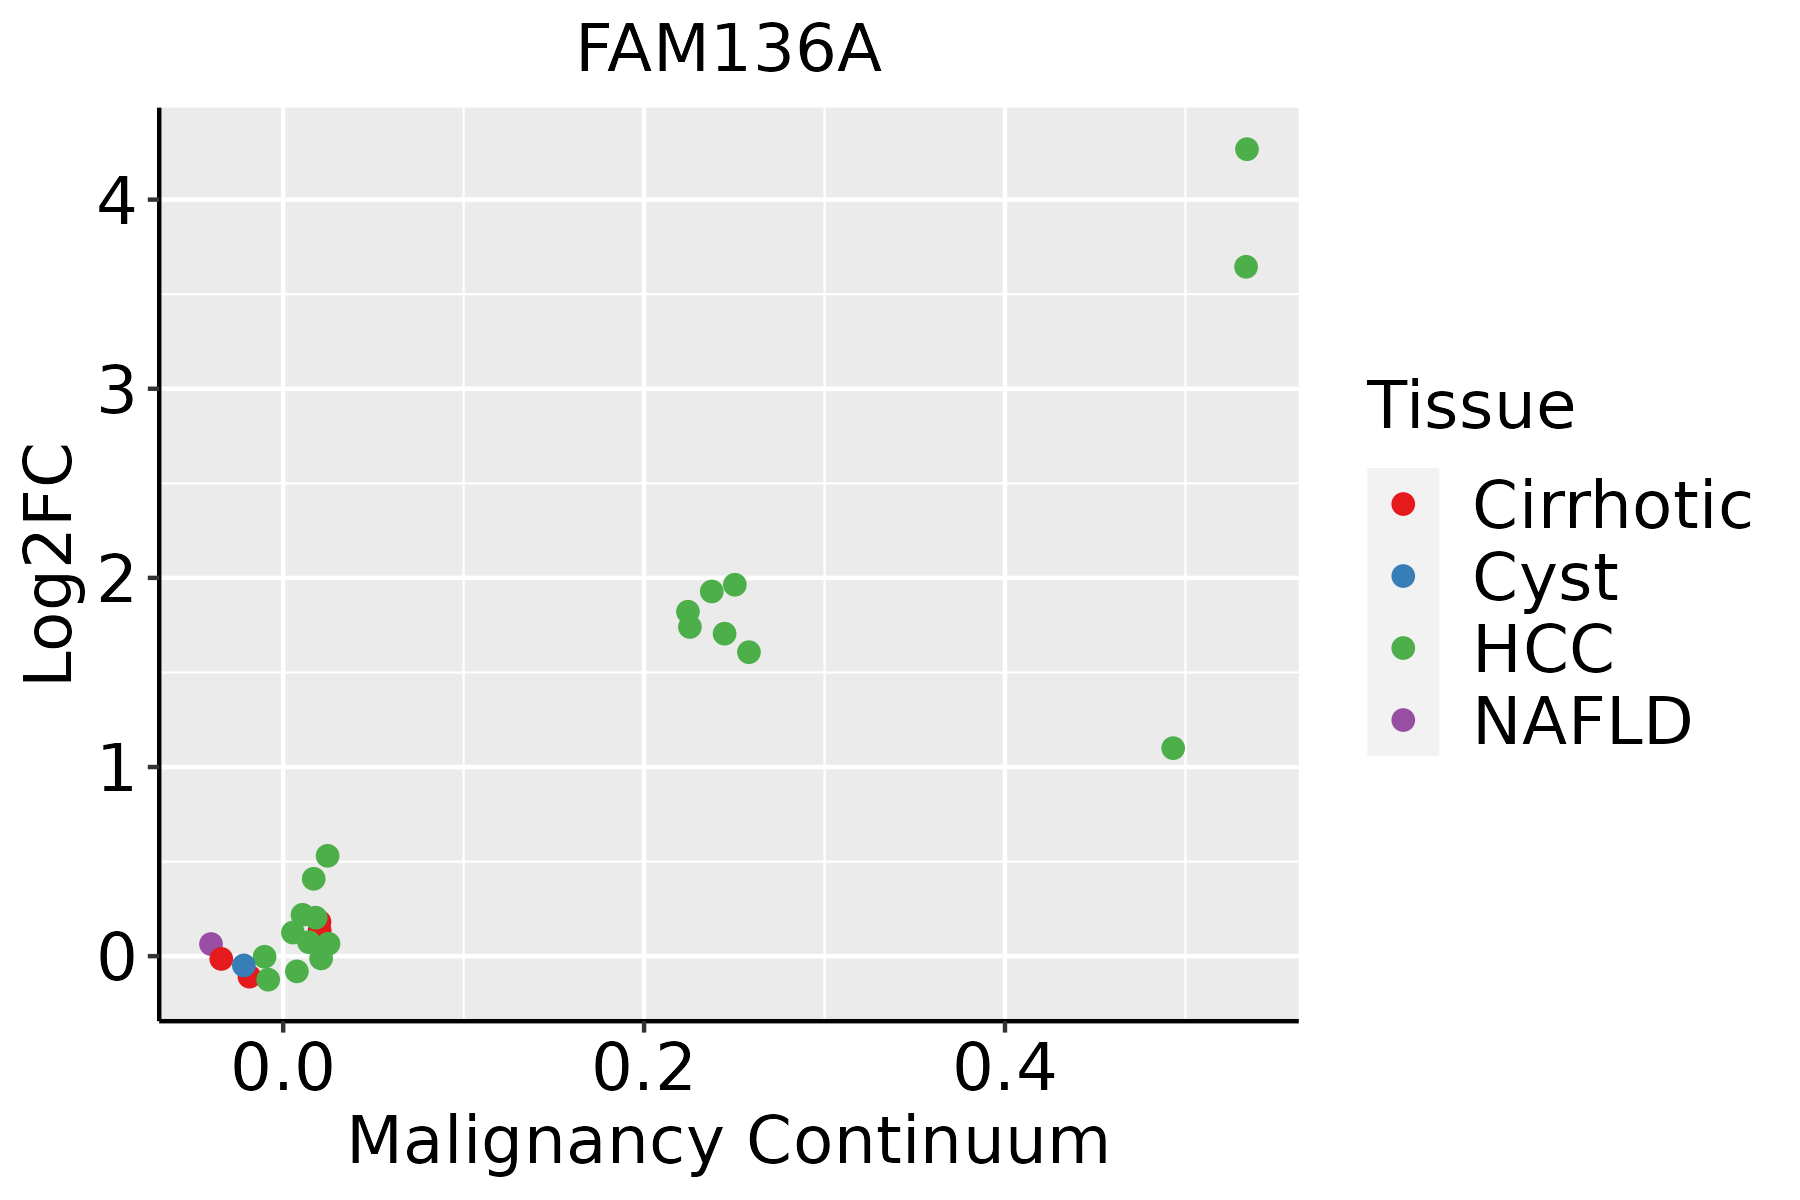 | HCC: Hepatocellular carcinoma |
| NAFLD: Non-alcoholic fatty liver disease | ||
| Oral Cavity | 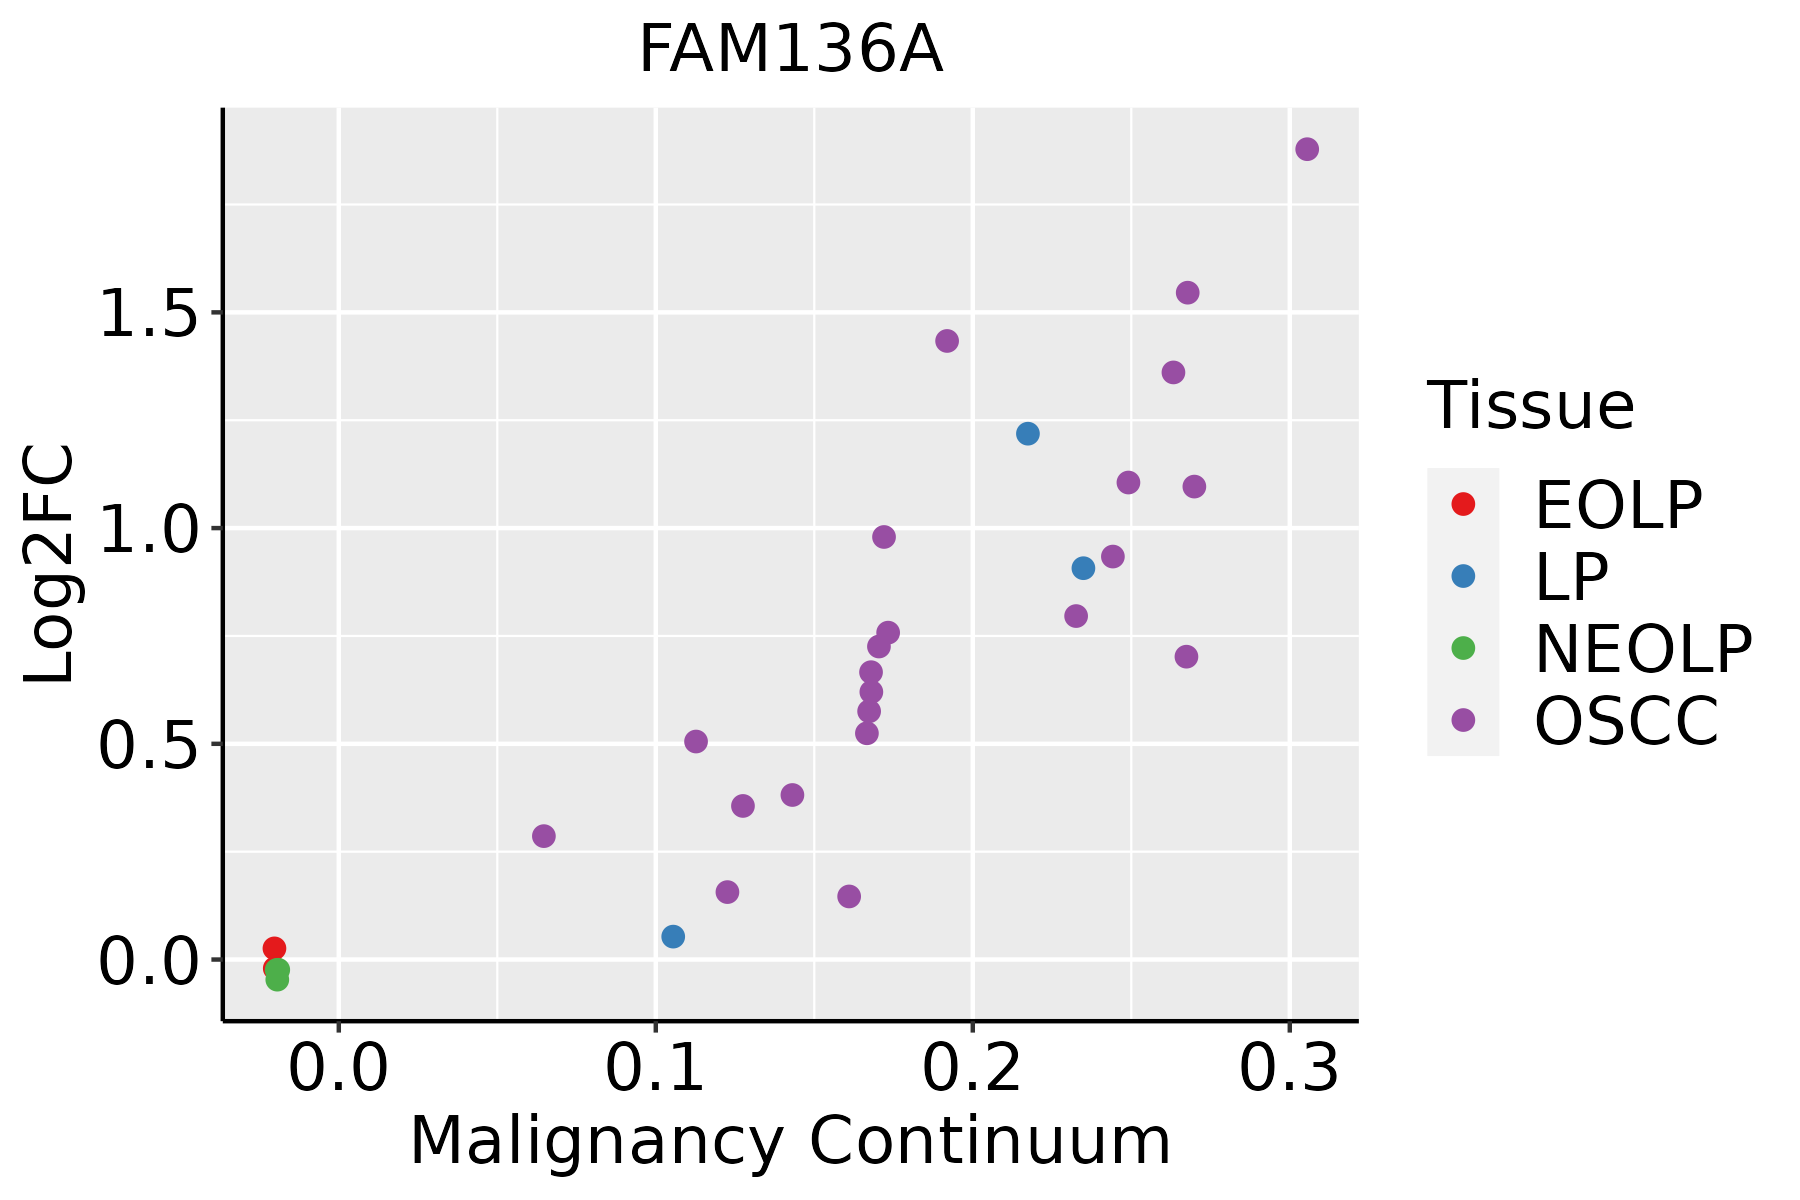 | EOLP: Erosive Oral lichen planus |
| LP: leukoplakia | ||
| NEOLP: Non-erosive oral lichen planus | ||
| OSCC: Oral squamous cell carcinoma | ||
| Prostate | 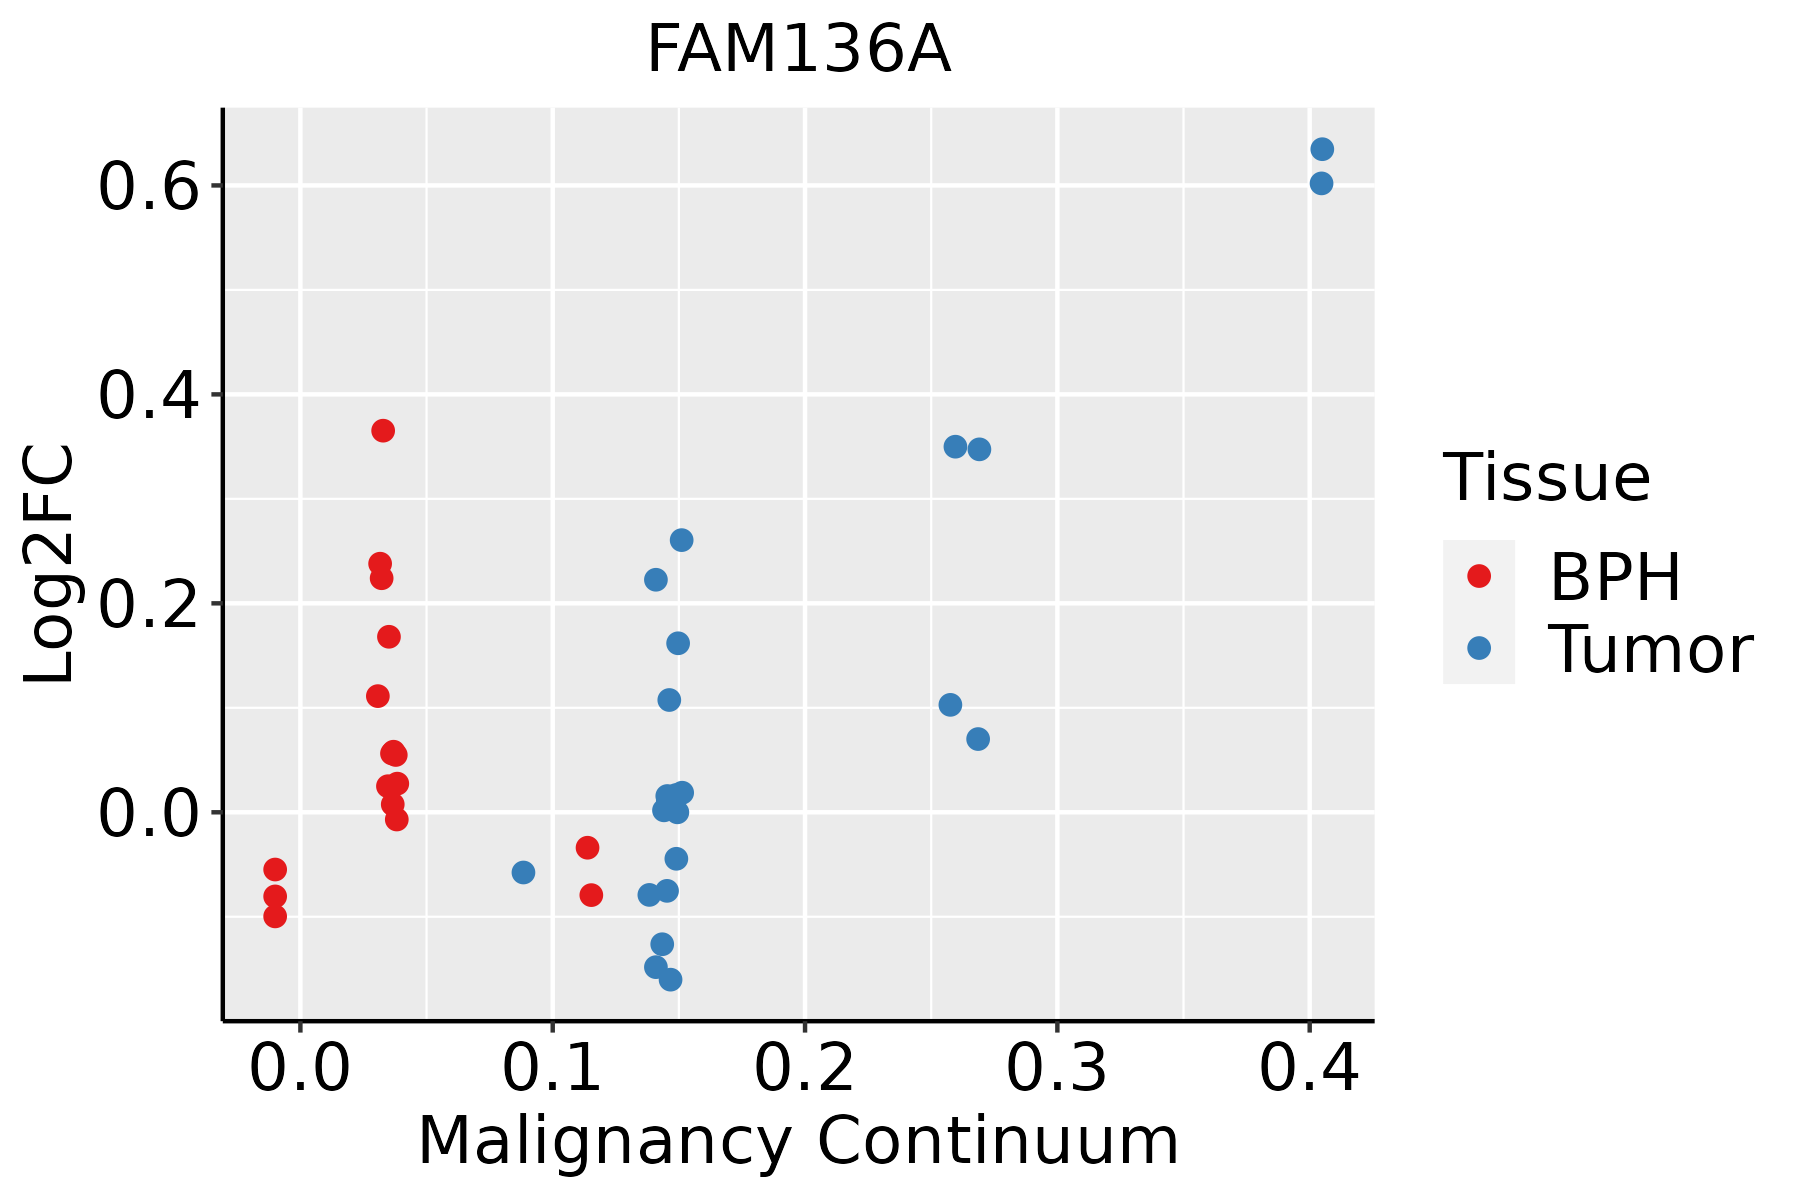 | BPH: Benign Prostatic Hyperplasia |
| Skin | 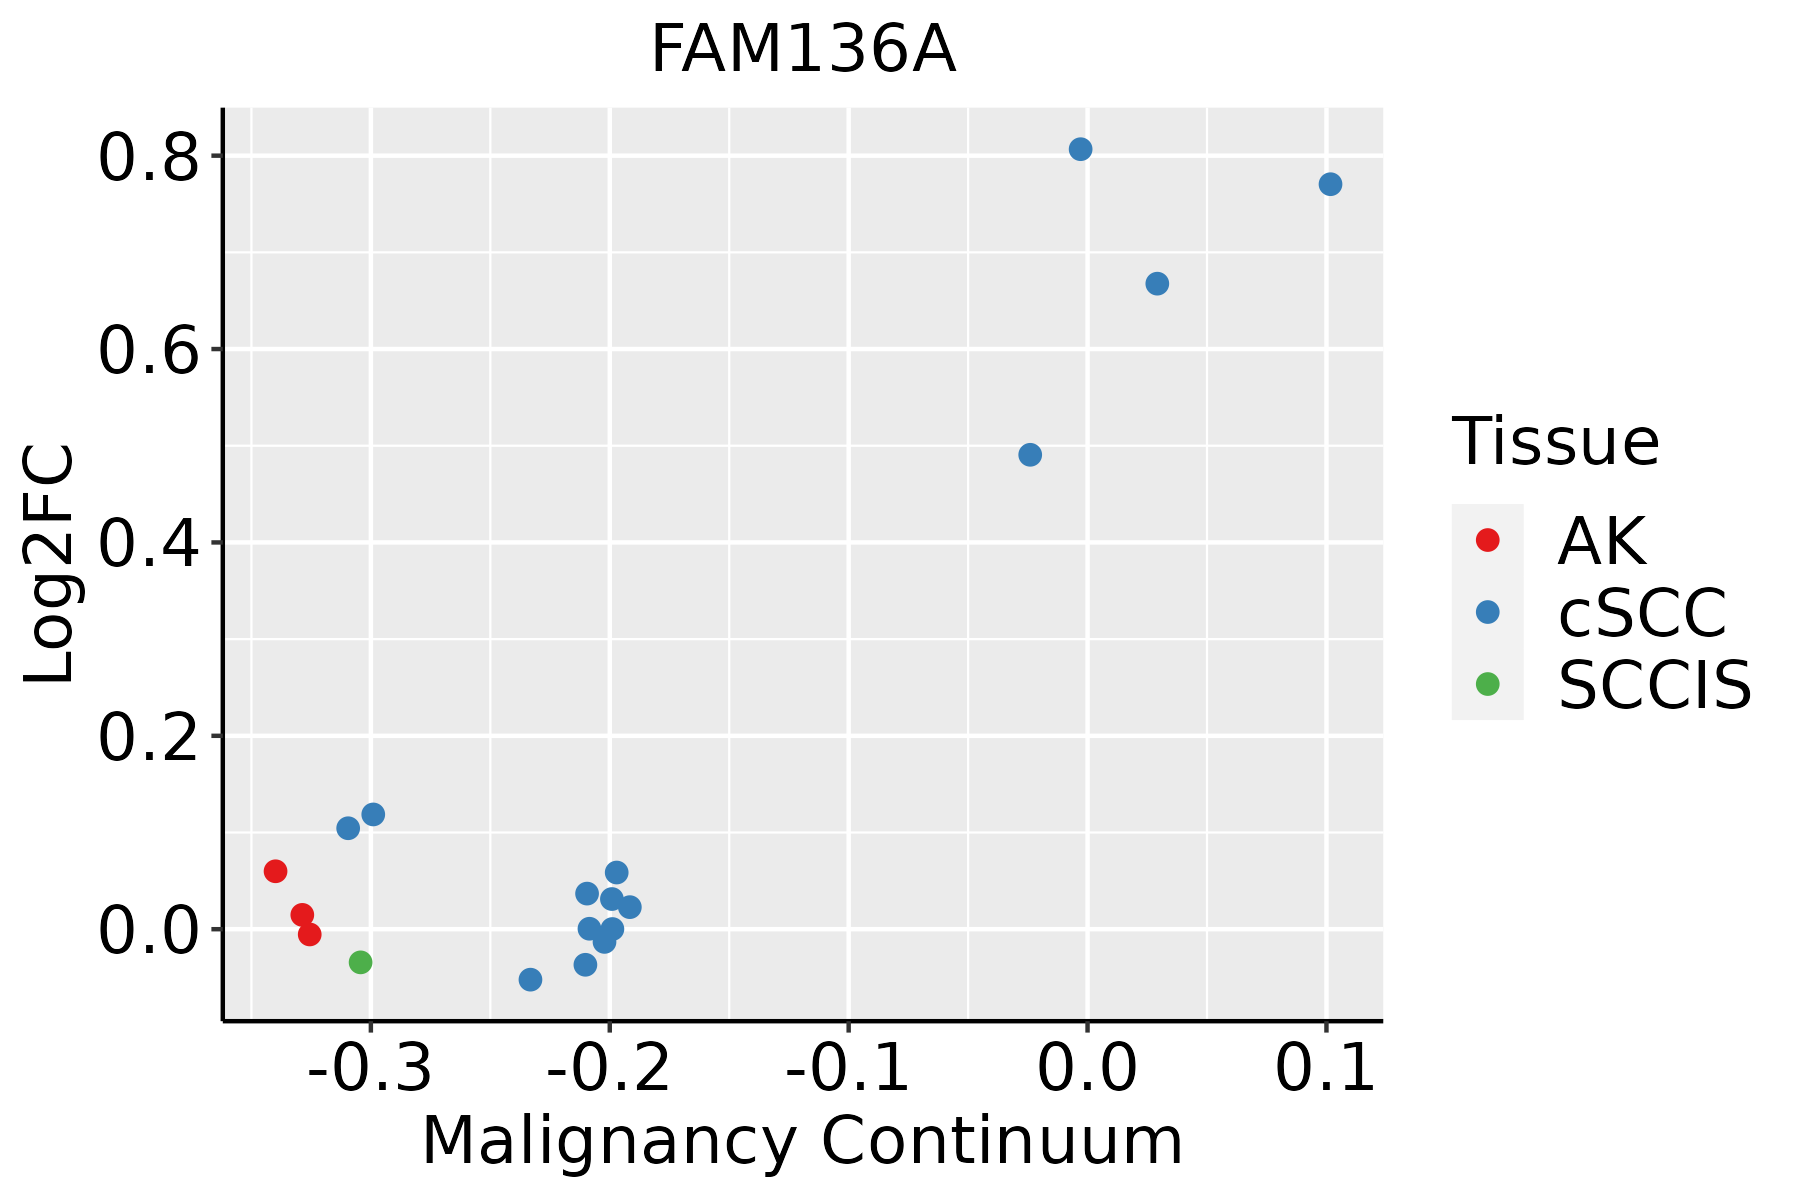 | AK: Actinic keratosis |
| cSCC: Cutaneous squamous cell carcinoma | ||
| SCCIS:squamous cell carcinoma in situ | ||
| Thyroid | 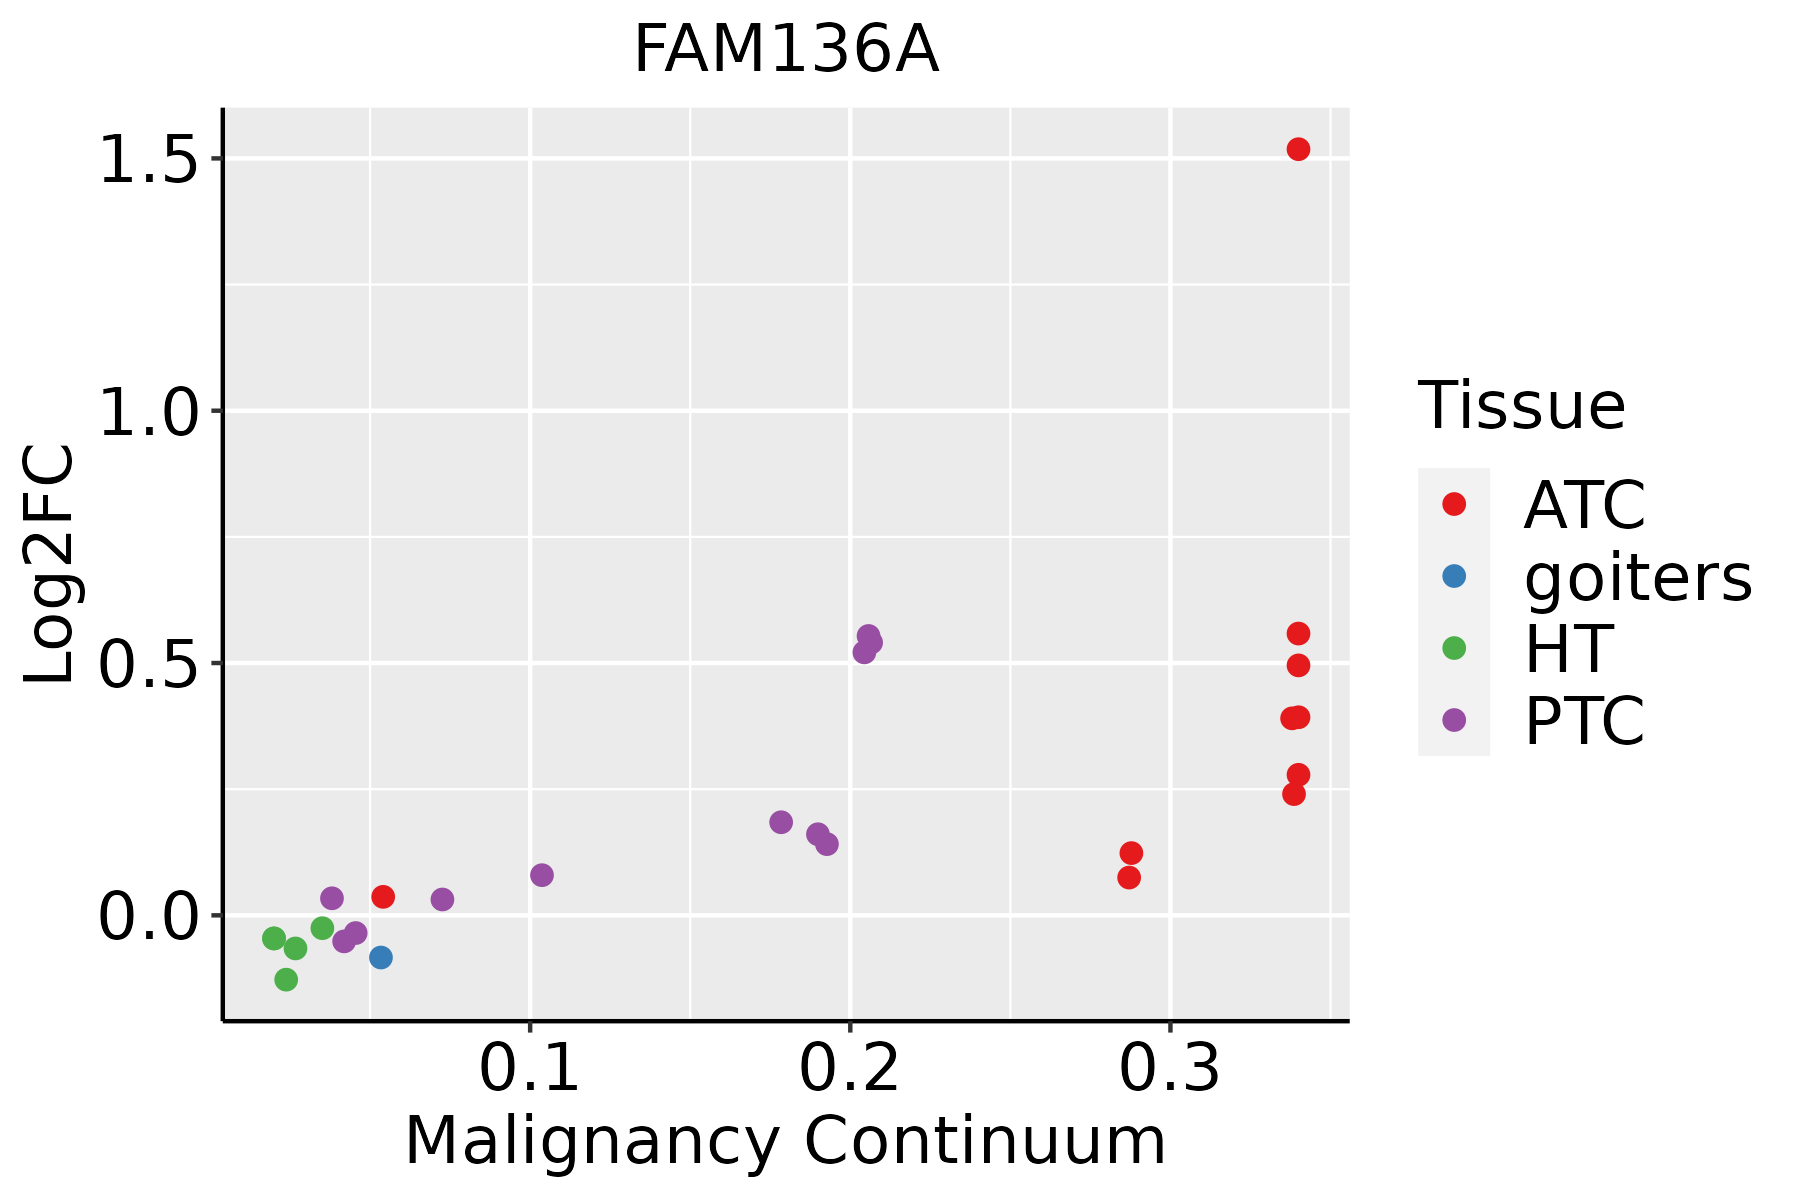 | ATC: Anaplastic thyroid cancer |
| HT: Hashimoto's thyroiditis | ||
| PTC: Papillary thyroid cancer |
| ∗log2FC in expression of this searched gene in stem-like cells from each diseased tissue sample relative to stem-like cells in normal samples in each tissue plotted against the malignancy continuum. Samples are colored based on if they are from different disease stage. |
Top |
Malignant transformation related pathway analysis |
| Find out the enriched GO biological processes and KEGG pathways involved in transition from healthy to precancer to cancer |
| Tissue | Disease Stage | Enriched GO biological Processes |
| Colorectum | AD |  |
| Colorectum | SER |  |
| Colorectum | MSS |  |
| Colorectum | MSI-H |  |
| Colorectum | FAP |  |
| ∗Top 15 enriched GO BP terms are showed in the bar plot of each disease state in each tissue. Each row represents a significant GO biological process which is colored according to the -log10(p.adjust). |
| Page: 1 2 3 4 5 6 7 8 9 |
| GO ID | Tissue | Disease Stage | Description | Gene Ratio | Bg Ratio | pvalue | p.adjust | Count |
| Page: 1 |
| Pathway ID | Tissue | Disease Stage | Description | Gene Ratio | Bg Ratio | pvalue | p.adjust | qvalue | Count |
| Page: 1 |
Top |
Cell-cell communication analysis |
| Identification of potential cell-cell interactions between two cell types and their ligand-receptor pairs for different disease states |
| Ligand | Receptor | LRpair | Pathway | Tissue | Disease Stage |
| Page: 1 |
Top |
Single-cell gene regulatory network inference analysis |
| Find out the significant the regulons (TFs) and the target genes of each regulon across cell types for different disease states |
| TF | Cell Type | Tissue | Disease Stage | Target Gene | RSS | Regulon Activity |
| ∗The dot plots of a searched regulon are shown for all cell subpopulations in each disease state of each tissue based on the regulon specific score inferred using pySCENIC and by calculating the average expression. |
| Page: 1 |
Top |
Somatic mutation of malignant transformation related genes |
| Annotation of somatic variants for genes involved in malignant transformation |
| Hugo Symbol | Variant Class | Variant Classification | dbSNP RS | HGVSc | HGVSp | HGVSp Short | SWISSPROT | BIOTYPE | SIFT | PolyPhen | Tumor Sample Barcode | Tissue | Histology | Sex | Age | Stage | Therapy Types | Drugs | Outcome |
| FAM136A | SNV | Missense_Mutation | novel | c.224N>C | p.Phe75Ser | p.F75S | Q96C01 | protein_coding | deleterious(0.03) | probably_damaging(1) | TCGA-AZ-4315-01 | Colorectum | colon adenocarcinoma | Male | <65 | I/II | Unknown | Unknown | SD |
| FAM136A | SNV | Missense_Mutation | rs745624131 | c.100C>T | p.Arg34Trp | p.R34W | Q96C01 | protein_coding | tolerated(0.14) | benign(0.025) | TCGA-D5-6530-01 | Colorectum | colon adenocarcinoma | Male | <65 | I/II | Unknown | Unknown | SD |
| FAM136A | SNV | Missense_Mutation | rs748392606 | c.109N>A | p.Ala37Thr | p.A37T | Q96C01 | protein_coding | tolerated(0.1) | possibly_damaging(0.503) | TCGA-D5-6930-01 | Colorectum | colon adenocarcinoma | Male | >=65 | I/II | Unknown | Unknown | SD |
| FAM136A | SNV | Missense_Mutation | rs776604234 | c.277N>G | p.Ser93Ala | p.S93A | Q96C01 | protein_coding | tolerated(0.39) | benign(0.009) | TCGA-AP-A1DV-01 | Endometrium | uterine corpus endometrioid carcinoma | Female | <65 | I/II | Unknown | Unknown | SD |
| FAM136A | SNV | Missense_Mutation | rs148038860 | c.287C>A | p.Ala96Asp | p.A96D | Q96C01 | protein_coding | tolerated(0.08) | possibly_damaging(0.614) | TCGA-DF-A2KU-01 | Endometrium | uterine corpus endometrioid carcinoma | Female | Unknown | I/II | Unknown | Unknown | SD |
| FAM136A | SNV | Missense_Mutation | novel | c.197C>A | p.Ala66Asp | p.A66D | Q96C01 | protein_coding | tolerated(0.14) | possibly_damaging(0.795) | TCGA-DF-A2KU-01 | Endometrium | uterine corpus endometrioid carcinoma | Female | Unknown | I/II | Unknown | Unknown | SD |
| FAM136A | SNV | Missense_Mutation | rs758510087 | c.163N>C | p.Glu55Gln | p.E55Q | Q96C01 | protein_coding | tolerated(0.11) | possibly_damaging(0.576) | TCGA-05-4389-01 | Lung | lung adenocarcinoma | Male | >=65 | I/II | Unknown | Unknown | SD |
| FAM136A | SNV | Missense_Mutation | c.259N>T | p.Asn87Tyr | p.N87Y | Q96C01 | protein_coding | deleterious(0) | probably_damaging(0.954) | TCGA-69-7765-01 | Lung | lung adenocarcinoma | Male | <65 | III/IV | Chemotherapy | carboplatin | SD | |
| FAM136A | SNV | Missense_Mutation | novel | c.184G>A | p.Ala62Thr | p.A62T | Q96C01 | protein_coding | tolerated(0.34) | benign(0.119) | TCGA-77-8133-01 | Lung | lung squamous cell carcinoma | Male | >=65 | I/II | Unknown | Unknown | SD |
| FAM136A | SNV | Missense_Mutation | novel | c.209N>A | p.Ser70Asn | p.S70N | Q96C01 | protein_coding | tolerated(0.49) | benign(0.009) | TCGA-CR-7398-01 | Oral cavity | head & neck squamous cell carcinoma | Female | <65 | I/II | Unknown | Unknown | SD |
| Page: 1 2 |
Top |
Related drugs of malignant transformation related genes |
| Identification of chemicals and drugs interact with genes involved in malignant transfromation |
| (DGIdb 4.0) |
| Entrez ID | Symbol | Category | Interaction Types | Drug Claim Name | Drug Name | PMIDs |
| Page: 1 |

Copyright 2023-Present -The University of Texas Health Science Center at Houston |