
|
|||||
|
 | |
| |
| |
| |
| |
| |
|
Gene: FAM134B |
Gene summary for FAM134B |
| Gene information | Species | Human | Gene symbol | FAM134B | Gene ID | 54463 |
| Gene name | reticulophagy regulator 1 | |
| Gene Alias | FAM134B | |
| Cytomap | 5p15.1 | |
| Gene Type | protein-coding | GO ID | GO:0000422 | UniProtAcc | Q9H6L5 |
Top |
Malignant transformation analysis |
| Identification of the aberrant gene expression in precancerous and cancerous lesions by comparing the gene expression of stem-like cells in diseased tissues with normal stem cells |
| Entrez ID | Symbol | Replicates | Species | Organ | Tissue | Adj P-value | Log2FC | Malignancy |
| 54463 | FAM134B | HTA11_99999970781_79442 | Human | Colorectum | MSS | 1.49e-43 | 6.96e-01 | 0.294 |
| 54463 | FAM134B | HTA11_99999965062_69753 | Human | Colorectum | MSI-H | 7.89e-03 | 3.79e-01 | 0.3487 |
| 54463 | FAM134B | HTA11_99999965104_69814 | Human | Colorectum | MSS | 1.85e-32 | 9.08e-01 | 0.281 |
| 54463 | FAM134B | HTA11_99999971662_82457 | Human | Colorectum | MSS | 3.17e-28 | 5.45e-01 | 0.3859 |
| 54463 | FAM134B | HTA11_99999973899_84307 | Human | Colorectum | MSS | 3.35e-11 | 4.23e-01 | 0.2585 |
| 54463 | FAM134B | HTA11_99999974143_84620 | Human | Colorectum | MSS | 9.32e-10 | 2.13e-01 | 0.3005 |
| 54463 | FAM134B | P2T-E | Human | Esophagus | ESCC | 1.96e-05 | 1.32e-01 | 0.1177 |
| 54463 | FAM134B | P4T-E | Human | Esophagus | ESCC | 6.76e-15 | 4.63e-01 | 0.1323 |
| 54463 | FAM134B | P5T-E | Human | Esophagus | ESCC | 1.51e-09 | 1.53e-01 | 0.1327 |
| 54463 | FAM134B | P8T-E | Human | Esophagus | ESCC | 3.21e-06 | 8.27e-02 | 0.0889 |
| 54463 | FAM134B | P10T-E | Human | Esophagus | ESCC | 6.35e-10 | 2.53e-01 | 0.116 |
| 54463 | FAM134B | P11T-E | Human | Esophagus | ESCC | 5.08e-05 | 3.36e-01 | 0.1426 |
| 54463 | FAM134B | P12T-E | Human | Esophagus | ESCC | 1.05e-17 | 3.72e-01 | 0.1122 |
| 54463 | FAM134B | P22T-E | Human | Esophagus | ESCC | 1.08e-06 | 4.92e-02 | 0.1236 |
| 54463 | FAM134B | P26T-E | Human | Esophagus | ESCC | 1.26e-13 | 2.36e-01 | 0.1276 |
| 54463 | FAM134B | P28T-E | Human | Esophagus | ESCC | 5.05e-13 | 1.87e-01 | 0.1149 |
| 54463 | FAM134B | P32T-E | Human | Esophagus | ESCC | 1.35e-11 | 1.15e-01 | 0.1666 |
| 54463 | FAM134B | P37T-E | Human | Esophagus | ESCC | 2.22e-05 | 2.65e-02 | 0.1371 |
| 54463 | FAM134B | P39T-E | Human | Esophagus | ESCC | 2.17e-02 | 6.48e-03 | 0.0894 |
| 54463 | FAM134B | P40T-E | Human | Esophagus | ESCC | 3.81e-02 | 1.47e-01 | 0.109 |
| Page: 1 2 3 |
| Tissue | Expression Dynamics | Abbreviation |
| Colorectum (GSE201348) |  | FAP: Familial adenomatous polyposis |
| CRC: Colorectal cancer | ||
| Colorectum (HTA11) |  | AD: Adenomas |
| SER: Sessile serrated lesions | ||
| MSI-H: Microsatellite-high colorectal cancer | ||
| MSS: Microsatellite stable colorectal cancer | ||
| Esophagus | 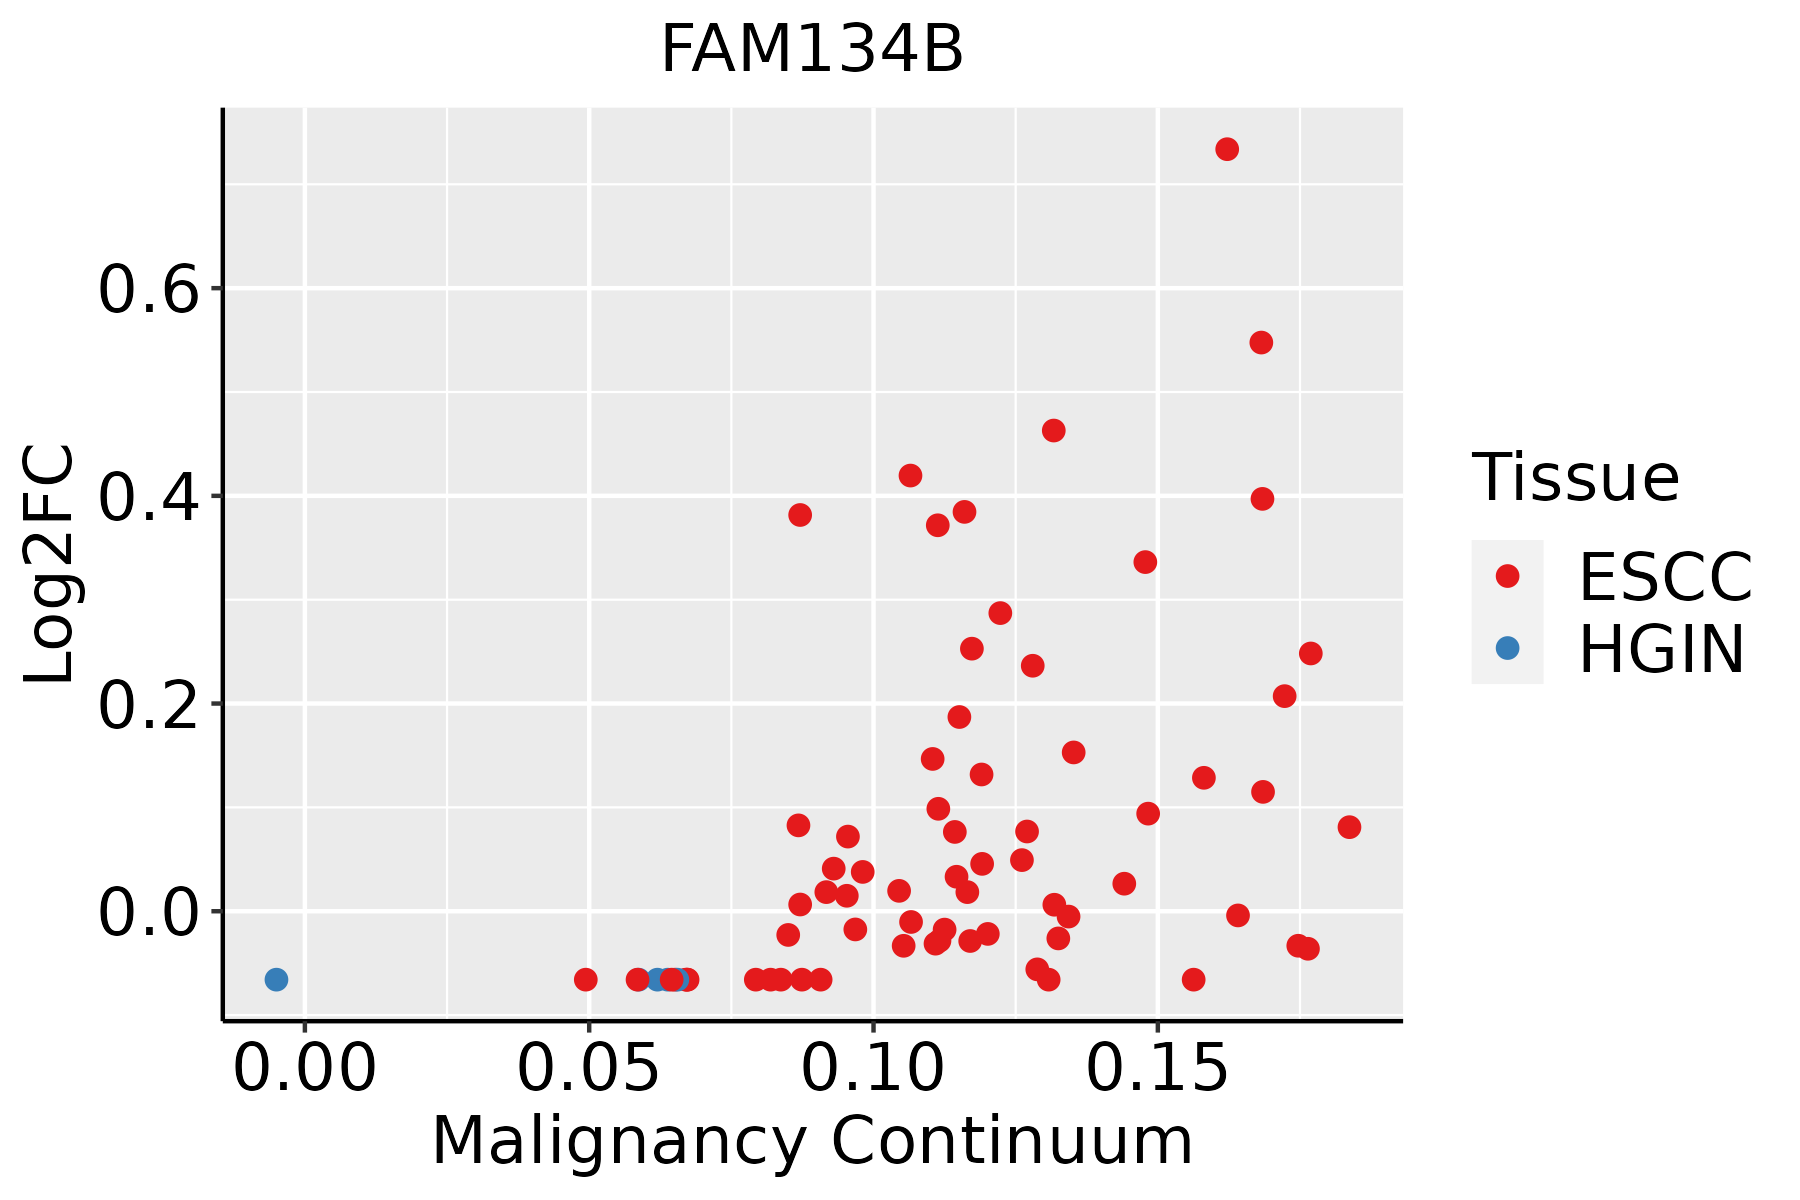 | ESCC: Esophageal squamous cell carcinoma |
| HGIN: High-grade intraepithelial neoplasias | ||
| LGIN: Low-grade intraepithelial neoplasias | ||
| Prostate |  | BPH: Benign Prostatic Hyperplasia |
| ∗log2FC in expression of this searched gene in stem-like cells from each diseased tissue sample relative to stem-like cells in normal samples in each tissue plotted against the malignancy continuum. Samples are colored based on if they are from different disease stage. |
Top |
Malignant transformation related pathway analysis |
| Find out the enriched GO biological processes and KEGG pathways involved in transition from healthy to precancer to cancer |
| Tissue | Disease Stage | Enriched GO biological Processes |
| Colorectum | AD |  |
| Colorectum | SER |  |
| Colorectum | MSS |  |
| Colorectum | MSI-H |  |
| Colorectum | FAP |  |
| ∗Top 15 enriched GO BP terms are showed in the bar plot of each disease state in each tissue. Each row represents a significant GO biological process which is colored according to the -log10(p.adjust). |
| Page: 1 2 3 4 5 6 7 8 9 |
| GO ID | Tissue | Disease Stage | Description | Gene Ratio | Bg Ratio | pvalue | p.adjust | Count |
| Page: 1 |
| Pathway ID | Tissue | Disease Stage | Description | Gene Ratio | Bg Ratio | pvalue | p.adjust | qvalue | Count |
| Page: 1 |
Top |
Cell-cell communication analysis |
| Identification of potential cell-cell interactions between two cell types and their ligand-receptor pairs for different disease states |
| Ligand | Receptor | LRpair | Pathway | Tissue | Disease Stage |
| Page: 1 |
Top |
Single-cell gene regulatory network inference analysis |
| Find out the significant the regulons (TFs) and the target genes of each regulon across cell types for different disease states |
| TF | Cell Type | Tissue | Disease Stage | Target Gene | RSS | Regulon Activity |
| ∗The dot plots of a searched regulon are shown for all cell subpopulations in each disease state of each tissue based on the regulon specific score inferred using pySCENIC and by calculating the average expression. |
| Page: 1 |
Top |
Somatic mutation of malignant transformation related genes |
| Annotation of somatic variants for genes involved in malignant transformation |
| Hugo Symbol | Variant Class | Variant Classification | dbSNP RS | HGVSc | HGVSp | HGVSp Short | SWISSPROT | BIOTYPE | SIFT | PolyPhen | Tumor Sample Barcode | Tissue | Histology | Sex | Age | Stage | Therapy Types | Drugs | Outcome |
| FAM134B | SNV | Missense_Mutation | novel | c.1023N>C | p.Glu341Asp | p.E341D | Q9H6L5 | protein_coding | deleterious(0.03) | benign(0.017) | TCGA-AN-A046-01 | Breast | breast invasive carcinoma | Female | >=65 | I/II | Unknown | Unknown | SD |
| FAM134B | SNV | Missense_Mutation | c.592N>G | p.Leu198Val | p.L198V | Q9H6L5 | protein_coding | deleterious(0) | probably_damaging(0.998) | TCGA-AN-A0XN-01 | Breast | breast invasive carcinoma | Female | >=65 | III/IV | Unknown | Unknown | SD | |
| FAM134B | SNV | Missense_Mutation | c.656N>C | p.Leu219Pro | p.L219P | Q9H6L5 | protein_coding | deleterious(0) | probably_damaging(1) | TCGA-AO-A128-01 | Breast | breast invasive carcinoma | Female | <65 | I/II | Chemotherapy | doxorubicin | SD | |
| FAM134B | SNV | Missense_Mutation | c.709N>A | p.Asp237Asn | p.D237N | Q9H6L5 | protein_coding | tolerated(0.13) | possibly_damaging(0.596) | TCGA-C8-A27A-01 | Breast | breast invasive carcinoma | Female | <65 | I/II | Chemotherapy | 5-fluorouracil | CR | |
| FAM134B | SNV | Missense_Mutation | c.979N>T | p.Pro327Ser | p.P327S | Q9H6L5 | protein_coding | deleterious(0) | probably_damaging(0.946) | TCGA-A6-3809-01 | Colorectum | colon adenocarcinoma | Female | >=65 | I/II | Unknown | Unknown | SD | |
| FAM134B | SNV | Missense_Mutation | c.964T>C | p.Ser322Pro | p.S322P | Q9H6L5 | protein_coding | deleterious(0) | probably_damaging(0.994) | TCGA-AA-3977-01 | Colorectum | colon adenocarcinoma | Male | >=65 | I/II | Unknown | Unknown | SD | |
| FAM134B | SNV | Missense_Mutation | novel | c.562N>G | p.Phe188Val | p.F188V | Q9H6L5 | protein_coding | deleterious(0) | probably_damaging(0.998) | TCGA-AA-3984-01 | Colorectum | colon adenocarcinoma | Female | <65 | I/II | Unknown | Unknown | SD |
| FAM134B | SNV | Missense_Mutation | rs749712805 | c.364G>A | p.Val122Ile | p.V122I | Q9H6L5 | protein_coding | tolerated(0.52) | benign(0.011) | TCGA-AA-A01R-01 | Colorectum | colon adenocarcinoma | Male | <65 | III/IV | Chemotherapy | 5-fluorouracil | PD |
| FAM134B | SNV | Missense_Mutation | c.1031C>T | p.Ser344Phe | p.S344F | Q9H6L5 | protein_coding | deleterious(0.04) | possibly_damaging(0.467) | TCGA-AD-A5EK-01 | Colorectum | colon adenocarcinoma | Male | <65 | I/II | Unknown | Unknown | SD | |
| FAM134B | SNV | Missense_Mutation | c.1463N>C | p.Gly488Ala | p.G488A | Q9H6L5 | protein_coding | deleterious(0.01) | probably_damaging(0.997) | TCGA-AG-3726-01 | Colorectum | rectum adenocarcinoma | Female | <65 | I/II | Unknown | Unknown | SD |
| Page: 1 2 3 4 |
Top |
Related drugs of malignant transformation related genes |
| Identification of chemicals and drugs interact with genes involved in malignant transfromation |
| (DGIdb 4.0) |
| Entrez ID | Symbol | Category | Interaction Types | Drug Claim Name | Drug Name | PMIDs |
| Page: 1 |

Copyright 2023-Present -The University of Texas Health Science Center at Houston |