
|
|||||
|
 | |
| |
| |
| |
| |
| |
|
Gene: FAM131A |
Gene summary for FAM131A |
| Gene information | Species | Human | Gene symbol | FAM131A | Gene ID | 131408 |
| Gene name | family with sequence similarity 131 member A | |
| Gene Alias | C3orf40 | |
| Cytomap | 3q27.1 | |
| Gene Type | protein-coding | GO ID | NA | UniProtAcc | Q6UXB0 |
Top |
Malignant transformation analysis |
| Identification of the aberrant gene expression in precancerous and cancerous lesions by comparing the gene expression of stem-like cells in diseased tissues with normal stem cells |
| Entrez ID | Symbol | Replicates | Species | Organ | Tissue | Adj P-value | Log2FC | Malignancy |
| 131408 | FAM131A | LZE4T | Human | Esophagus | ESCC | 5.14e-04 | 1.03e-01 | 0.0811 |
| 131408 | FAM131A | LZE21D1 | Human | Esophagus | HGIN | 6.53e-03 | 1.90e-01 | 0.0632 |
| 131408 | FAM131A | LZE24T | Human | Esophagus | ESCC | 2.18e-10 | 2.21e-01 | 0.0596 |
| 131408 | FAM131A | LZE21T | Human | Esophagus | ESCC | 3.58e-02 | 1.92e-01 | 0.0655 |
| 131408 | FAM131A | LZE6T | Human | Esophagus | ESCC | 6.13e-04 | 1.50e-01 | 0.0845 |
| 131408 | FAM131A | P1T-E | Human | Esophagus | ESCC | 6.83e-03 | 1.46e-01 | 0.0875 |
| 131408 | FAM131A | P2T-E | Human | Esophagus | ESCC | 4.78e-35 | 5.79e-01 | 0.1177 |
| 131408 | FAM131A | P4T-E | Human | Esophagus | ESCC | 4.75e-21 | 4.21e-01 | 0.1323 |
| 131408 | FAM131A | P5T-E | Human | Esophagus | ESCC | 7.90e-04 | 3.16e-02 | 0.1327 |
| 131408 | FAM131A | P8T-E | Human | Esophagus | ESCC | 8.37e-09 | 8.13e-02 | 0.0889 |
| 131408 | FAM131A | P9T-E | Human | Esophagus | ESCC | 9.76e-09 | 1.51e-01 | 0.1131 |
| 131408 | FAM131A | P10T-E | Human | Esophagus | ESCC | 3.54e-20 | 3.14e-01 | 0.116 |
| 131408 | FAM131A | P11T-E | Human | Esophagus | ESCC | 1.57e-05 | 2.70e-01 | 0.1426 |
| 131408 | FAM131A | P12T-E | Human | Esophagus | ESCC | 2.28e-16 | 2.80e-01 | 0.1122 |
| 131408 | FAM131A | P15T-E | Human | Esophagus | ESCC | 2.30e-27 | 4.88e-01 | 0.1149 |
| 131408 | FAM131A | P16T-E | Human | Esophagus | ESCC | 1.50e-21 | 2.94e-01 | 0.1153 |
| 131408 | FAM131A | P17T-E | Human | Esophagus | ESCC | 2.03e-02 | 1.19e-01 | 0.1278 |
| 131408 | FAM131A | P19T-E | Human | Esophagus | ESCC | 5.98e-03 | 1.79e-01 | 0.1662 |
| 131408 | FAM131A | P20T-E | Human | Esophagus | ESCC | 1.97e-07 | 1.14e-01 | 0.1124 |
| 131408 | FAM131A | P21T-E | Human | Esophagus | ESCC | 2.60e-14 | 1.10e-01 | 0.1617 |
| Page: 1 2 3 |
| Tissue | Expression Dynamics | Abbreviation |
| Esophagus | 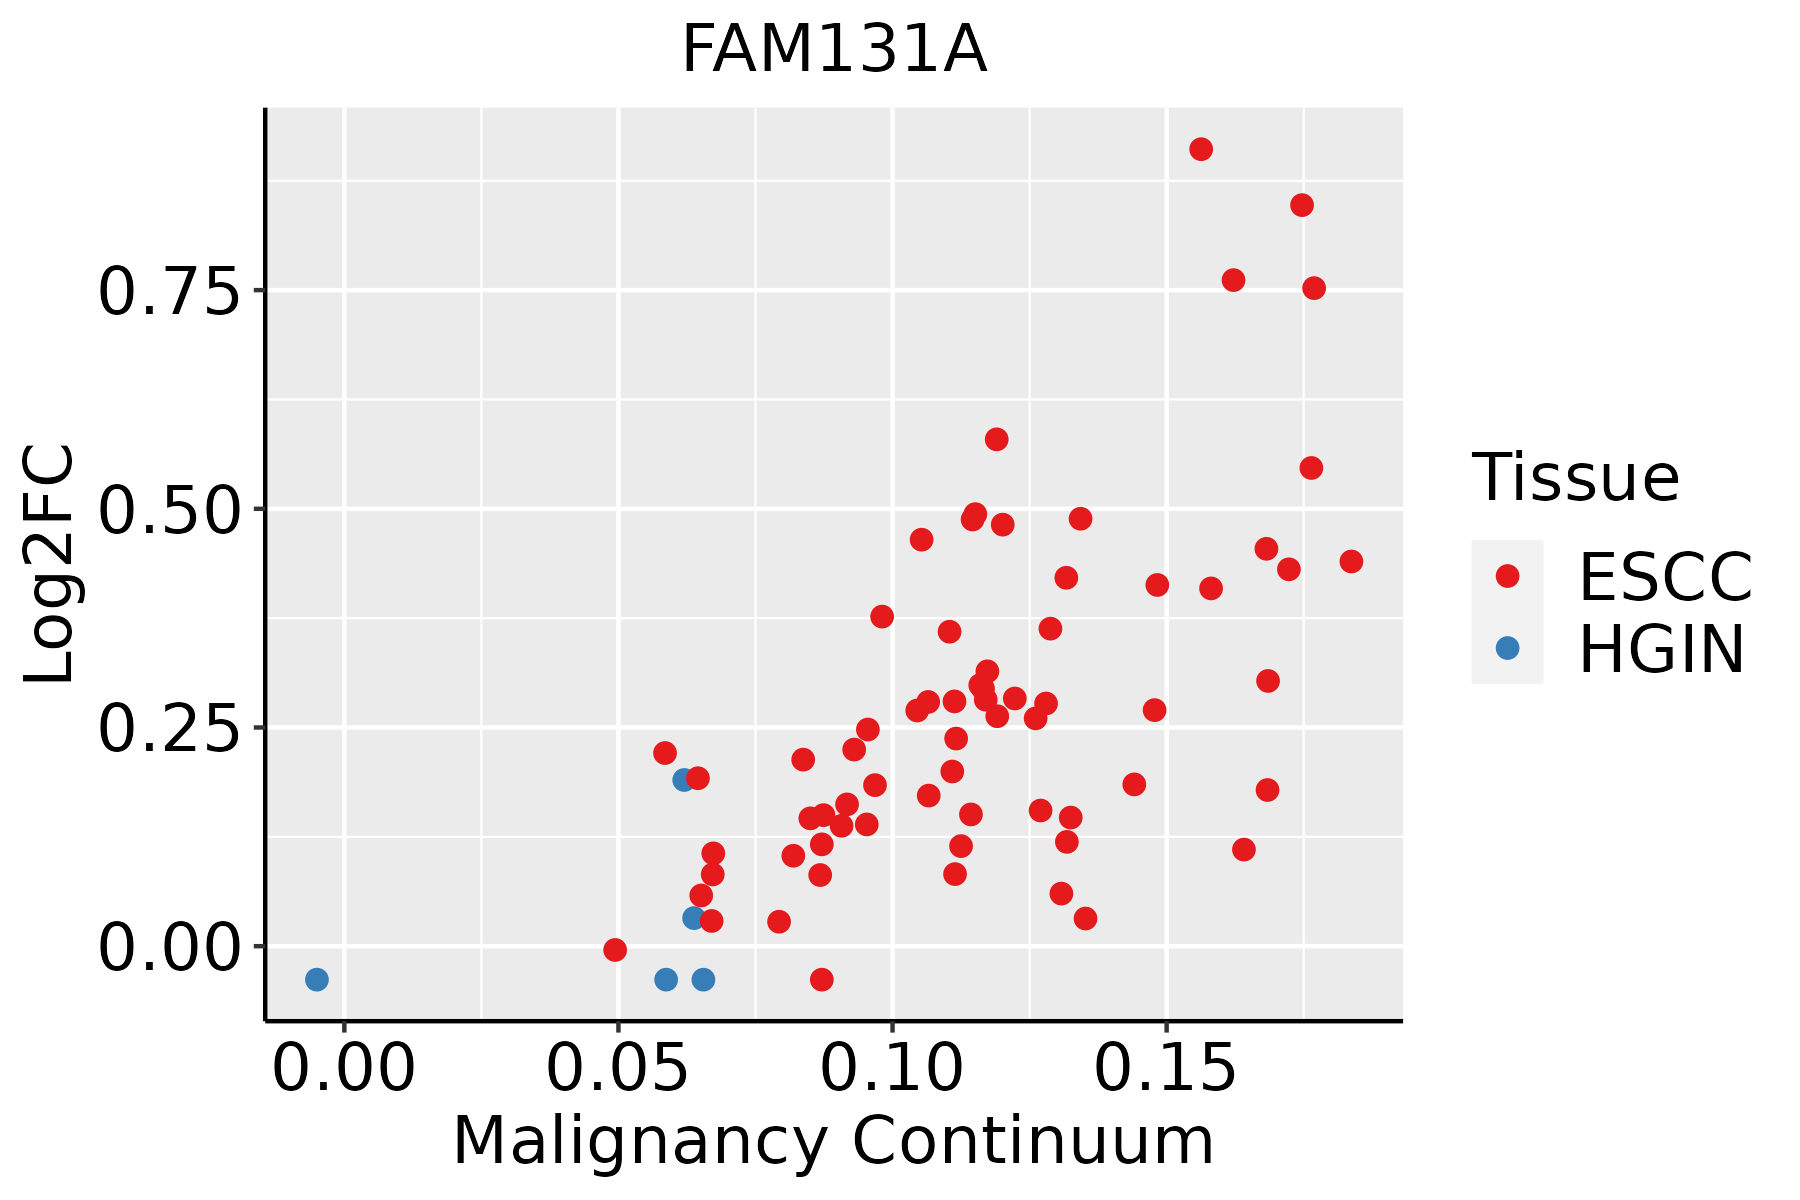 | ESCC: Esophageal squamous cell carcinoma |
| HGIN: High-grade intraepithelial neoplasias | ||
| LGIN: Low-grade intraepithelial neoplasias |
| ∗log2FC in expression of this searched gene in stem-like cells from each diseased tissue sample relative to stem-like cells in normal samples in each tissue plotted against the malignancy continuum. Samples are colored based on if they are from different disease stage. |
Top |
Malignant transformation related pathway analysis |
| Find out the enriched GO biological processes and KEGG pathways involved in transition from healthy to precancer to cancer |
| Tissue | Disease Stage | Enriched GO biological Processes |
| Colorectum | AD |  |
| Colorectum | SER |  |
| Colorectum | MSS |  |
| Colorectum | MSI-H |  |
| Colorectum | FAP |  |
| ∗Top 15 enriched GO BP terms are showed in the bar plot of each disease state in each tissue. Each row represents a significant GO biological process which is colored according to the -log10(p.adjust). |
| Page: 1 2 3 4 5 6 7 8 9 |
| GO ID | Tissue | Disease Stage | Description | Gene Ratio | Bg Ratio | pvalue | p.adjust | Count |
| Page: 1 |
| Pathway ID | Tissue | Disease Stage | Description | Gene Ratio | Bg Ratio | pvalue | p.adjust | qvalue | Count |
| Page: 1 |
Top |
Cell-cell communication analysis |
| Identification of potential cell-cell interactions between two cell types and their ligand-receptor pairs for different disease states |
| Ligand | Receptor | LRpair | Pathway | Tissue | Disease Stage |
| Page: 1 |
Top |
Single-cell gene regulatory network inference analysis |
| Find out the significant the regulons (TFs) and the target genes of each regulon across cell types for different disease states |
| TF | Cell Type | Tissue | Disease Stage | Target Gene | RSS | Regulon Activity |
| ∗The dot plots of a searched regulon are shown for all cell subpopulations in each disease state of each tissue based on the regulon specific score inferred using pySCENIC and by calculating the average expression. |
| Page: 1 |
Top |
Somatic mutation of malignant transformation related genes |
| Annotation of somatic variants for genes involved in malignant transformation |
| Hugo Symbol | Variant Class | Variant Classification | dbSNP RS | HGVSc | HGVSp | HGVSp Short | SWISSPROT | BIOTYPE | SIFT | PolyPhen | Tumor Sample Barcode | Tissue | Histology | Sex | Age | Stage | Therapy Types | Drugs | Outcome |
| FAM131A | SNV | Missense_Mutation | c.26A>G | p.Lys9Arg | p.K9R | Q6UXB0 | protein_coding | deleterious_low_confidence(0) | benign(0.042) | TCGA-C8-A131-01 | Breast | breast invasive carcinoma | Female | >=65 | III/IV | Chemotherapy | 5-fluorouracil | CR | |
| FAM131A | SNV | Missense_Mutation | novel | c.401N>G | p.Glu134Gly | p.E134G | Q6UXB0 | protein_coding | deleterious(0) | probably_damaging(0.998) | TCGA-D8-A1XK-01 | Breast | breast invasive carcinoma | Female | <65 | I/II | Chemotherapy | doxorubicine+cyclophosphamide | SD |
| FAM131A | SNV | Missense_Mutation | novel | c.77N>A | p.Thr26Lys | p.T26K | Q6UXB0 | protein_coding | deleterious_low_confidence(0.01) | benign(0.07) | TCGA-PL-A8LZ-01 | Breast | breast invasive carcinoma | Female | <65 | III/IV | Chemotherapy | paclitaxel | SD |
| FAM131A | insertion | In_Frame_Ins | novel | c.617_618insCTTCCTAGCTCCTGTCTCCTCCTCATGCCTTTGCTG | p.Met206delinsIlePheLeuAlaProValSerSerSerCysLeuCysTrp | p.M206delinsIFLAPVSSSCLCW | Q6UXB0 | protein_coding | TCGA-A8-A0A7-01 | Breast | breast invasive carcinoma | Female | <65 | I/II | Unknown | Unknown | SD | ||
| FAM131A | SNV | Missense_Mutation | c.382N>G | p.Arg128Gly | p.R128G | Q6UXB0 | protein_coding | deleterious(0) | probably_damaging(0.998) | TCGA-C5-A7UE-01 | Cervix | cervical & endocervical cancer | Female | <65 | I/II | Chemotherapy | cisplatin | SD | |
| FAM131A | SNV | Missense_Mutation | c.176N>A | p.Arg59Gln | p.R59Q | Q6UXB0 | protein_coding | tolerated(0.39) | possibly_damaging(0.82) | TCGA-UC-A7PF-01 | Cervix | cervical & endocervical cancer | Female | <65 | I/II | Unknown | Unknown | SD | |
| FAM131A | SNV | Missense_Mutation | c.242N>T | p.Gly81Val | p.G81V | Q6UXB0 | protein_coding | deleterious(0.02) | benign(0.356) | TCGA-AA-A01D-01 | Colorectum | colon adenocarcinoma | Female | <65 | III/IV | Chemotherapy | capecitabine | PD | |
| FAM131A | SNV | Missense_Mutation | c.383N>C | p.Arg128Pro | p.R128P | Q6UXB0 | protein_coding | deleterious(0) | probably_damaging(0.999) | TCGA-AA-A01D-01 | Colorectum | colon adenocarcinoma | Female | <65 | III/IV | Chemotherapy | capecitabine | PD | |
| FAM131A | SNV | Missense_Mutation | novel | c.622A>T | p.Thr208Ser | p.T208S | Q6UXB0 | protein_coding | tolerated(0.85) | benign(0) | TCGA-AA-A029-01 | Colorectum | colon adenocarcinoma | Male | >=65 | I/II | Unknown | Unknown | SD |
| FAM131A | SNV | Missense_Mutation | c.573N>T | p.Glu191Asp | p.E191D | Q6UXB0 | protein_coding | tolerated(0.53) | benign(0.007) | TCGA-AP-A051-01 | Endometrium | uterine corpus endometrioid carcinoma | Female | >=65 | I/II | Unknown | Unknown | SD |
| Page: 1 2 3 |
Top |
Related drugs of malignant transformation related genes |
| Identification of chemicals and drugs interact with genes involved in malignant transfromation |
| (DGIdb 4.0) |
| Entrez ID | Symbol | Category | Interaction Types | Drug Claim Name | Drug Name | PMIDs |
| Page: 1 |

Copyright 2023-Present -The University of Texas Health Science Center at Houston |