
|
|||||
|
 | |
| |
| |
| |
| |
| |
|
Gene: FAM129A |
Gene summary for FAM129A |
| Gene information | Species | Human | Gene symbol | FAM129A | Gene ID | 116496 |
| Gene name | niban apoptosis regulator 1 | |
| Gene Alias | C1orf24 | |
| Cytomap | 1q25.3 | |
| Gene Type | protein-coding | GO ID | GO:0001932 | UniProtAcc | A0A024R978 |
Top |
Malignant transformation analysis |
| Identification of the aberrant gene expression in precancerous and cancerous lesions by comparing the gene expression of stem-like cells in diseased tissues with normal stem cells |
| Entrez ID | Symbol | Replicates | Species | Organ | Tissue | Adj P-value | Log2FC | Malignancy |
| 116496 | FAM129A | GSM4909286 | Human | Breast | IDC | 3.80e-09 | -1.74e-01 | 0.1081 |
| 116496 | FAM129A | GSM4909296 | Human | Breast | IDC | 1.75e-09 | -1.65e-01 | 0.1524 |
| 116496 | FAM129A | GSM4909302 | Human | Breast | IDC | 4.81e-02 | -1.28e-01 | 0.1545 |
| 116496 | FAM129A | GSM4909307 | Human | Breast | IDC | 1.53e-02 | -1.26e-01 | 0.1569 |
| 116496 | FAM129A | GSM4909309 | Human | Breast | IDC | 1.67e-03 | -7.77e-02 | 0.0483 |
| 116496 | FAM129A | GSM4909311 | Human | Breast | IDC | 8.15e-08 | -1.63e-01 | 0.1534 |
| 116496 | FAM129A | GSM4909319 | Human | Breast | IDC | 8.23e-09 | -1.71e-01 | 0.1563 |
| 116496 | FAM129A | GSM4909321 | Human | Breast | IDC | 1.21e-06 | -1.55e-01 | 0.1559 |
| 116496 | FAM129A | M5 | Human | Breast | IDC | 1.20e-11 | 9.79e-01 | 0.1598 |
| 116496 | FAM129A | NCCBC14 | Human | Breast | DCIS | 1.41e-10 | 4.95e-01 | 0.2021 |
| 116496 | FAM129A | P1 | Human | Breast | IDC | 3.15e-04 | -1.04e-02 | 0.1527 |
| 116496 | FAM129A | DCIS2 | Human | Breast | DCIS | 1.98e-08 | -5.35e-02 | 0.0085 |
| 116496 | FAM129A | P1T-E | Human | Esophagus | ESCC | 2.01e-06 | 4.10e-01 | 0.0875 |
| 116496 | FAM129A | P2T-E | Human | Esophagus | ESCC | 1.79e-11 | 4.29e-01 | 0.1177 |
| 116496 | FAM129A | P4T-E | Human | Esophagus | ESCC | 6.50e-07 | 2.64e-01 | 0.1323 |
| 116496 | FAM129A | P5T-E | Human | Esophagus | ESCC | 2.15e-05 | 1.64e-01 | 0.1327 |
| 116496 | FAM129A | P8T-E | Human | Esophagus | ESCC | 1.77e-03 | 1.43e-01 | 0.0889 |
| 116496 | FAM129A | P9T-E | Human | Esophagus | ESCC | 1.44e-12 | 4.68e-01 | 0.1131 |
| 116496 | FAM129A | P11T-E | Human | Esophagus | ESCC | 3.30e-16 | 6.78e-01 | 0.1426 |
| 116496 | FAM129A | P15T-E | Human | Esophagus | ESCC | 1.03e-02 | 5.21e-02 | 0.1149 |
| Page: 1 2 3 4 5 |
| Tissue | Expression Dynamics | Abbreviation |
| Breast | 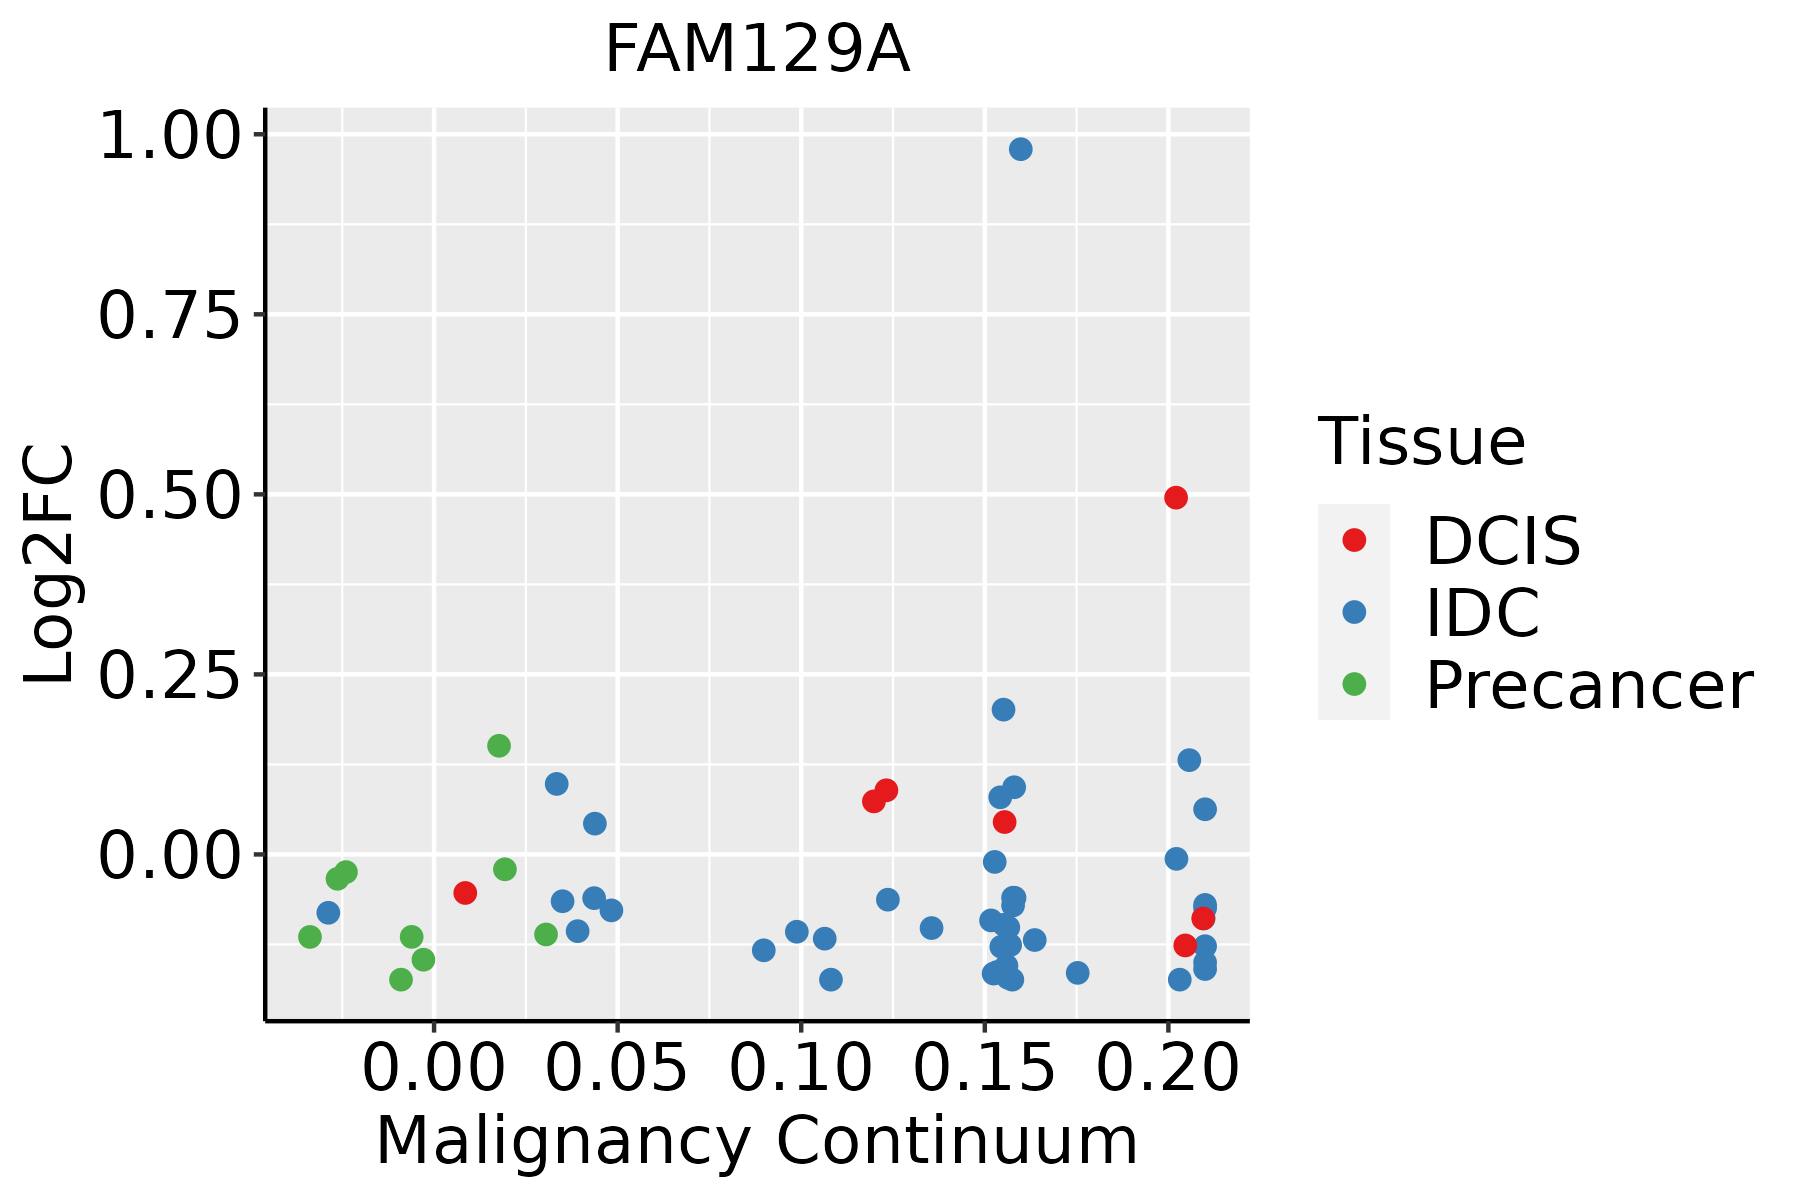 | IDC: Invasive ductal carcinoma |
| DCIS: Ductal carcinoma in situ | ||
| Precancer(BRCA1-mut): Precancerous lesion from BRCA1 mutation carriers | ||
| Esophagus | 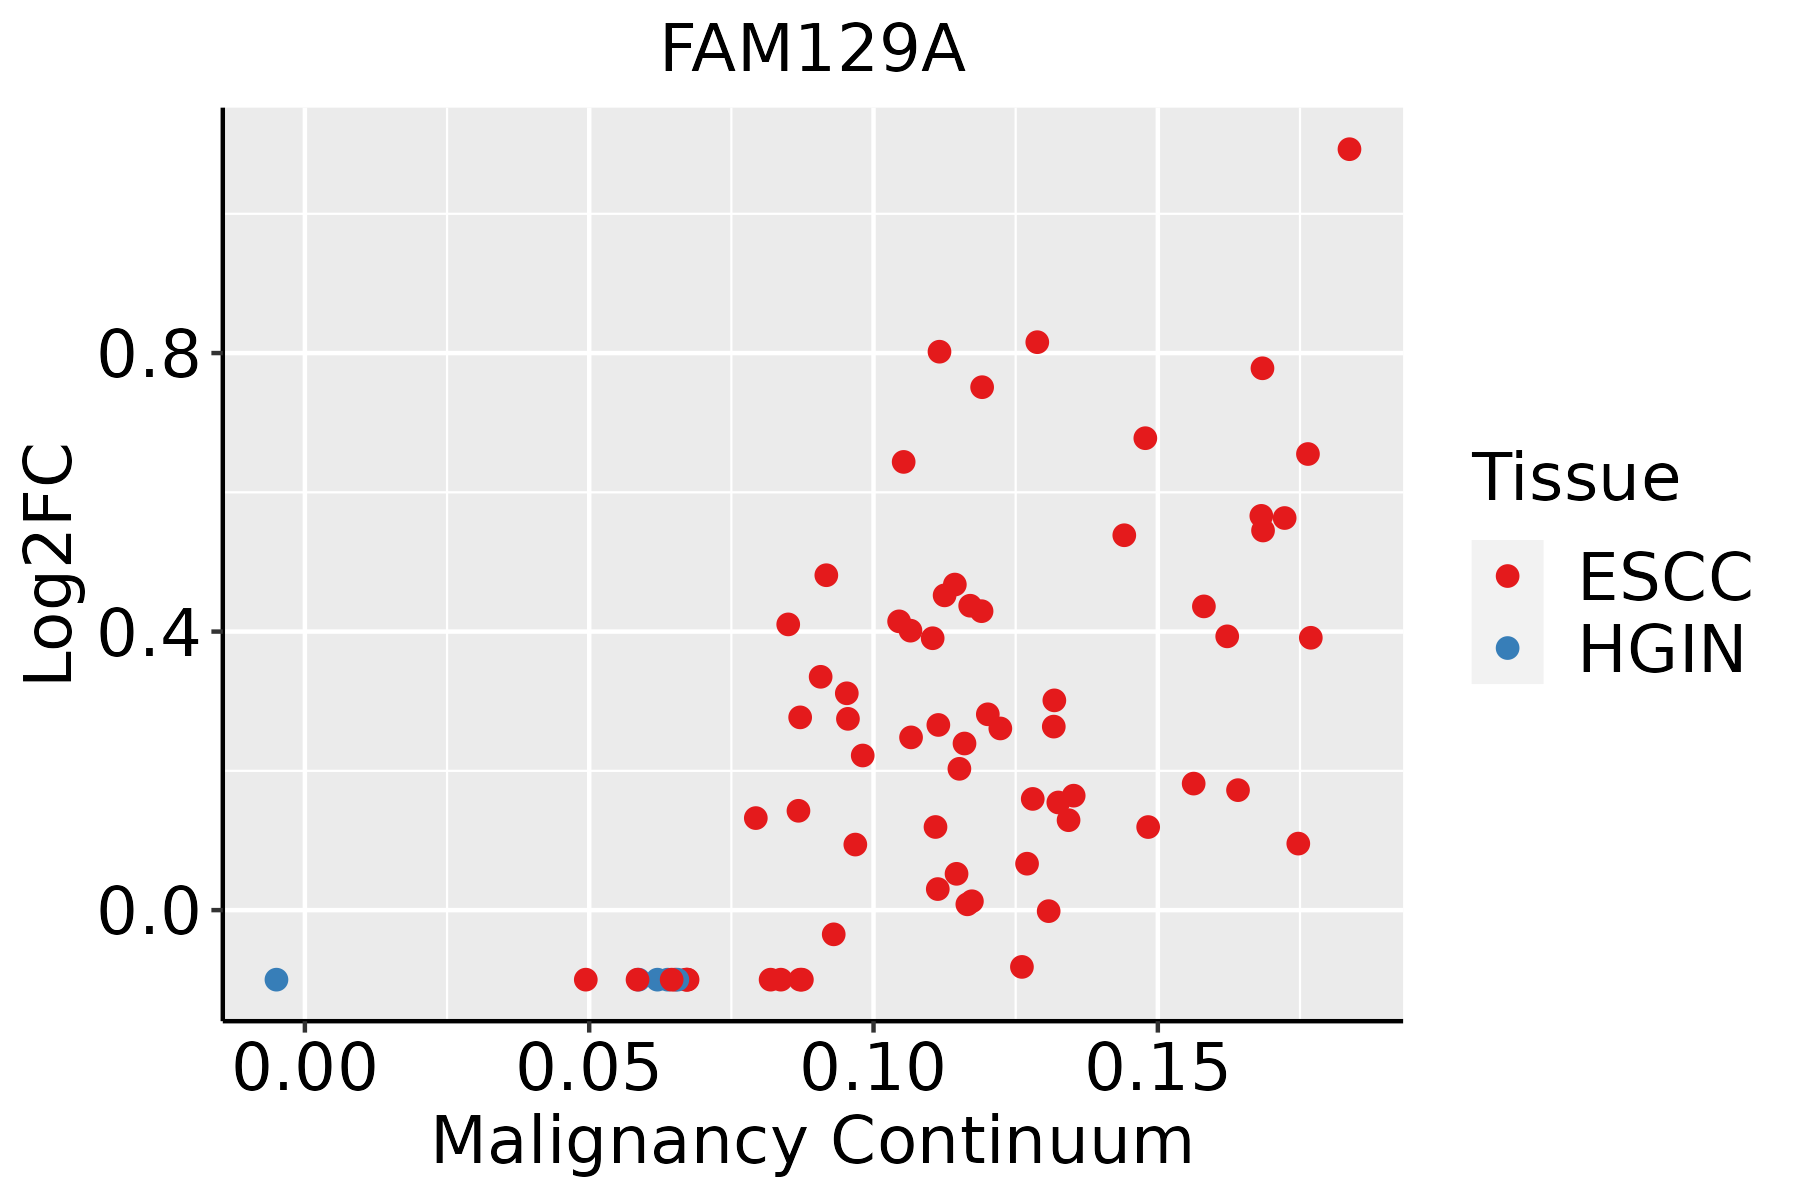 | ESCC: Esophageal squamous cell carcinoma |
| HGIN: High-grade intraepithelial neoplasias | ||
| LGIN: Low-grade intraepithelial neoplasias | ||
| Oral Cavity |  | EOLP: Erosive Oral lichen planus |
| LP: leukoplakia | ||
| NEOLP: Non-erosive oral lichen planus | ||
| OSCC: Oral squamous cell carcinoma | ||
| Prostate |  | BPH: Benign Prostatic Hyperplasia |
| Skin |  | AK: Actinic keratosis |
| cSCC: Cutaneous squamous cell carcinoma | ||
| SCCIS:squamous cell carcinoma in situ | ||
| Thyroid | 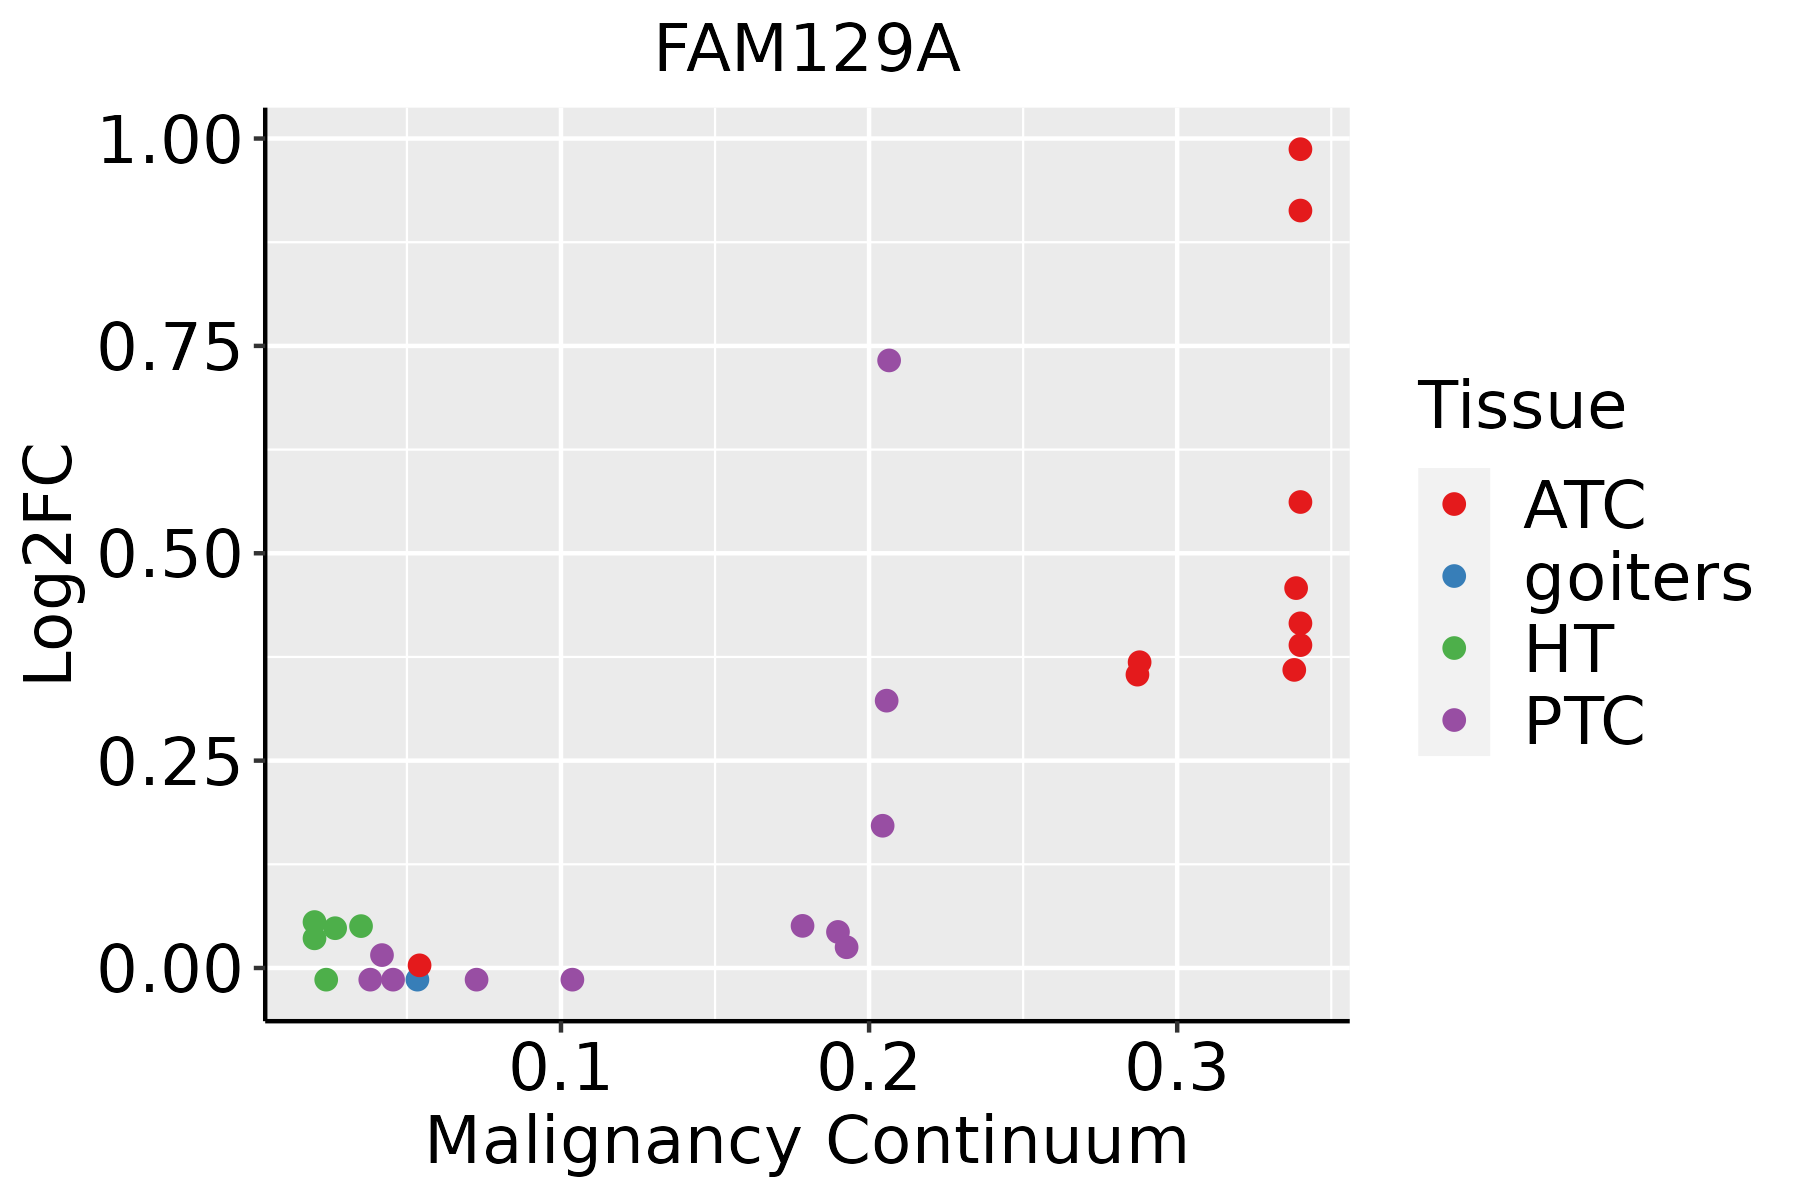 | ATC: Anaplastic thyroid cancer |
| HT: Hashimoto's thyroiditis | ||
| PTC: Papillary thyroid cancer |
| ∗log2FC in expression of this searched gene in stem-like cells from each diseased tissue sample relative to stem-like cells in normal samples in each tissue plotted against the malignancy continuum. Samples are colored based on if they are from different disease stage. |
Top |
Malignant transformation related pathway analysis |
| Find out the enriched GO biological processes and KEGG pathways involved in transition from healthy to precancer to cancer |
| Tissue | Disease Stage | Enriched GO biological Processes |
| Colorectum | AD |  |
| Colorectum | SER |  |
| Colorectum | MSS |  |
| Colorectum | MSI-H |  |
| Colorectum | FAP |  |
| ∗Top 15 enriched GO BP terms are showed in the bar plot of each disease state in each tissue. Each row represents a significant GO biological process which is colored according to the -log10(p.adjust). |
| Page: 1 2 3 4 5 6 7 8 9 |
| GO ID | Tissue | Disease Stage | Description | Gene Ratio | Bg Ratio | pvalue | p.adjust | Count |
| Page: 1 |
| Pathway ID | Tissue | Disease Stage | Description | Gene Ratio | Bg Ratio | pvalue | p.adjust | qvalue | Count |
| Page: 1 |
Top |
Cell-cell communication analysis |
| Identification of potential cell-cell interactions between two cell types and their ligand-receptor pairs for different disease states |
| Ligand | Receptor | LRpair | Pathway | Tissue | Disease Stage |
| Page: 1 |
Top |
Single-cell gene regulatory network inference analysis |
| Find out the significant the regulons (TFs) and the target genes of each regulon across cell types for different disease states |
| TF | Cell Type | Tissue | Disease Stage | Target Gene | RSS | Regulon Activity |
| ∗The dot plots of a searched regulon are shown for all cell subpopulations in each disease state of each tissue based on the regulon specific score inferred using pySCENIC and by calculating the average expression. |
| Page: 1 |
Top |
Somatic mutation of malignant transformation related genes |
| Annotation of somatic variants for genes involved in malignant transformation |
| Hugo Symbol | Variant Class | Variant Classification | dbSNP RS | HGVSc | HGVSp | HGVSp Short | SWISSPROT | BIOTYPE | SIFT | PolyPhen | Tumor Sample Barcode | Tissue | Histology | Sex | Age | Stage | Therapy Types | Drugs | Outcome |
| FAM129A | SNV | Missense_Mutation | c.2728G>A | p.Asp910Asn | p.D910N | Q9BZQ8 | protein_coding | deleterious_low_confidence(0.05) | possibly_damaging(0.624) | TCGA-AC-A23H-01 | Breast | breast invasive carcinoma | Female | >=65 | I/II | Unknown | Unknown | PD | |
| FAM129A | SNV | Missense_Mutation | c.2182C>G | p.Pro728Ala | p.P728A | Q9BZQ8 | protein_coding | tolerated_low_confidence(0.86) | benign(0.015) | TCGA-AC-A23H-01 | Breast | breast invasive carcinoma | Female | >=65 | I/II | Unknown | Unknown | PD | |
| FAM129A | SNV | Missense_Mutation | c.71C>T | p.Ala24Val | p.A24V | Q9BZQ8 | protein_coding | tolerated(1) | benign(0.003) | TCGA-D8-A1J8-01 | Breast | breast invasive carcinoma | Female | >=65 | I/II | Hormone Therapy | nolvadex | SD | |
| FAM129A | SNV | Missense_Mutation | c.203G>C | p.Gly68Ala | p.G68A | Q9BZQ8 | protein_coding | tolerated(0.18) | benign(0.337) | TCGA-PE-A5DE-01 | Breast | breast invasive carcinoma | Female | <65 | I/II | Chemotherapy | taxotere | CR | |
| FAM129A | insertion | Frame_Shift_Ins | novel | c.603_604insGGTGCCTTGCCTCTGTGTGG | p.Tyr202GlyfsTer9 | p.Y202Gfs*9 | Q9BZQ8 | protein_coding | TCGA-A8-A09T-01 | Breast | breast invasive carcinoma | Female | >=65 | I/II | Hormone Therapy | anastrozole | SD | ||
| FAM129A | insertion | Nonsense_Mutation | novel | c.1717_1718insAGAGGGCTGCACCTTAGGTTCTGACCCCAT | p.Met573delinsLysArgAlaAlaProTerValLeuThrProLeu | p.M573delinsKRAAP*VLTPL | Q9BZQ8 | protein_coding | TCGA-BH-A0BM-01 | Breast | breast invasive carcinoma | Female | <65 | I/II | Chemotherapy | adriamycin | SD | ||
| FAM129A | SNV | Missense_Mutation | c.1885G>A | p.Glu629Lys | p.E629K | Q9BZQ8 | protein_coding | tolerated(0.21) | benign(0.077) | TCGA-DG-A2KL-01 | Cervix | cervical & endocervical cancer | Female | <65 | I/II | Chemotherapy | cisplatin | SD | |
| FAM129A | SNV | Missense_Mutation | rs769217969 | c.2777N>T | p.Ser926Leu | p.S926L | Q9BZQ8 | protein_coding | tolerated_low_confidence(0.12) | benign(0.006) | TCGA-DR-A0ZM-01 | Cervix | cervical & endocervical cancer | Female | <65 | III/IV | Unspecific | Cisplatin | SD |
| FAM129A | SNV | Missense_Mutation | rs562448693 | c.134N>A | p.Arg45His | p.R45H | Q9BZQ8 | protein_coding | tolerated(0.16) | probably_damaging(0.938) | TCGA-A6-6653-01 | Colorectum | colon adenocarcinoma | Male | >=65 | I/II | Unknown | Unknown | SD |
| FAM129A | SNV | Missense_Mutation | c.560T>G | p.Phe187Cys | p.F187C | Q9BZQ8 | protein_coding | deleterious(0) | probably_damaging(0.998) | TCGA-AA-A00N-01 | Colorectum | colon adenocarcinoma | Male | >=65 | I/II | Unknown | Unknown | PD |
| Page: 1 2 3 4 5 6 7 8 9 10 11 |
Top |
Related drugs of malignant transformation related genes |
| Identification of chemicals and drugs interact with genes involved in malignant transfromation |
| (DGIdb 4.0) |
| Entrez ID | Symbol | Category | Interaction Types | Drug Claim Name | Drug Name | PMIDs |
| Page: 1 |

Copyright 2023-Present -The University of Texas Health Science Center at Houston |