
|
|||||
|
 | |
| |
| |
| |
| |
| |
|
Gene: FAM127B |
Gene summary for FAM127B |
| Gene information | Species | Human | Gene symbol | FAM127B | Gene ID | 26071 |
| Gene name | retrotransposon Gag like 8A | |
| Gene Alias | CXX1b | |
| Cytomap | Xq26.3 | |
| Gene Type | protein-coding | GO ID | GO:0005575 | UniProtAcc | Q9BWD3 |
Top |
Malignant transformation analysis |
| Identification of the aberrant gene expression in precancerous and cancerous lesions by comparing the gene expression of stem-like cells in diseased tissues with normal stem cells |
| Entrez ID | Symbol | Replicates | Species | Organ | Tissue | Adj P-value | Log2FC | Malignancy |
| 26071 | FAM127B | LZE4T | Human | Esophagus | ESCC | 4.49e-02 | -2.42e-01 | 0.0811 |
| 26071 | FAM127B | LZE24T | Human | Esophagus | ESCC | 6.32e-04 | -2.42e-01 | 0.0596 |
| 26071 | FAM127B | P1T-E | Human | Esophagus | ESCC | 1.47e-17 | 1.63e+00 | 0.0875 |
| 26071 | FAM127B | P2T-E | Human | Esophagus | ESCC | 9.80e-59 | 1.13e+00 | 0.1177 |
| 26071 | FAM127B | P4T-E | Human | Esophagus | ESCC | 8.00e-58 | 1.47e+00 | 0.1323 |
| 26071 | FAM127B | P5T-E | Human | Esophagus | ESCC | 2.85e-43 | 7.79e-01 | 0.1327 |
| 26071 | FAM127B | P8T-E | Human | Esophagus | ESCC | 2.17e-58 | 1.22e+00 | 0.0889 |
| 26071 | FAM127B | P9T-E | Human | Esophagus | ESCC | 1.47e-63 | 1.70e+00 | 0.1131 |
| 26071 | FAM127B | P10T-E | Human | Esophagus | ESCC | 1.09e-93 | 1.68e+00 | 0.116 |
| 26071 | FAM127B | P11T-E | Human | Esophagus | ESCC | 2.40e-32 | 1.40e+00 | 0.1426 |
| 26071 | FAM127B | P12T-E | Human | Esophagus | ESCC | 2.59e-88 | 1.84e+00 | 0.1122 |
| 26071 | FAM127B | P15T-E | Human | Esophagus | ESCC | 4.96e-24 | 8.05e-01 | 0.1149 |
| 26071 | FAM127B | P16T-E | Human | Esophagus | ESCC | 5.64e-39 | 6.40e-01 | 0.1153 |
| 26071 | FAM127B | P17T-E | Human | Esophagus | ESCC | 6.12e-20 | 9.07e-01 | 0.1278 |
| 26071 | FAM127B | P19T-E | Human | Esophagus | ESCC | 1.60e-16 | 1.86e+00 | 0.1662 |
| 26071 | FAM127B | P20T-E | Human | Esophagus | ESCC | 4.44e-40 | 1.19e+00 | 0.1124 |
| 26071 | FAM127B | P21T-E | Human | Esophagus | ESCC | 5.16e-102 | 1.90e+00 | 0.1617 |
| 26071 | FAM127B | P22T-E | Human | Esophagus | ESCC | 1.80e-137 | 2.81e+00 | 0.1236 |
| 26071 | FAM127B | P23T-E | Human | Esophagus | ESCC | 9.65e-67 | 2.07e+00 | 0.108 |
| 26071 | FAM127B | P24T-E | Human | Esophagus | ESCC | 2.68e-60 | 1.27e+00 | 0.1287 |
| Page: 1 2 3 4 5 6 |
| Tissue | Expression Dynamics | Abbreviation |
| Esophagus |  | ESCC: Esophageal squamous cell carcinoma |
| HGIN: High-grade intraepithelial neoplasias | ||
| LGIN: Low-grade intraepithelial neoplasias | ||
| Oral Cavity | 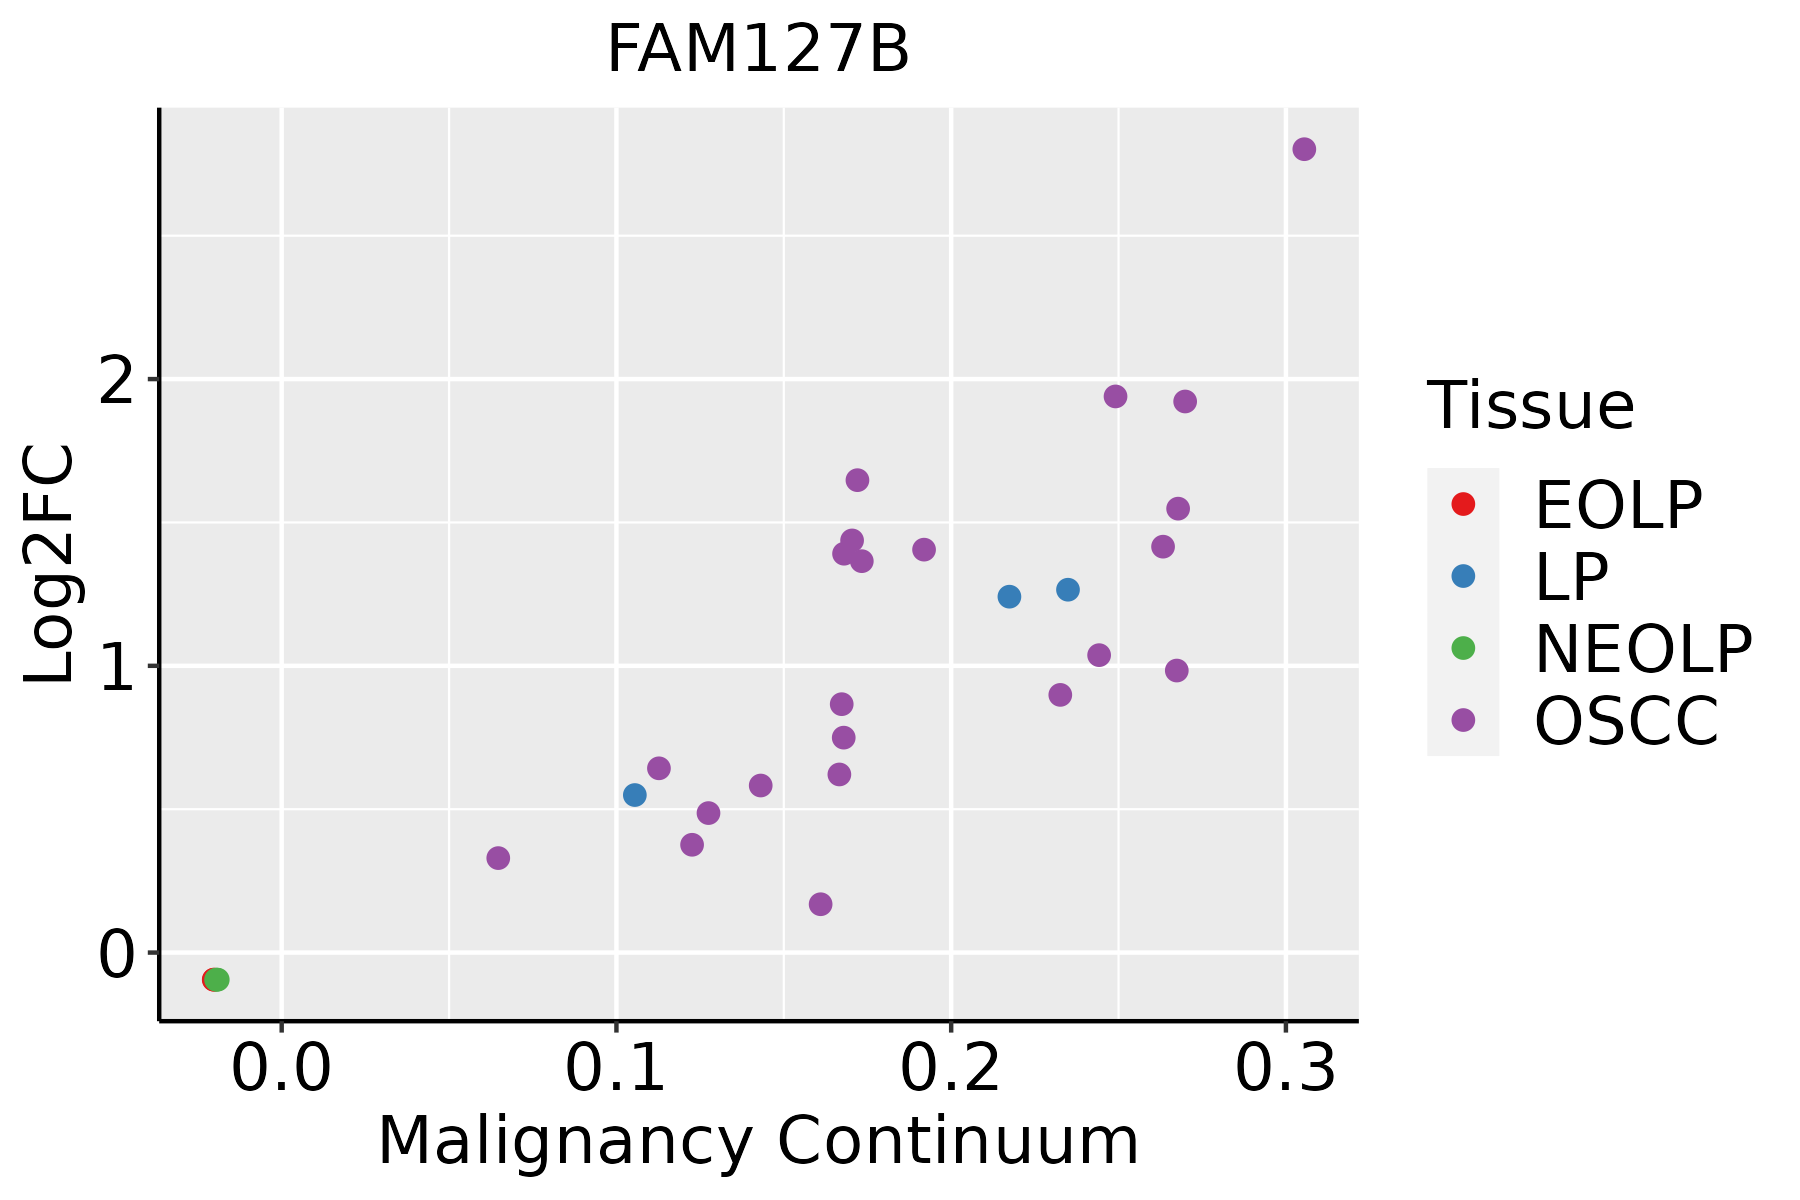 | EOLP: Erosive Oral lichen planus |
| LP: leukoplakia | ||
| NEOLP: Non-erosive oral lichen planus | ||
| OSCC: Oral squamous cell carcinoma | ||
| Prostate | 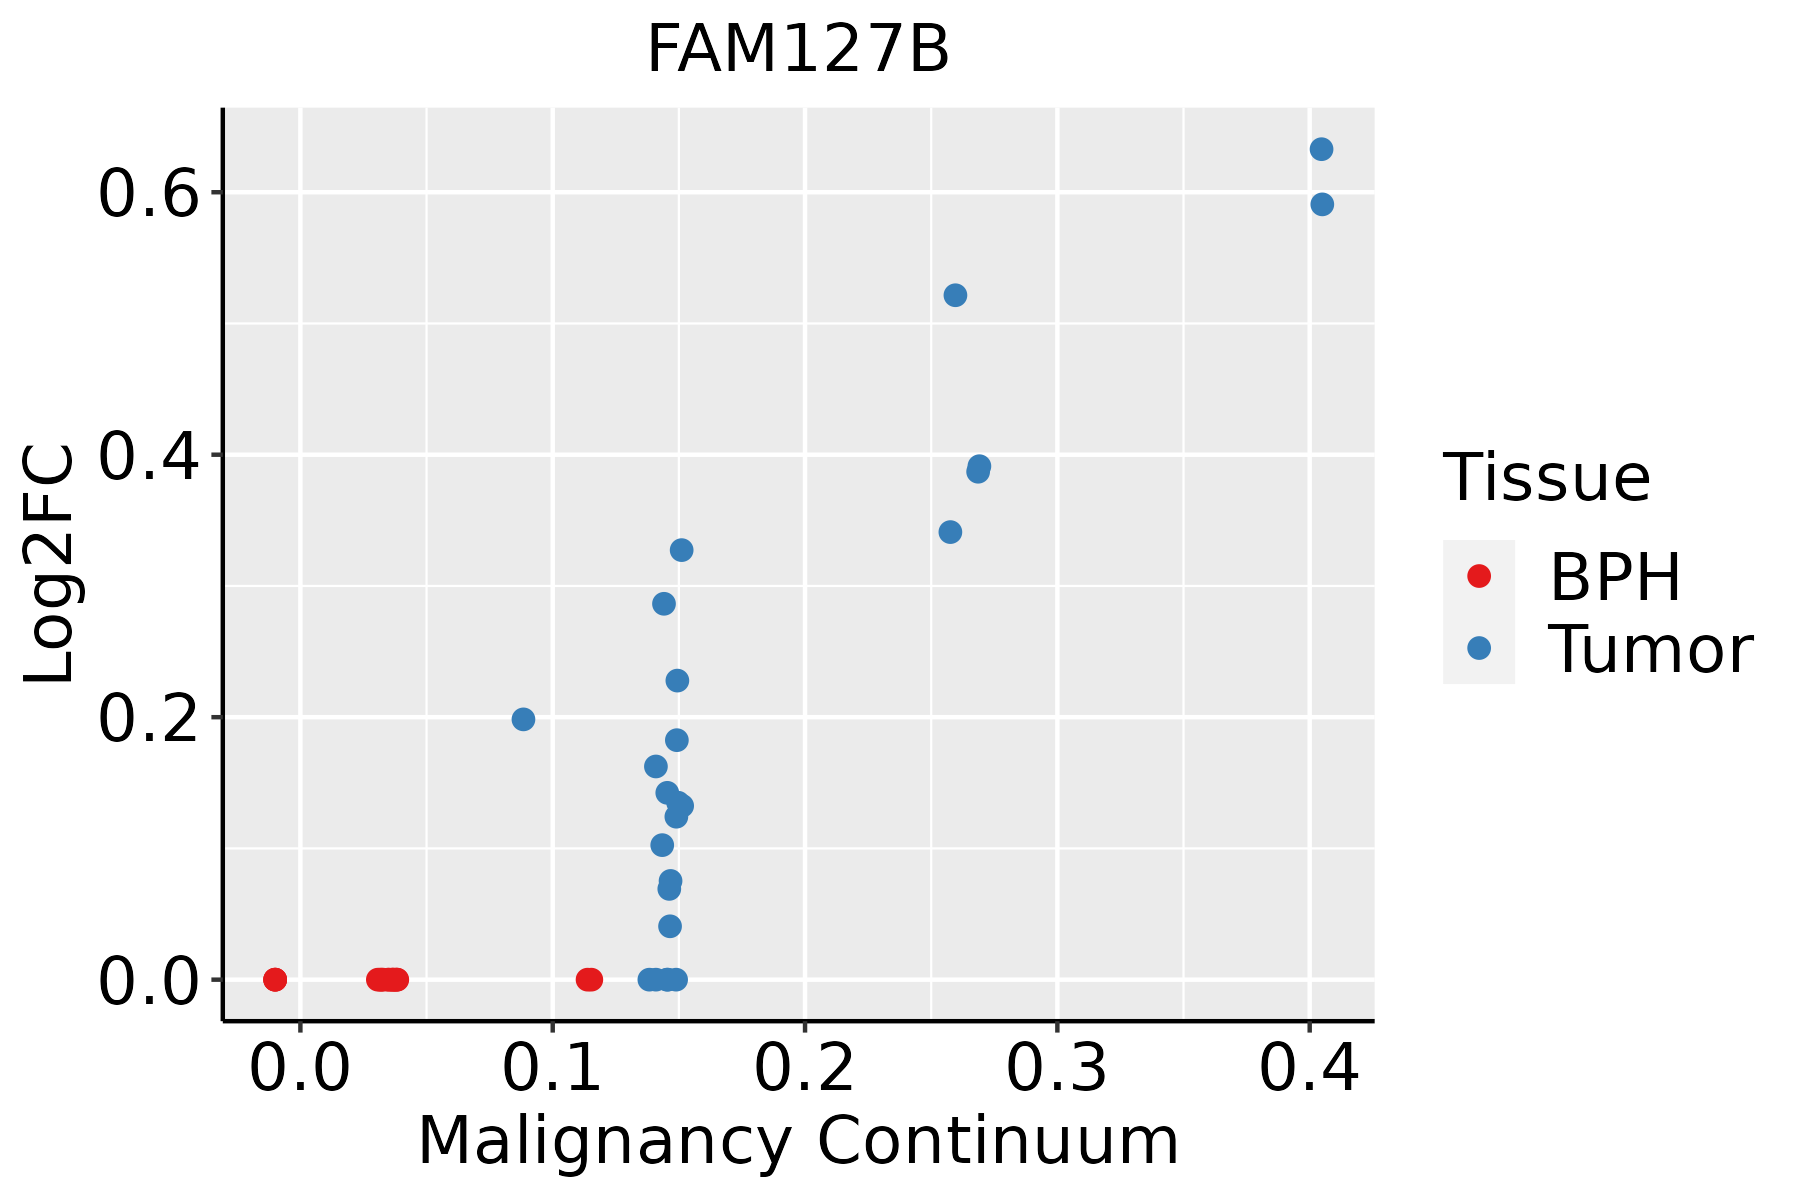 | BPH: Benign Prostatic Hyperplasia |
| Skin | 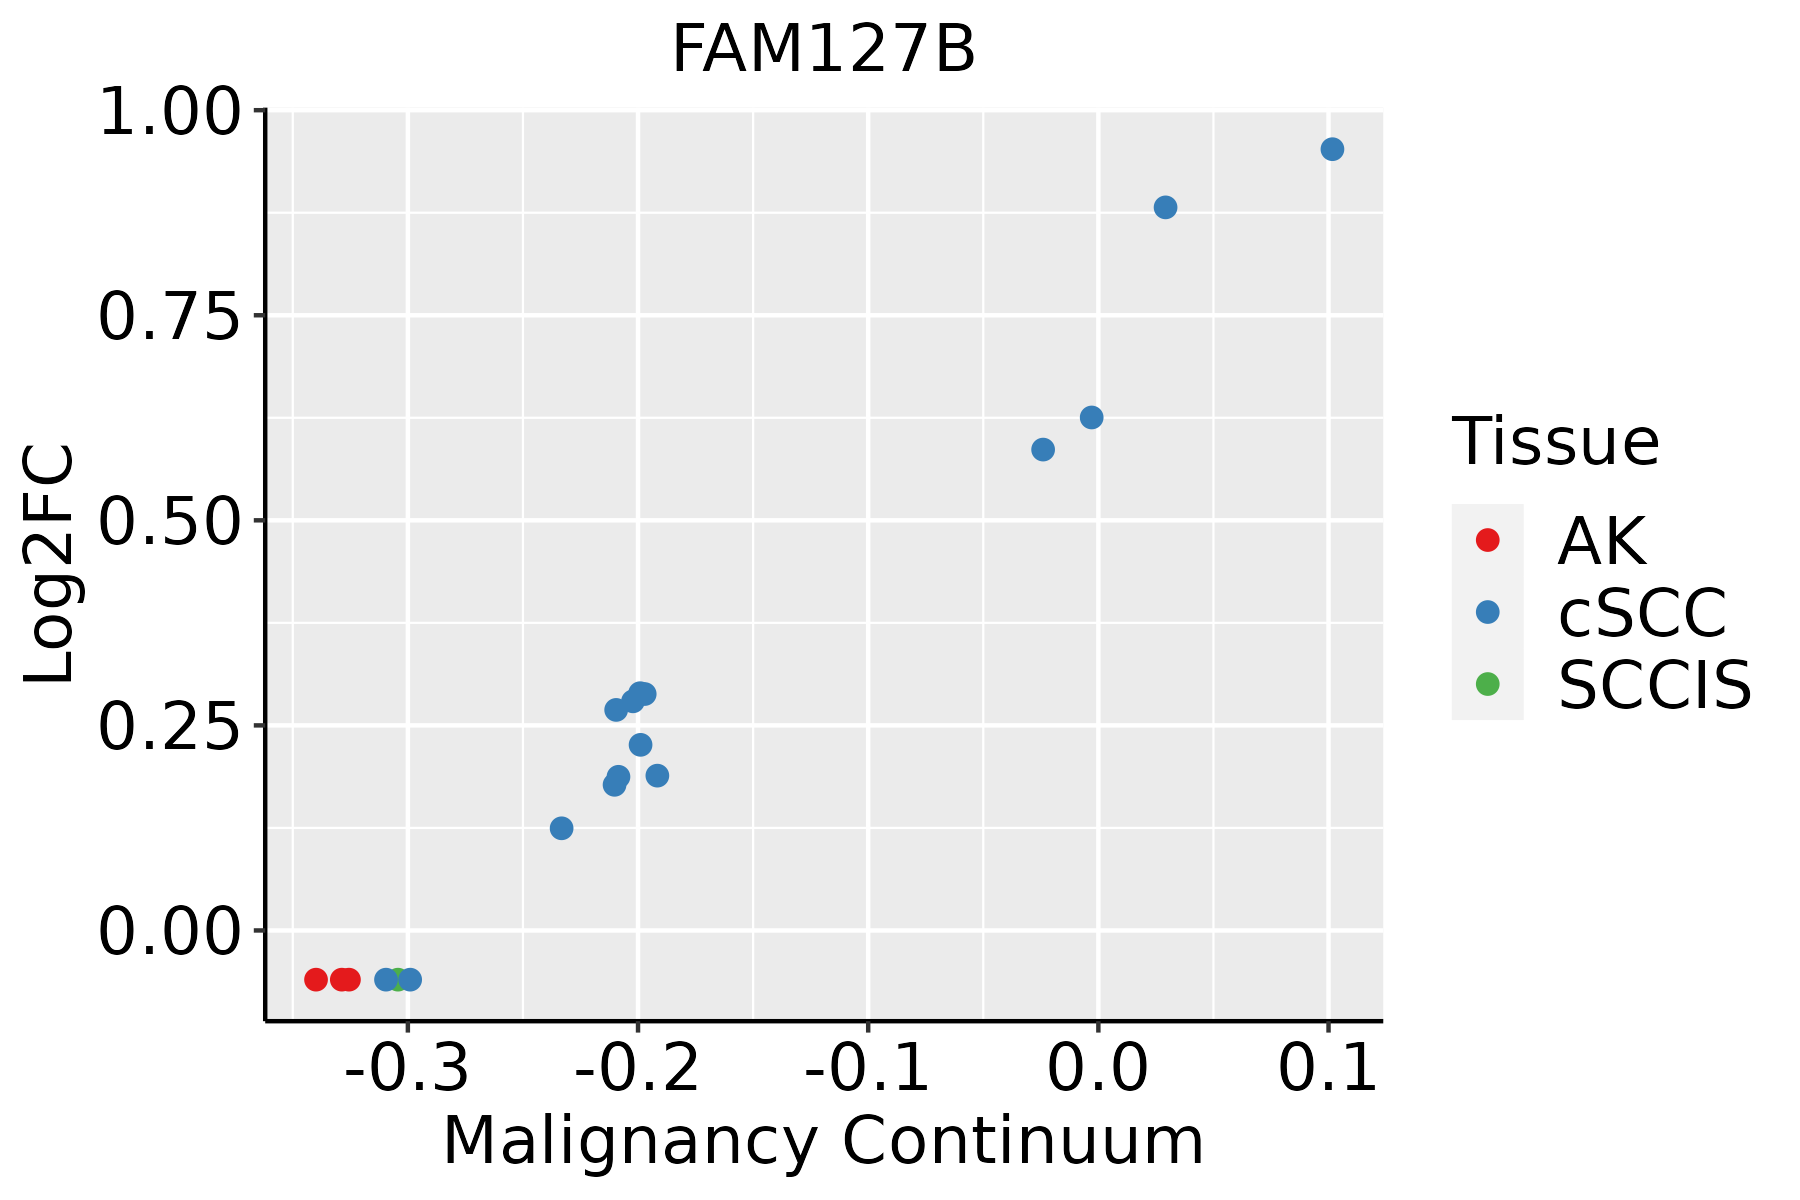 | AK: Actinic keratosis |
| cSCC: Cutaneous squamous cell carcinoma | ||
| SCCIS:squamous cell carcinoma in situ |
| ∗log2FC in expression of this searched gene in stem-like cells from each diseased tissue sample relative to stem-like cells in normal samples in each tissue plotted against the malignancy continuum. Samples are colored based on if they are from different disease stage. |
Top |
Malignant transformation related pathway analysis |
| Find out the enriched GO biological processes and KEGG pathways involved in transition from healthy to precancer to cancer |
| Tissue | Disease Stage | Enriched GO biological Processes |
| Colorectum | AD |  |
| Colorectum | SER |  |
| Colorectum | MSS |  |
| Colorectum | MSI-H |  |
| Colorectum | FAP |  |
| ∗Top 15 enriched GO BP terms are showed in the bar plot of each disease state in each tissue. Each row represents a significant GO biological process which is colored according to the -log10(p.adjust). |
| Page: 1 2 3 4 5 6 7 8 9 |
| GO ID | Tissue | Disease Stage | Description | Gene Ratio | Bg Ratio | pvalue | p.adjust | Count |
| Page: 1 |
| Pathway ID | Tissue | Disease Stage | Description | Gene Ratio | Bg Ratio | pvalue | p.adjust | qvalue | Count |
| Page: 1 |
Top |
Cell-cell communication analysis |
| Identification of potential cell-cell interactions between two cell types and their ligand-receptor pairs for different disease states |
| Ligand | Receptor | LRpair | Pathway | Tissue | Disease Stage |
| Page: 1 |
Top |
Single-cell gene regulatory network inference analysis |
| Find out the significant the regulons (TFs) and the target genes of each regulon across cell types for different disease states |
| TF | Cell Type | Tissue | Disease Stage | Target Gene | RSS | Regulon Activity |
| ∗The dot plots of a searched regulon are shown for all cell subpopulations in each disease state of each tissue based on the regulon specific score inferred using pySCENIC and by calculating the average expression. |
| Page: 1 |
Top |
Somatic mutation of malignant transformation related genes |
| Annotation of somatic variants for genes involved in malignant transformation |
| Hugo Symbol | Variant Class | Variant Classification | dbSNP RS | HGVSc | HGVSp | HGVSp Short | SWISSPROT | BIOTYPE | SIFT | PolyPhen | Tumor Sample Barcode | Tissue | Histology | Sex | Age | Stage | Therapy Types | Drugs | Outcome |
| FAM127B | SNV | Missense_Mutation | c.24N>A | p.Met8Ile | p.M8I | Q9BWD3 | protein_coding | tolerated(1) | benign(0) | TCGA-AC-A23H-01 | Breast | breast invasive carcinoma | Female | >=65 | I/II | Unknown | Unknown | PD | |
| FAM127B | SNV | Missense_Mutation | c.62N>A | p.Arg21His | p.R21H | Q9BWD3 | protein_coding | deleterious(0.02) | possibly_damaging(0.796) | TCGA-B6-A0IJ-01 | Breast | breast invasive carcinoma | Female | <65 | I/II | Unknown | Unknown | SD | |
| FAM127B | SNV | Missense_Mutation | c.331N>A | p.Glu111Lys | p.E111K | Q9BWD3 | protein_coding | tolerated_low_confidence(0.11) | benign(0.003) | TCGA-GM-A2D9-01 | Breast | breast invasive carcinoma | Female | >=65 | I/II | Hormone Therapy | arimidex | SD | |
| FAM127B | SNV | Missense_Mutation | c.65N>A | p.Arg22His | p.R22H | Q9BWD3 | protein_coding | tolerated(0.05) | probably_damaging(0.991) | TCGA-2W-A8YY-01 | Cervix | cervical & endocervical cancer | Female | <65 | I/II | Chemotherapy | cisplatin | CR | |
| FAM127B | SNV | Missense_Mutation | novel | c.10C>T | p.Arg4Trp | p.R4W | Q9BWD3 | protein_coding | deleterious(0) | possibly_damaging(0.779) | TCGA-VS-A8EK-01 | Cervix | cervical & endocervical cancer | Female | >=65 | I/II | Chemotherapy | cisplatin | PD |
| FAM127B | SNV | Missense_Mutation | novel | c.263N>A | p.Ser88Asn | p.S88N | Q9BWD3 | protein_coding | deleterious(0.03) | probably_damaging(0.999) | TCGA-5M-AAT6-01 | Colorectum | colon adenocarcinoma | Female | <65 | III/IV | Unknown | Unknown | PD |
| FAM127B | SNV | Missense_Mutation | c.211N>T | p.Arg71Cys | p.R71C | Q9BWD3 | protein_coding | deleterious(0) | probably_damaging(0.991) | TCGA-A6-5665-01 | Colorectum | colon adenocarcinoma | Female | >=65 | I/II | Unknown | Unknown | PD | |
| FAM127B | SNV | Missense_Mutation | c.211C>T | p.Arg71Cys | p.R71C | Q9BWD3 | protein_coding | deleterious(0) | probably_damaging(0.991) | TCGA-AA-3815-01 | Colorectum | colon adenocarcinoma | Female | >=65 | I/II | Unknown | Unknown | SD | |
| FAM127B | SNV | Missense_Mutation | c.18G>C | p.Gln6His | p.Q6H | Q9BWD3 | protein_coding | tolerated(0.06) | benign(0.264) | TCGA-AA-3866-01 | Colorectum | colon adenocarcinoma | Female | >=65 | I/II | Unknown | Unknown | SD | |
| FAM127B | SNV | Missense_Mutation | c.56N>T | p.Ala19Val | p.A19V | Q9BWD3 | protein_coding | tolerated(0.29) | benign(0.074) | TCGA-AA-3949-01 | Colorectum | colon adenocarcinoma | Female | >=65 | III/IV | Unknown | Unknown | SD |
| Page: 1 2 |
Top |
Related drugs of malignant transformation related genes |
| Identification of chemicals and drugs interact with genes involved in malignant transfromation |
| (DGIdb 4.0) |
| Entrez ID | Symbol | Category | Interaction Types | Drug Claim Name | Drug Name | PMIDs |
| Page: 1 |

Copyright 2023-Present -The University of Texas Health Science Center at Houston |