
|
|||||
|
 | |
| |
| |
| |
| |
| |
|
Gene: FAM126B |
Gene summary for FAM126B |
| Gene information | Species | Human | Gene symbol | FAM126B | Gene ID | 285172 |
| Gene name | family with sequence similarity 126 member B | |
| Gene Alias | HYCC2 | |
| Cytomap | 2q33.1 | |
| Gene Type | protein-coding | GO ID | GO:0006629 | UniProtAcc | Q8IXS8 |
Top |
Malignant transformation analysis |
| Identification of the aberrant gene expression in precancerous and cancerous lesions by comparing the gene expression of stem-like cells in diseased tissues with normal stem cells |
| Entrez ID | Symbol | Replicates | Species | Organ | Tissue | Adj P-value | Log2FC | Malignancy |
| 285172 | FAM126B | CCI_2 | Human | Cervix | CC | 4.66e-03 | 6.69e-01 | 0.5249 |
| 285172 | FAM126B | CCI_3 | Human | Cervix | CC | 2.58e-02 | 5.18e-01 | 0.516 |
| 285172 | FAM126B | sample3 | Human | Cervix | CC | 2.60e-02 | 1.42e-01 | 0.1387 |
| 285172 | FAM126B | LZE4T | Human | Esophagus | ESCC | 3.48e-02 | 7.94e-02 | 0.0811 |
| 285172 | FAM126B | LZE5T | Human | Esophagus | ESCC | 1.13e-03 | 1.58e-01 | 0.0514 |
| 285172 | FAM126B | LZE7T | Human | Esophagus | ESCC | 2.31e-02 | 1.38e-01 | 0.0667 |
| 285172 | FAM126B | LZE24T | Human | Esophagus | ESCC | 9.26e-09 | 1.12e-01 | 0.0596 |
| 285172 | FAM126B | LZE6T | Human | Esophagus | ESCC | 2.45e-02 | 4.61e-02 | 0.0845 |
| 285172 | FAM126B | P2T-E | Human | Esophagus | ESCC | 6.32e-12 | 4.31e-02 | 0.1177 |
| 285172 | FAM126B | P4T-E | Human | Esophagus | ESCC | 7.00e-14 | 1.55e-01 | 0.1323 |
| 285172 | FAM126B | P5T-E | Human | Esophagus | ESCC | 1.18e-06 | 3.84e-03 | 0.1327 |
| 285172 | FAM126B | P8T-E | Human | Esophagus | ESCC | 6.49e-18 | 2.36e-01 | 0.0889 |
| 285172 | FAM126B | P10T-E | Human | Esophagus | ESCC | 1.89e-17 | 1.26e-01 | 0.116 |
| 285172 | FAM126B | P11T-E | Human | Esophagus | ESCC | 2.37e-11 | 3.97e-01 | 0.1426 |
| 285172 | FAM126B | P12T-E | Human | Esophagus | ESCC | 8.83e-08 | 1.90e-01 | 0.1122 |
| 285172 | FAM126B | P15T-E | Human | Esophagus | ESCC | 4.55e-19 | 3.27e-01 | 0.1149 |
| 285172 | FAM126B | P16T-E | Human | Esophagus | ESCC | 3.14e-03 | 8.22e-02 | 0.1153 |
| 285172 | FAM126B | P20T-E | Human | Esophagus | ESCC | 1.64e-04 | 2.43e-01 | 0.1124 |
| 285172 | FAM126B | P21T-E | Human | Esophagus | ESCC | 4.03e-12 | 4.57e-02 | 0.1617 |
| 285172 | FAM126B | P22T-E | Human | Esophagus | ESCC | 3.80e-05 | 9.23e-03 | 0.1236 |
| Page: 1 2 3 4 |
| Tissue | Expression Dynamics | Abbreviation |
| Cervix | 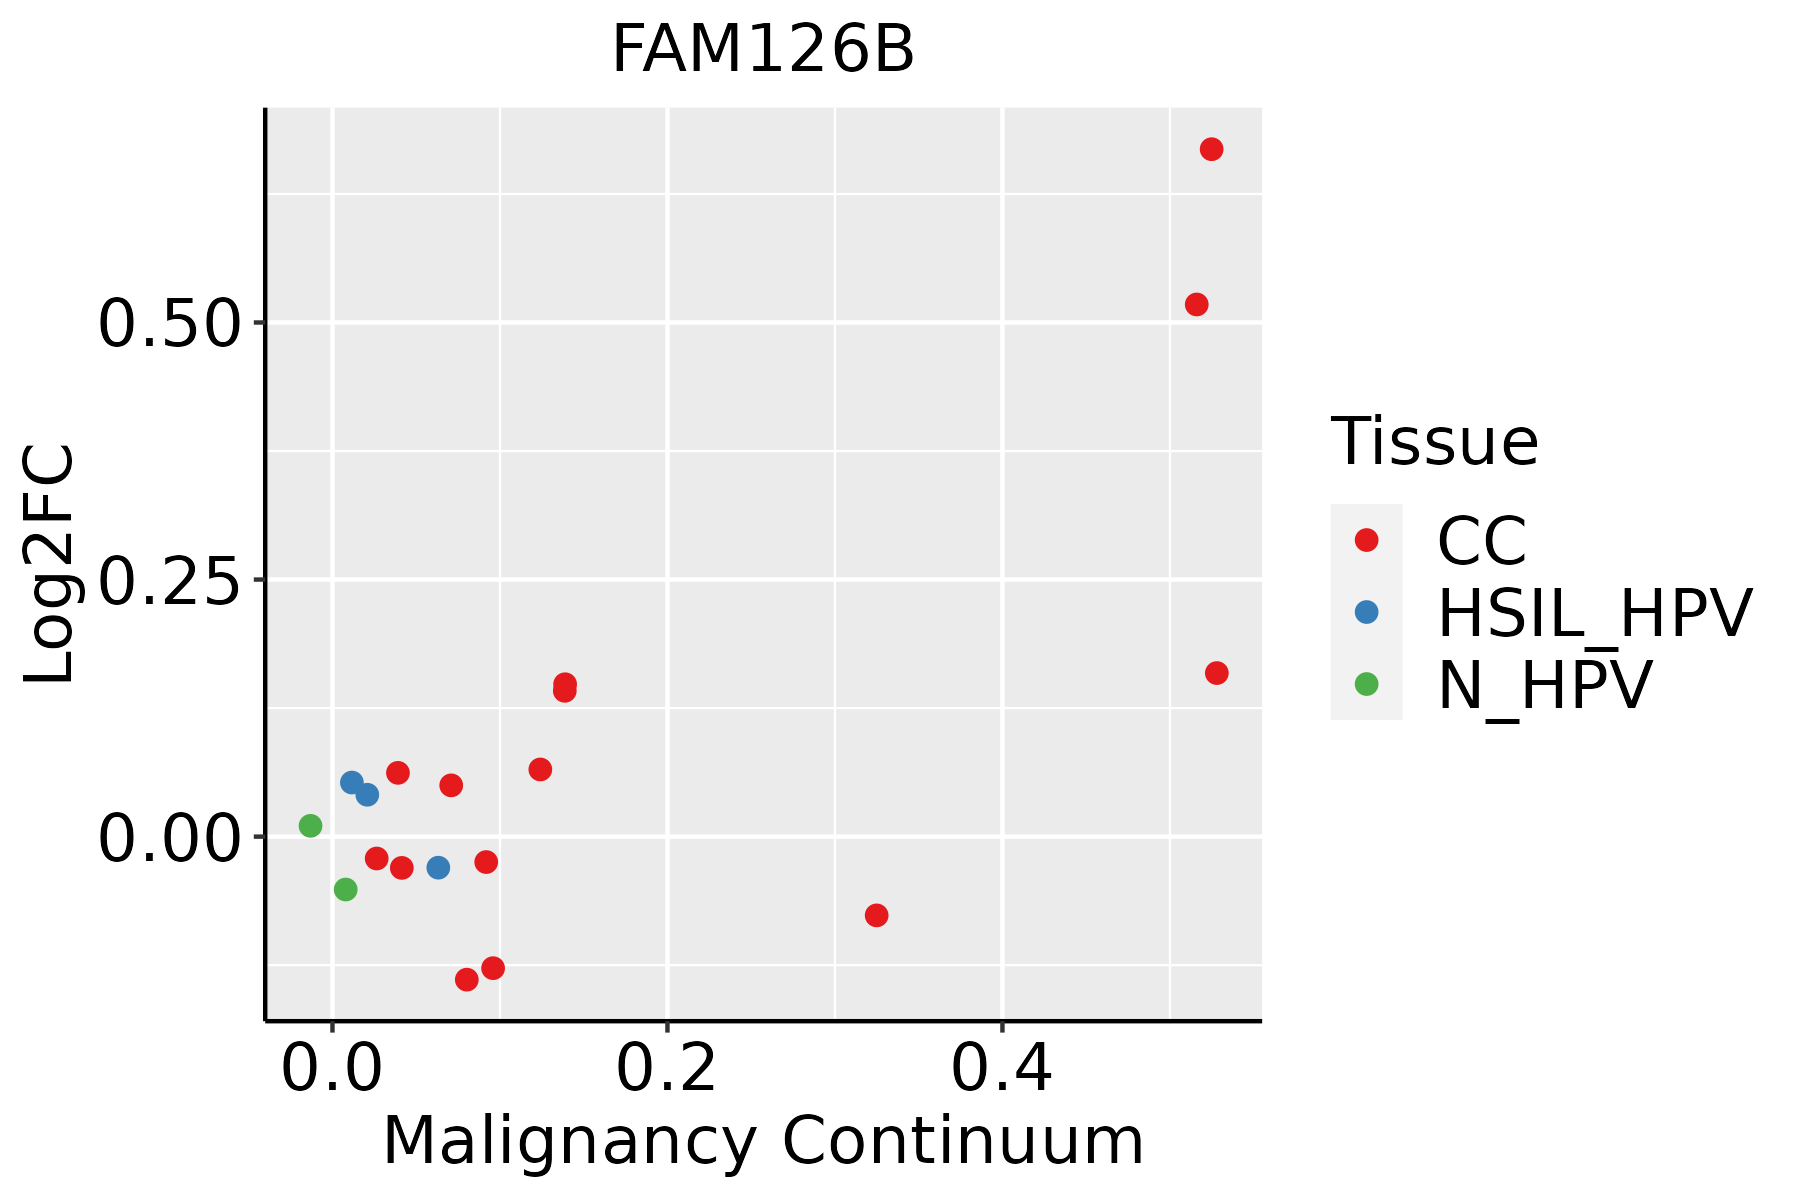 | CC: Cervix cancer |
| HSIL_HPV: HPV-infected high-grade squamous intraepithelial lesions | ||
| N_HPV: HPV-infected normal cervix | ||
| Esophagus |  | ESCC: Esophageal squamous cell carcinoma |
| HGIN: High-grade intraepithelial neoplasias | ||
| LGIN: Low-grade intraepithelial neoplasias | ||
| Liver | 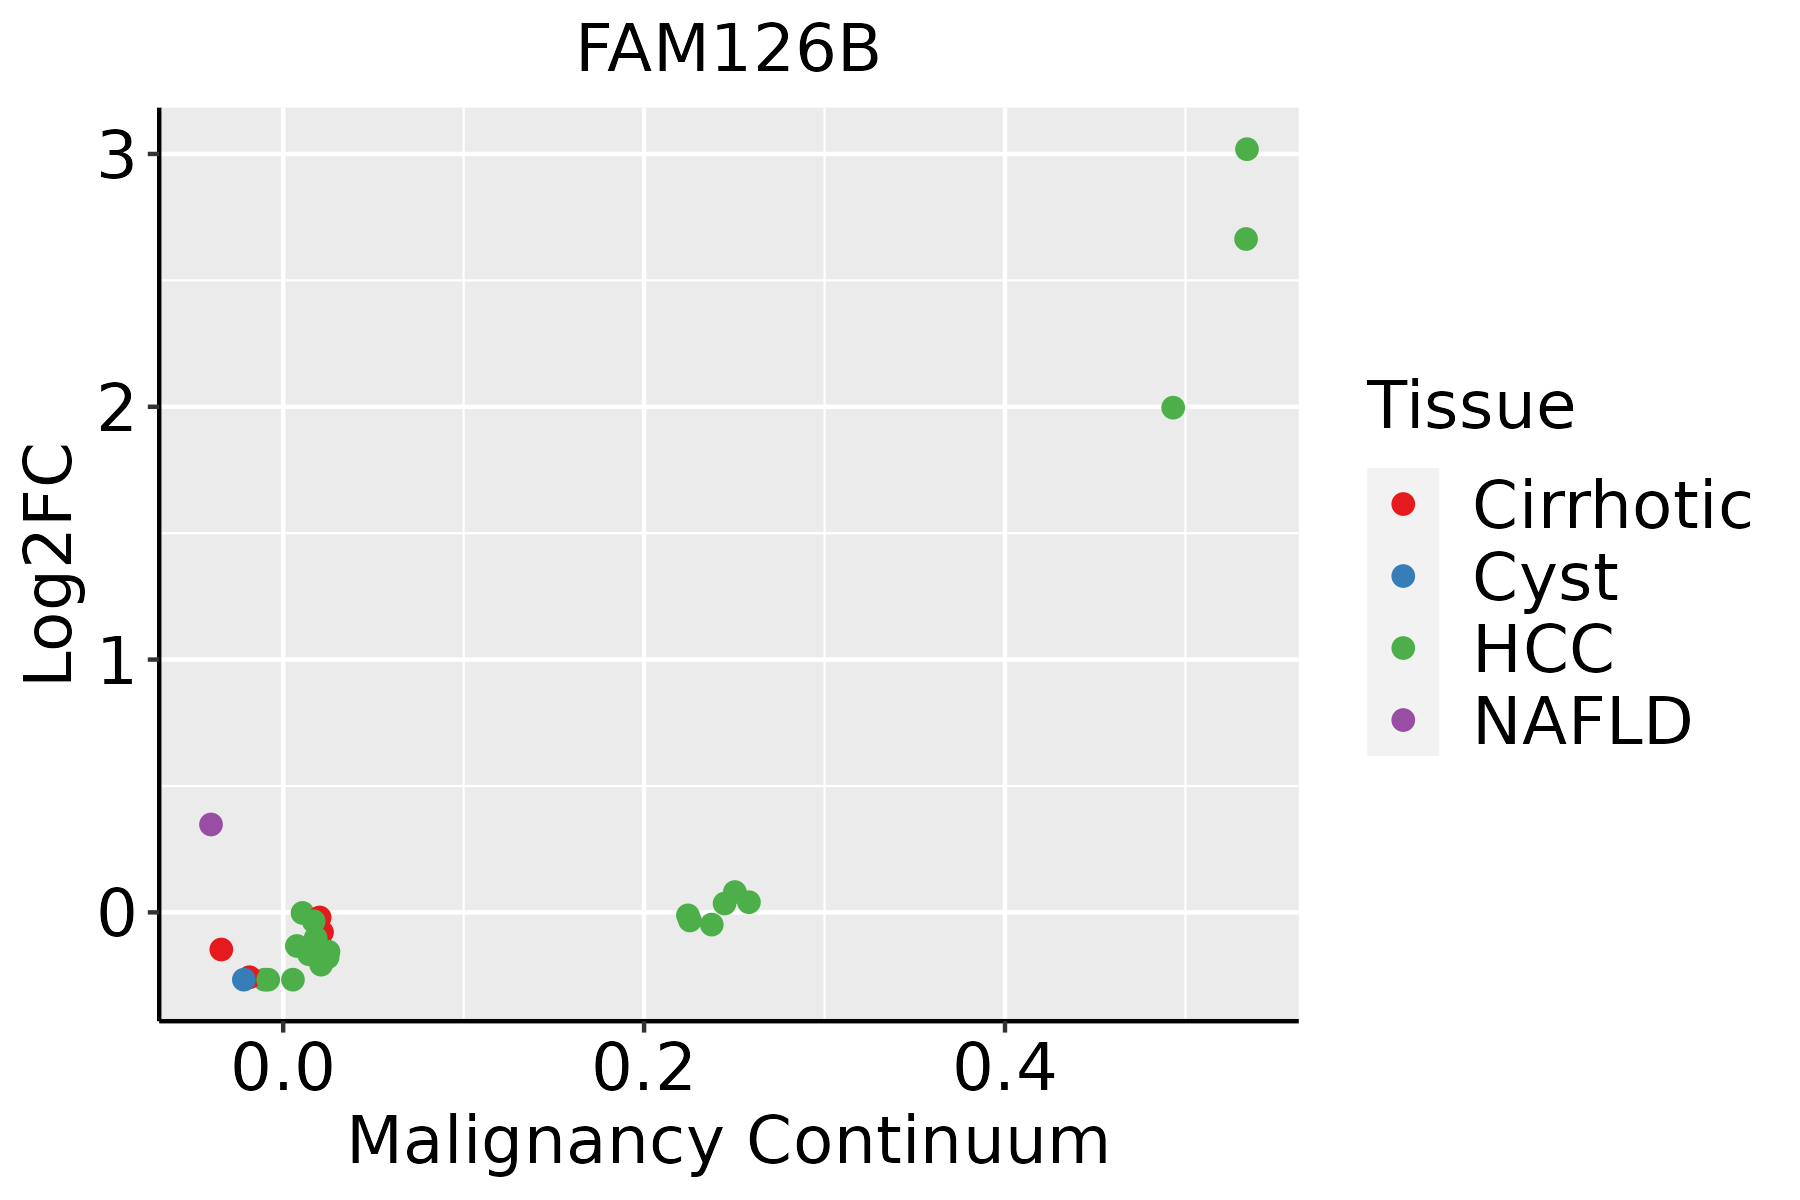 | HCC: Hepatocellular carcinoma |
| NAFLD: Non-alcoholic fatty liver disease |
| ∗log2FC in expression of this searched gene in stem-like cells from each diseased tissue sample relative to stem-like cells in normal samples in each tissue plotted against the malignancy continuum. Samples are colored based on if they are from different disease stage. |
Top |
Malignant transformation related pathway analysis |
| Find out the enriched GO biological processes and KEGG pathways involved in transition from healthy to precancer to cancer |
| Tissue | Disease Stage | Enriched GO biological Processes |
| Colorectum | AD |  |
| Colorectum | SER |  |
| Colorectum | MSS |  |
| Colorectum | MSI-H |  |
| Colorectum | FAP |  |
| ∗Top 15 enriched GO BP terms are showed in the bar plot of each disease state in each tissue. Each row represents a significant GO biological process which is colored according to the -log10(p.adjust). |
| Page: 1 2 3 4 5 6 7 8 9 |
| GO ID | Tissue | Disease Stage | Description | Gene Ratio | Bg Ratio | pvalue | p.adjust | Count |
| GO:007265910 | Cervix | CC | protein localization to plasma membrane | 73/2311 | 284/18723 | 4.95e-10 | 6.73e-08 | 73 |
| GO:19907788 | Cervix | CC | protein localization to cell periphery | 78/2311 | 333/18723 | 1.22e-08 | 9.73e-07 | 78 |
| GO:0072659110 | Esophagus | ESCC | protein localization to plasma membrane | 193/8552 | 284/18723 | 1.95e-14 | 1.03e-12 | 193 |
| GO:199077819 | Esophagus | ESCC | protein localization to cell periphery | 217/8552 | 333/18723 | 4.08e-13 | 1.88e-11 | 217 |
| GO:00086544 | Esophagus | ESCC | phospholipid biosynthetic process | 162/8552 | 253/18723 | 2.59e-09 | 5.73e-08 | 162 |
| GO:00464744 | Esophagus | ESCC | glycerophospholipid biosynthetic process | 135/8552 | 211/18723 | 5.75e-08 | 1.02e-06 | 135 |
| GO:00450175 | Esophagus | ESCC | glycerolipid biosynthetic process | 154/8552 | 252/18723 | 5.20e-07 | 6.96e-06 | 154 |
| GO:00066446 | Esophagus | ESCC | phospholipid metabolic process | 218/8552 | 383/18723 | 5.37e-06 | 5.59e-05 | 218 |
| GO:00066505 | Esophagus | ESCC | glycerophospholipid metabolic process | 174/8552 | 306/18723 | 4.92e-05 | 3.85e-04 | 174 |
| GO:00464864 | Esophagus | ESCC | glycerolipid metabolic process | 211/8552 | 392/18723 | 6.51e-04 | 3.46e-03 | 211 |
| GO:00066611 | Esophagus | ESCC | phosphatidylinositol biosynthetic process | 73/8552 | 131/18723 | 1.31e-02 | 4.28e-02 | 73 |
| GO:00464863 | Liver | NAFLD | glycerolipid metabolic process | 66/1882 | 392/18723 | 1.94e-05 | 5.52e-04 | 66 |
| GO:00726597 | Liver | NAFLD | protein localization to plasma membrane | 51/1882 | 284/18723 | 2.97e-05 | 7.83e-04 | 51 |
| GO:19907786 | Liver | NAFLD | protein localization to cell periphery | 56/1882 | 333/18723 | 8.29e-05 | 1.69e-03 | 56 |
| GO:00450174 | Liver | NAFLD | glycerolipid biosynthetic process | 43/1882 | 252/18723 | 3.83e-04 | 5.73e-03 | 43 |
| GO:00464742 | Liver | NAFLD | glycerophospholipid biosynthetic process | 33/1882 | 211/18723 | 6.93e-03 | 4.88e-02 | 33 |
| GO:199077811 | Liver | Cirrhotic | protein localization to cell periphery | 135/4634 | 333/18723 | 1.18e-10 | 6.21e-09 | 135 |
| GO:007265911 | Liver | Cirrhotic | protein localization to plasma membrane | 119/4634 | 284/18723 | 1.30e-10 | 6.80e-09 | 119 |
| GO:007265921 | Liver | HCC | protein localization to plasma membrane | 177/7958 | 284/18723 | 1.02e-11 | 4.18e-10 | 177 |
| GO:199077821 | Liver | HCC | protein localization to cell periphery | 200/7958 | 333/18723 | 6.07e-11 | 2.23e-09 | 200 |
| Page: 1 2 |
| Pathway ID | Tissue | Disease Stage | Description | Gene Ratio | Bg Ratio | pvalue | p.adjust | qvalue | Count |
| Page: 1 |
Top |
Cell-cell communication analysis |
| Identification of potential cell-cell interactions between two cell types and their ligand-receptor pairs for different disease states |
| Ligand | Receptor | LRpair | Pathway | Tissue | Disease Stage |
| Page: 1 |
Top |
Single-cell gene regulatory network inference analysis |
| Find out the significant the regulons (TFs) and the target genes of each regulon across cell types for different disease states |
| TF | Cell Type | Tissue | Disease Stage | Target Gene | RSS | Regulon Activity |
| ∗The dot plots of a searched regulon are shown for all cell subpopulations in each disease state of each tissue based on the regulon specific score inferred using pySCENIC and by calculating the average expression. |
| Page: 1 |
Top |
Somatic mutation of malignant transformation related genes |
| Annotation of somatic variants for genes involved in malignant transformation |
| Hugo Symbol | Variant Class | Variant Classification | dbSNP RS | HGVSc | HGVSp | HGVSp Short | SWISSPROT | BIOTYPE | SIFT | PolyPhen | Tumor Sample Barcode | Tissue | Histology | Sex | Age | Stage | Therapy Types | Drugs | Outcome |
| FAM126B | SNV | Missense_Mutation | c.878C>G | p.Ser293Cys | p.S293C | Q8IXS8 | protein_coding | deleterious(0.02) | possibly_damaging(0.454) | TCGA-E2-A1LH-01 | Breast | breast invasive carcinoma | Female | <65 | I/II | Chemotherapy | adriamycin | SD | |
| FAM126B | SNV | Missense_Mutation | novel | c.13N>A | p.Asp5Asn | p.D5N | Q8IXS8 | protein_coding | deleterious(0) | benign(0.007) | TCGA-PE-A5DE-01 | Breast | breast invasive carcinoma | Female | <65 | I/II | Chemotherapy | taxotere | CR |
| FAM126B | SNV | Missense_Mutation | c.1566C>G | p.Phe522Leu | p.F522L | Q8IXS8 | protein_coding | tolerated(0.23) | probably_damaging(0.931) | TCGA-EA-A78R-01 | Cervix | cervical & endocervical cancer | Female | <65 | I/II | Unknown | Unknown | SD | |
| FAM126B | SNV | Missense_Mutation | c.1172C>T | p.Ser391Phe | p.S391F | Q8IXS8 | protein_coding | deleterious(0.03) | benign(0.135) | TCGA-EK-A2R7-01 | Cervix | cervical & endocervical cancer | Female | <65 | I/II | Unknown | Unknown | SD | |
| FAM126B | SNV | Missense_Mutation | novel | c.781G>A | p.Asp261Asn | p.D261N | Q8IXS8 | protein_coding | deleterious(0) | benign(0.231) | TCGA-VS-A9UD-01 | Cervix | cervical & endocervical cancer | Female | >=65 | III/IV | Chemotherapy | cisplatin | CR |
| FAM126B | SNV | Missense_Mutation | c.1264N>G | p.Leu422Val | p.L422V | Q8IXS8 | protein_coding | deleterious(0.04) | benign(0.096) | TCGA-3L-AA1B-01 | Colorectum | colon adenocarcinoma | Female | <65 | I/II | Unknown | Unknown | SD | |
| FAM126B | SNV | Missense_Mutation | rs765005916 | c.98N>A | p.Arg33Gln | p.R33Q | Q8IXS8 | protein_coding | tolerated(0.44) | benign(0.027) | TCGA-5M-AAT6-01 | Colorectum | colon adenocarcinoma | Female | <65 | III/IV | Unknown | Unknown | PD |
| FAM126B | SNV | Missense_Mutation | c.914N>C | p.Val305Ala | p.V305A | Q8IXS8 | protein_coding | deleterious(0.05) | probably_damaging(0.983) | TCGA-A6-6653-01 | Colorectum | colon adenocarcinoma | Male | >=65 | I/II | Unknown | Unknown | SD | |
| FAM126B | SNV | Missense_Mutation | novel | c.778N>A | p.Leu260Ile | p.L260I | Q8IXS8 | protein_coding | deleterious(0.03) | probably_damaging(0.953) | TCGA-AG-A002-01 | Colorectum | rectum adenocarcinoma | Male | <65 | I/II | Unknown | Unknown | SD |
| FAM126B | SNV | Missense_Mutation | rs536447606 | c.1144C>T | p.Arg382Cys | p.R382C | Q8IXS8 | protein_coding | deleterious(0.01) | probably_damaging(0.99) | TCGA-EI-6884-01 | Colorectum | rectum adenocarcinoma | Male | >=65 | III/IV | Chemotherapy | 5 | SD |
| Page: 1 2 3 4 5 |
Top |
Related drugs of malignant transformation related genes |
| Identification of chemicals and drugs interact with genes involved in malignant transfromation |
| (DGIdb 4.0) |
| Entrez ID | Symbol | Category | Interaction Types | Drug Claim Name | Drug Name | PMIDs |
| Page: 1 |

Copyright 2023-Present -The University of Texas Health Science Center at Houston |