
|
|||||
|
 | |
| |
| |
| |
| |
| |
|
Gene: FAM126A |
Gene summary for FAM126A |
| Gene information | Species | Human | Gene symbol | FAM126A | Gene ID | 84668 |
| Gene name | family with sequence similarity 126 member A | |
| Gene Alias | DRCTNNB1A | |
| Cytomap | 7p15.3 | |
| Gene Type | protein-coding | GO ID | GO:0006629 | UniProtAcc | Q9BYI3 |
Top |
Malignant transformation analysis |
| Identification of the aberrant gene expression in precancerous and cancerous lesions by comparing the gene expression of stem-like cells in diseased tissues with normal stem cells |
| Entrez ID | Symbol | Replicates | Species | Organ | Tissue | Adj P-value | Log2FC | Malignancy |
| 84668 | FAM126A | LZE2T | Human | Esophagus | ESCC | 4.26e-02 | 4.86e-01 | 0.082 |
| 84668 | FAM126A | LZE4T | Human | Esophagus | ESCC | 4.60e-16 | 5.47e-01 | 0.0811 |
| 84668 | FAM126A | LZE7T | Human | Esophagus | ESCC | 2.05e-04 | 3.70e-01 | 0.0667 |
| 84668 | FAM126A | LZE8T | Human | Esophagus | ESCC | 4.09e-04 | 9.14e-02 | 0.067 |
| 84668 | FAM126A | LZE24T | Human | Esophagus | ESCC | 4.59e-06 | 1.63e-01 | 0.0596 |
| 84668 | FAM126A | LZE6T | Human | Esophagus | ESCC | 9.71e-04 | 2.79e-01 | 0.0845 |
| 84668 | FAM126A | P1T-E | Human | Esophagus | ESCC | 8.73e-05 | 1.65e-01 | 0.0875 |
| 84668 | FAM126A | P2T-E | Human | Esophagus | ESCC | 2.51e-08 | 1.72e-01 | 0.1177 |
| 84668 | FAM126A | P4T-E | Human | Esophagus | ESCC | 3.77e-19 | 4.48e-01 | 0.1323 |
| 84668 | FAM126A | P5T-E | Human | Esophagus | ESCC | 6.24e-17 | 3.17e-01 | 0.1327 |
| 84668 | FAM126A | P8T-E | Human | Esophagus | ESCC | 1.72e-06 | 9.47e-02 | 0.0889 |
| 84668 | FAM126A | P9T-E | Human | Esophagus | ESCC | 2.43e-10 | 3.71e-01 | 0.1131 |
| 84668 | FAM126A | P10T-E | Human | Esophagus | ESCC | 7.67e-12 | 2.56e-01 | 0.116 |
| 84668 | FAM126A | P11T-E | Human | Esophagus | ESCC | 1.57e-25 | 1.18e+00 | 0.1426 |
| 84668 | FAM126A | P12T-E | Human | Esophagus | ESCC | 1.71e-09 | 1.64e-01 | 0.1122 |
| 84668 | FAM126A | P15T-E | Human | Esophagus | ESCC | 5.39e-22 | 4.94e-01 | 0.1149 |
| 84668 | FAM126A | P16T-E | Human | Esophagus | ESCC | 1.77e-08 | 8.40e-02 | 0.1153 |
| 84668 | FAM126A | P17T-E | Human | Esophagus | ESCC | 9.76e-03 | 1.78e-01 | 0.1278 |
| 84668 | FAM126A | P19T-E | Human | Esophagus | ESCC | 2.67e-12 | 7.37e-01 | 0.1662 |
| 84668 | FAM126A | P20T-E | Human | Esophagus | ESCC | 9.90e-21 | 4.18e-01 | 0.1124 |
| Page: 1 2 3 4 5 |
| Tissue | Expression Dynamics | Abbreviation |
| Esophagus | 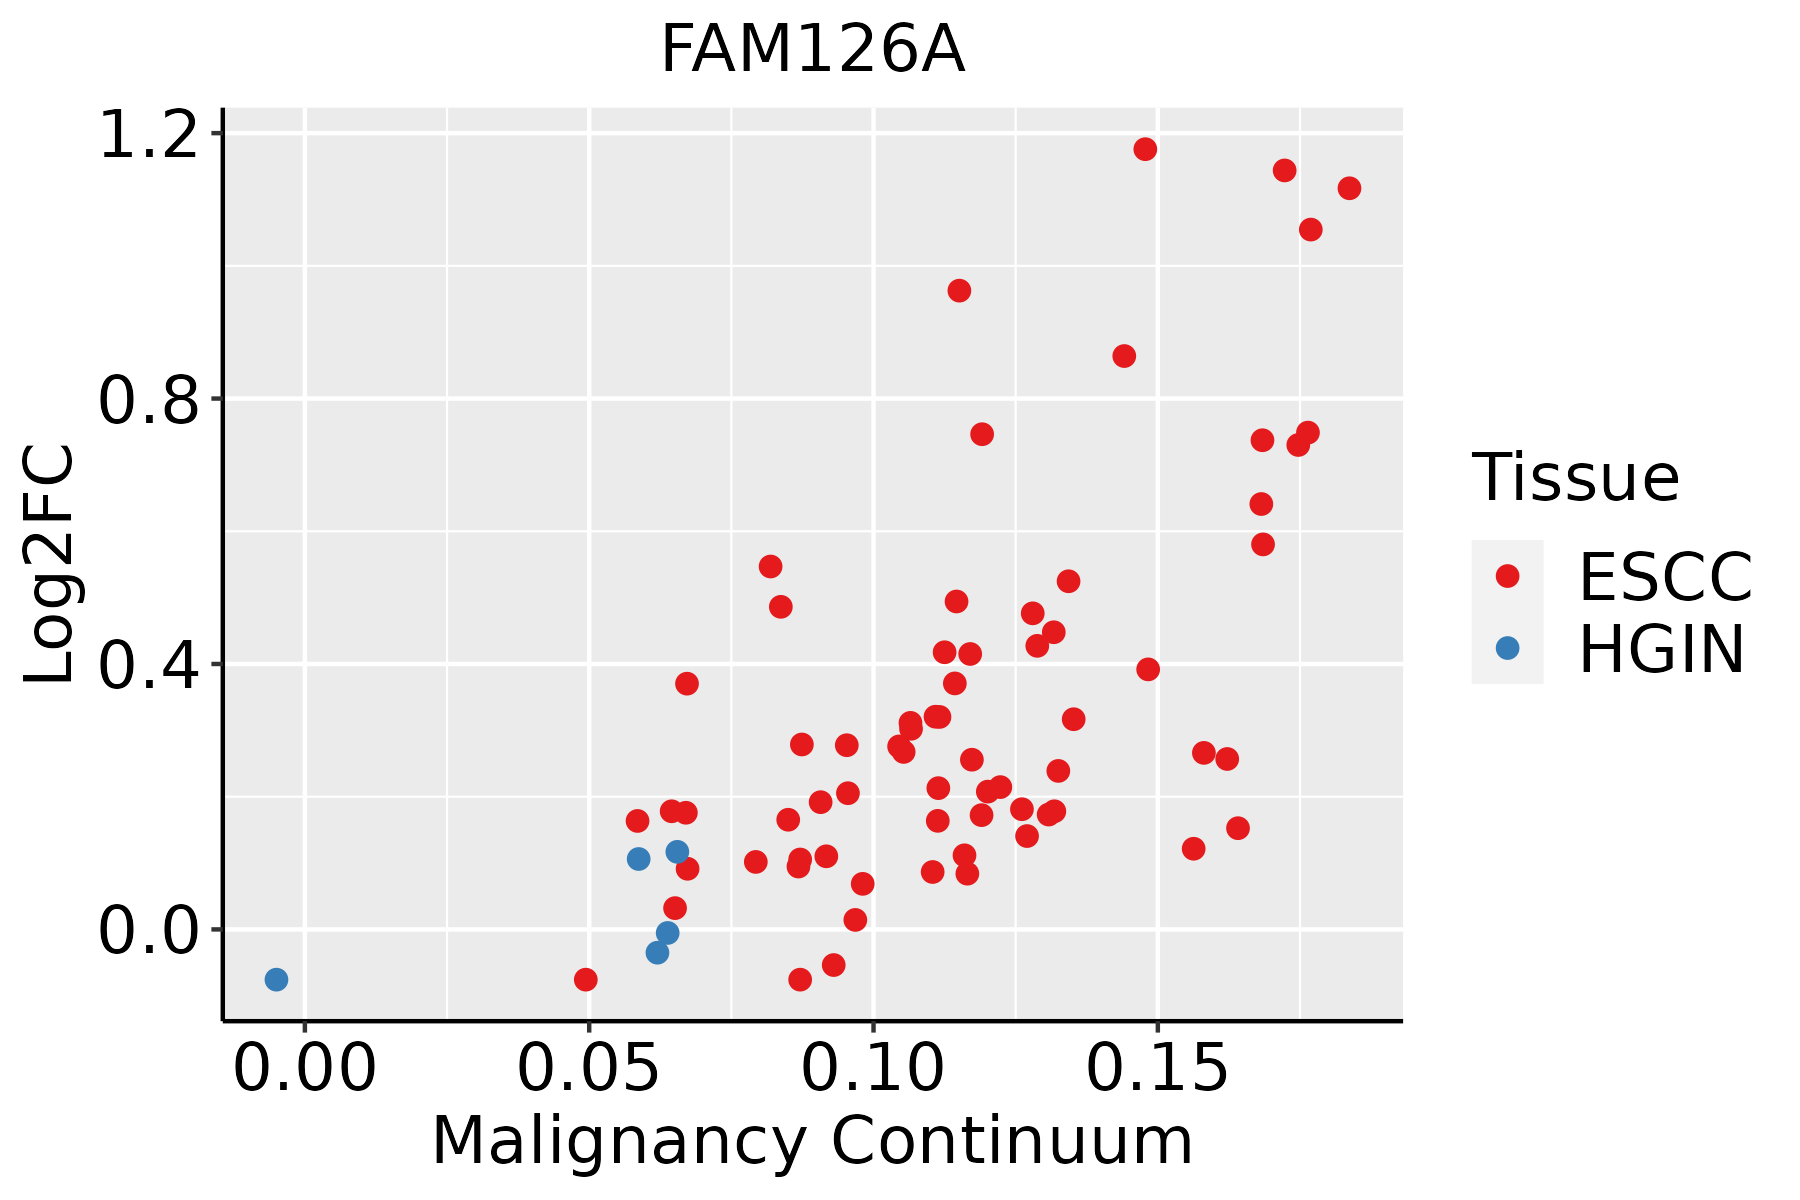 | ESCC: Esophageal squamous cell carcinoma |
| HGIN: High-grade intraepithelial neoplasias | ||
| LGIN: Low-grade intraepithelial neoplasias | ||
| Liver | 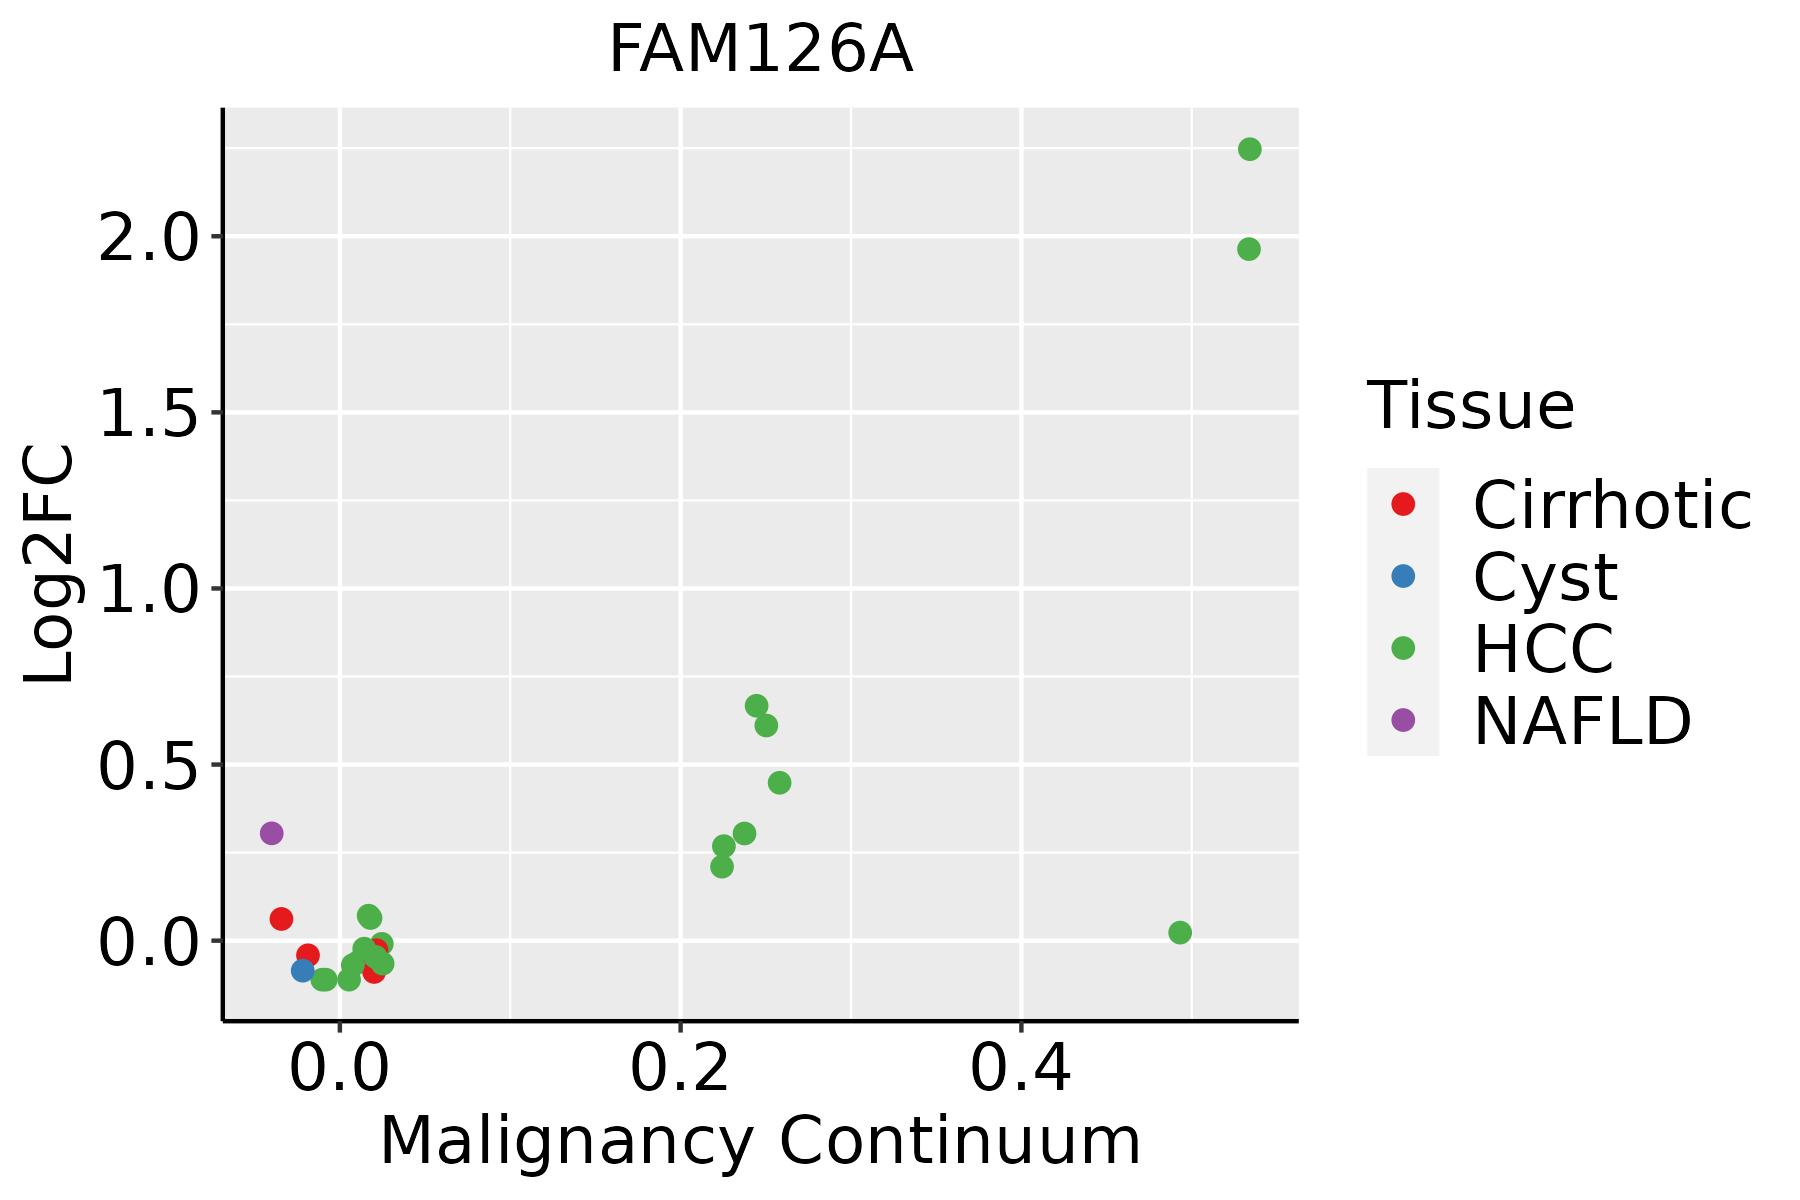 | HCC: Hepatocellular carcinoma |
| NAFLD: Non-alcoholic fatty liver disease | ||
| Oral Cavity |  | EOLP: Erosive Oral lichen planus |
| LP: leukoplakia | ||
| NEOLP: Non-erosive oral lichen planus | ||
| OSCC: Oral squamous cell carcinoma | ||
| Skin | 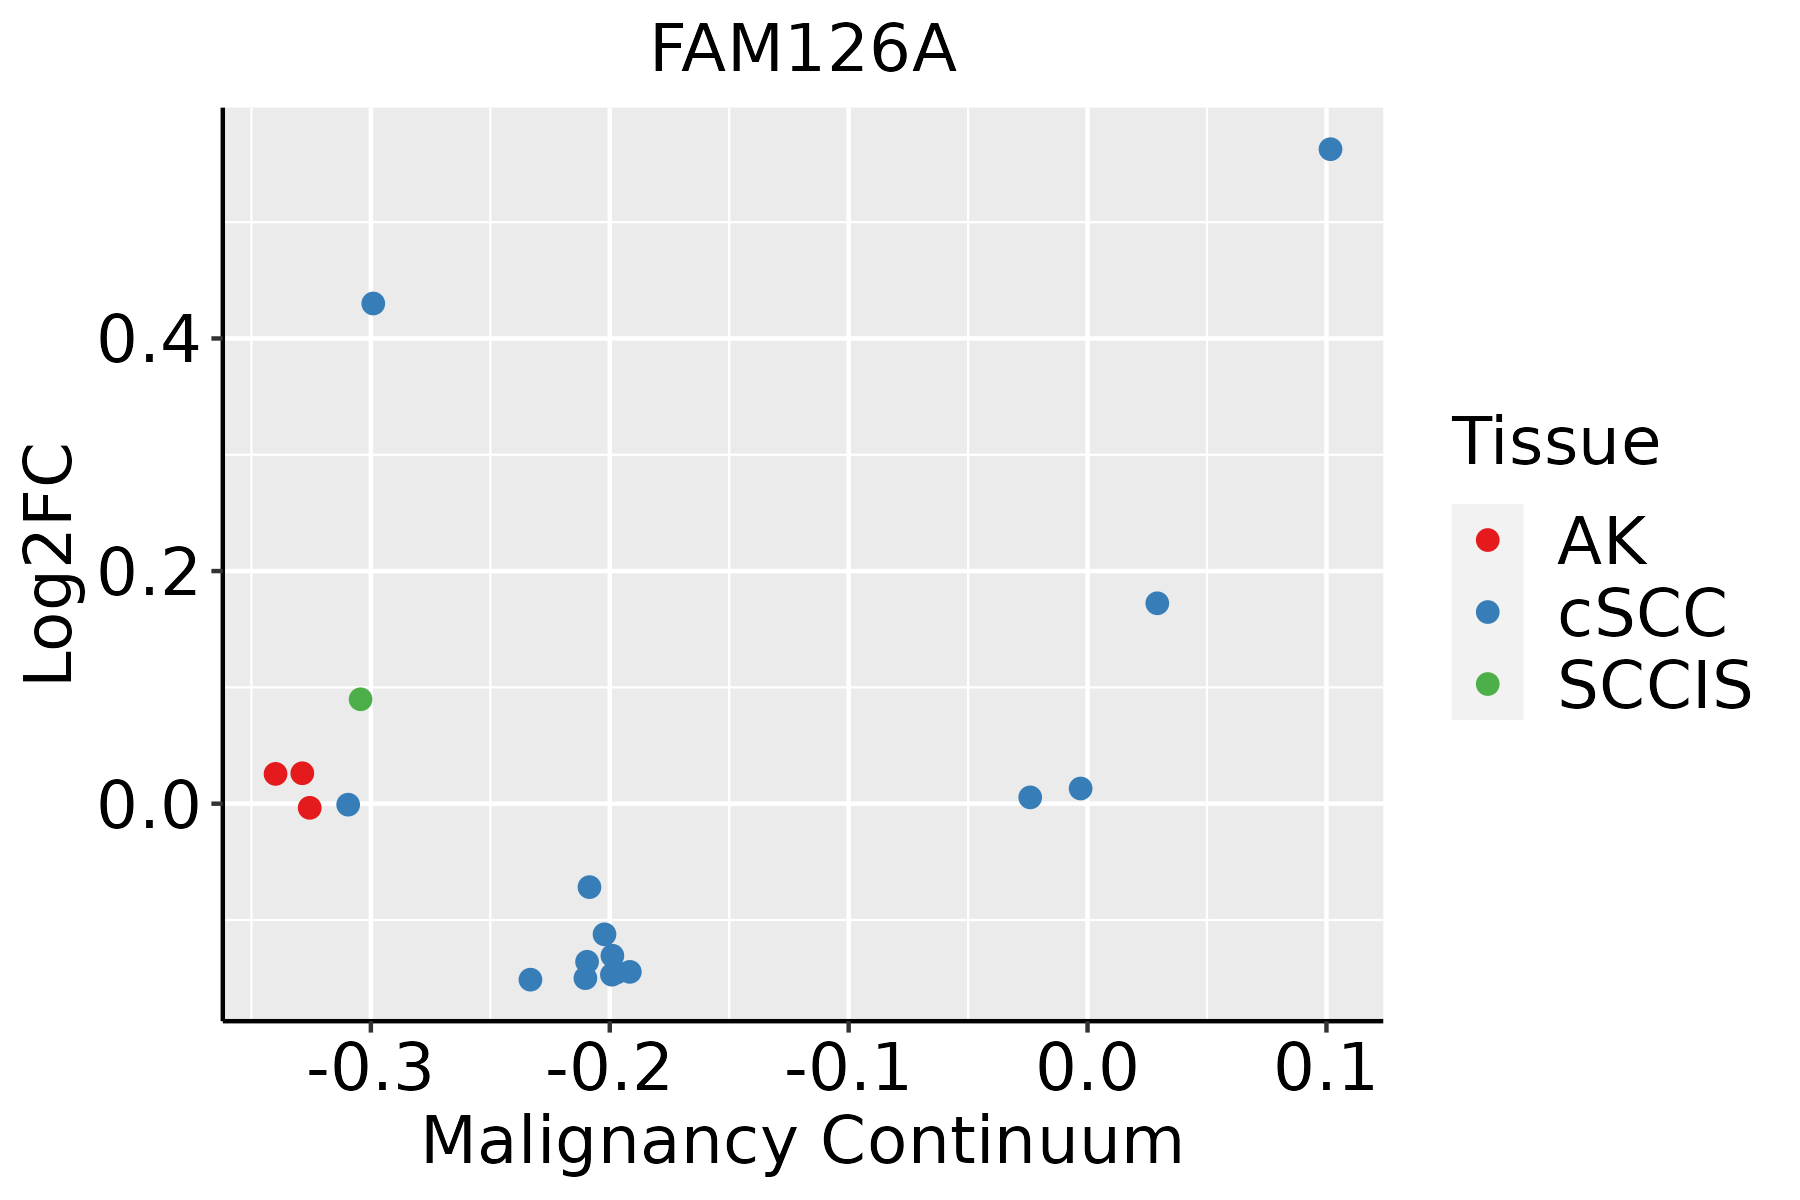 | AK: Actinic keratosis |
| cSCC: Cutaneous squamous cell carcinoma | ||
| SCCIS:squamous cell carcinoma in situ | ||
| Thyroid | 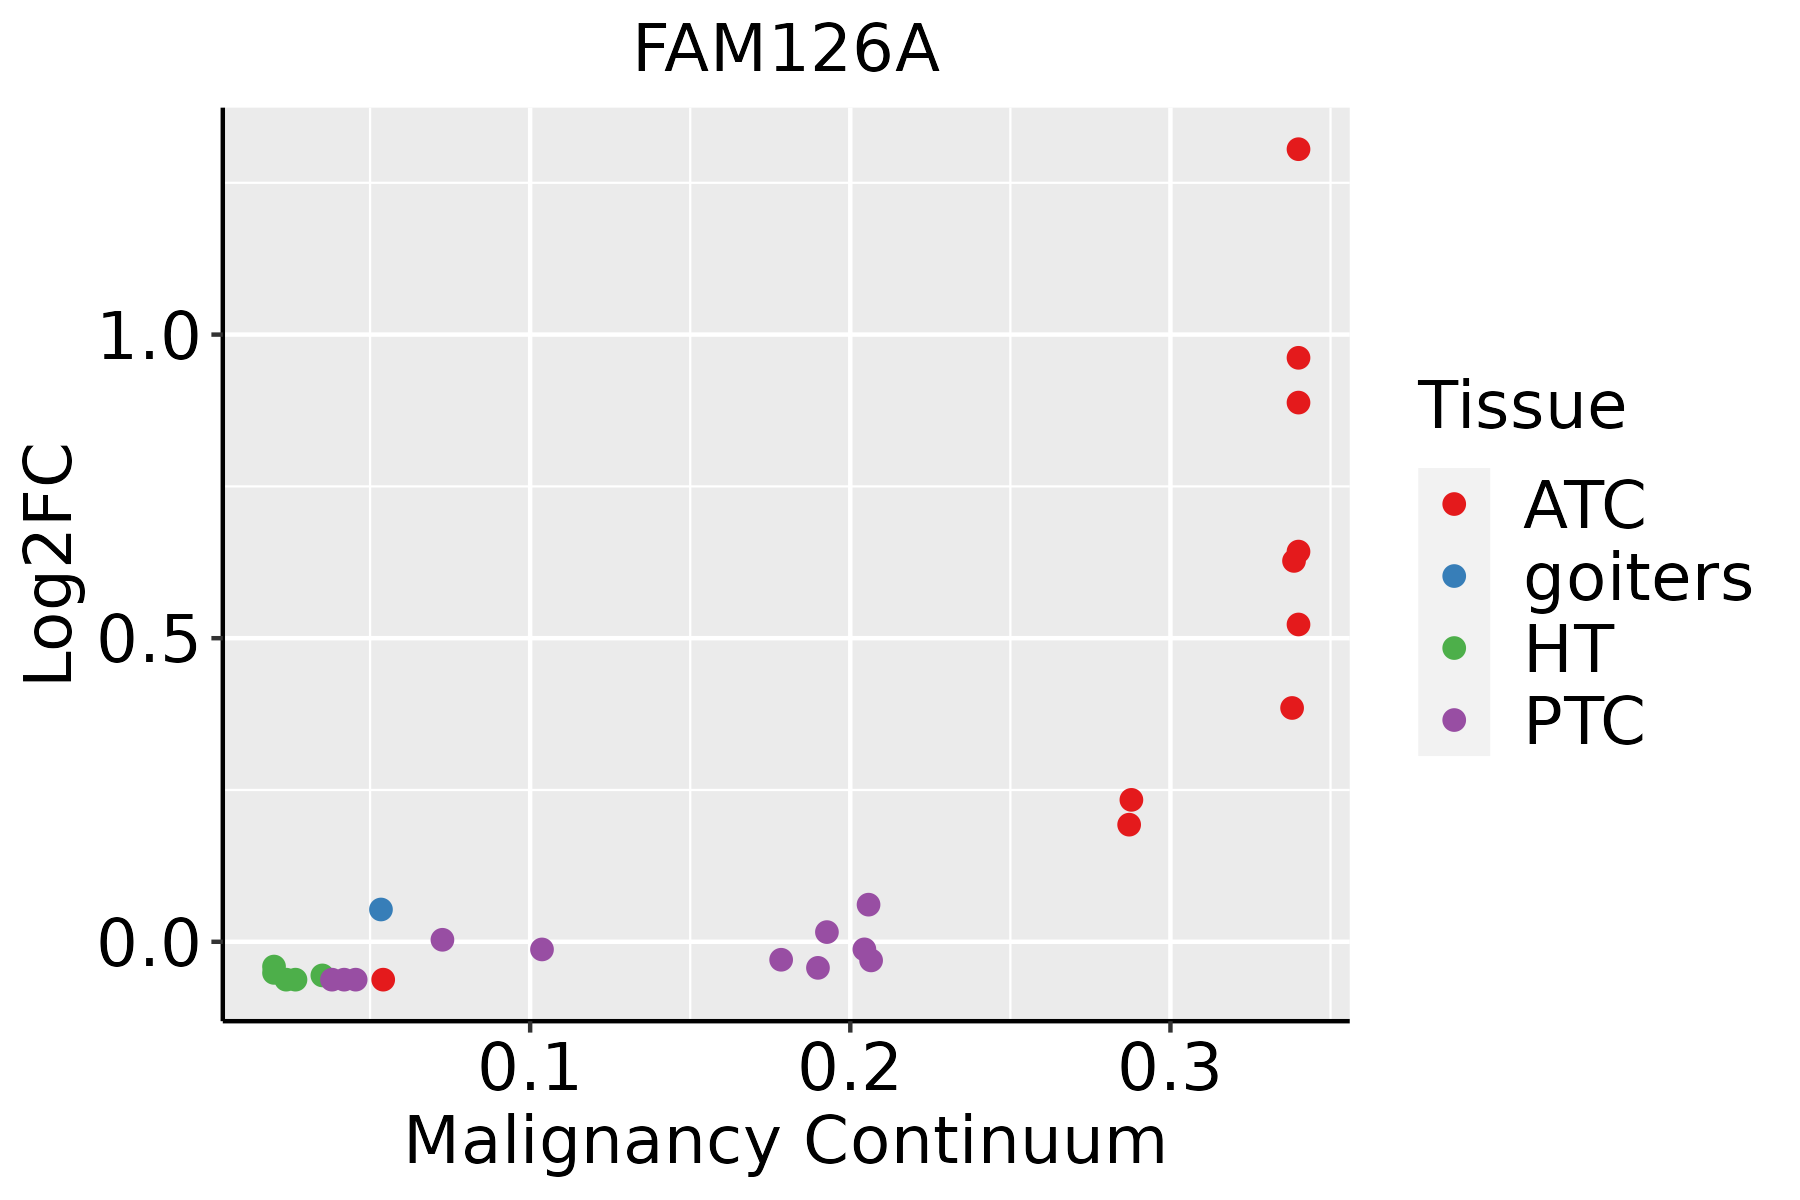 | ATC: Anaplastic thyroid cancer |
| HT: Hashimoto's thyroiditis | ||
| PTC: Papillary thyroid cancer |
| ∗log2FC in expression of this searched gene in stem-like cells from each diseased tissue sample relative to stem-like cells in normal samples in each tissue plotted against the malignancy continuum. Samples are colored based on if they are from different disease stage. |
Top |
Malignant transformation related pathway analysis |
| Find out the enriched GO biological processes and KEGG pathways involved in transition from healthy to precancer to cancer |
| Tissue | Disease Stage | Enriched GO biological Processes |
| Colorectum | AD |  |
| Colorectum | SER |  |
| Colorectum | MSS |  |
| Colorectum | MSI-H |  |
| Colorectum | FAP |  |
| ∗Top 15 enriched GO BP terms are showed in the bar plot of each disease state in each tissue. Each row represents a significant GO biological process which is colored according to the -log10(p.adjust). |
| Page: 1 2 3 4 5 6 7 8 9 |
| GO ID | Tissue | Disease Stage | Description | Gene Ratio | Bg Ratio | pvalue | p.adjust | Count |
| GO:0072659110 | Esophagus | ESCC | protein localization to plasma membrane | 193/8552 | 284/18723 | 1.95e-14 | 1.03e-12 | 193 |
| GO:199077819 | Esophagus | ESCC | protein localization to cell periphery | 217/8552 | 333/18723 | 4.08e-13 | 1.88e-11 | 217 |
| GO:00086544 | Esophagus | ESCC | phospholipid biosynthetic process | 162/8552 | 253/18723 | 2.59e-09 | 5.73e-08 | 162 |
| GO:00464744 | Esophagus | ESCC | glycerophospholipid biosynthetic process | 135/8552 | 211/18723 | 5.75e-08 | 1.02e-06 | 135 |
| GO:00450175 | Esophagus | ESCC | glycerolipid biosynthetic process | 154/8552 | 252/18723 | 5.20e-07 | 6.96e-06 | 154 |
| GO:00066446 | Esophagus | ESCC | phospholipid metabolic process | 218/8552 | 383/18723 | 5.37e-06 | 5.59e-05 | 218 |
| GO:00425524 | Esophagus | ESCC | myelination | 85/8552 | 134/18723 | 2.51e-05 | 2.13e-04 | 85 |
| GO:00072724 | Esophagus | ESCC | ensheathment of neurons | 86/8552 | 136/18723 | 2.68e-05 | 2.24e-04 | 86 |
| GO:00083664 | Esophagus | ESCC | axon ensheathment | 86/8552 | 136/18723 | 2.68e-05 | 2.24e-04 | 86 |
| GO:00066505 | Esophagus | ESCC | glycerophospholipid metabolic process | 174/8552 | 306/18723 | 4.92e-05 | 3.85e-04 | 174 |
| GO:00464864 | Esophagus | ESCC | glycerolipid metabolic process | 211/8552 | 392/18723 | 6.51e-04 | 3.46e-03 | 211 |
| GO:00066611 | Esophagus | ESCC | phosphatidylinositol biosynthetic process | 73/8552 | 131/18723 | 1.31e-02 | 4.28e-02 | 73 |
| GO:007265921 | Liver | HCC | protein localization to plasma membrane | 177/7958 | 284/18723 | 1.02e-11 | 4.18e-10 | 177 |
| GO:199077821 | Liver | HCC | protein localization to cell periphery | 200/7958 | 333/18723 | 6.07e-11 | 2.23e-09 | 200 |
| GO:00086542 | Liver | HCC | phospholipid biosynthetic process | 150/7958 | 253/18723 | 4.77e-08 | 1.03e-06 | 150 |
| GO:00066444 | Liver | HCC | phospholipid metabolic process | 214/7958 | 383/18723 | 7.25e-08 | 1.48e-06 | 214 |
| GO:004648611 | Liver | HCC | glycerolipid metabolic process | 215/7958 | 392/18723 | 4.54e-07 | 7.49e-06 | 215 |
| GO:004501711 | Liver | HCC | glycerolipid biosynthetic process | 143/7958 | 252/18723 | 3.27e-06 | 4.31e-05 | 143 |
| GO:00066504 | Liver | HCC | glycerophospholipid metabolic process | 168/7958 | 306/18723 | 7.27e-06 | 8.62e-05 | 168 |
| GO:004647411 | Liver | HCC | glycerophospholipid biosynthetic process | 121/7958 | 211/18723 | 9.12e-06 | 1.06e-04 | 121 |
| Page: 1 2 3 |
| Pathway ID | Tissue | Disease Stage | Description | Gene Ratio | Bg Ratio | pvalue | p.adjust | qvalue | Count |
| Page: 1 |
Top |
Cell-cell communication analysis |
| Identification of potential cell-cell interactions between two cell types and their ligand-receptor pairs for different disease states |
| Ligand | Receptor | LRpair | Pathway | Tissue | Disease Stage |
| Page: 1 |
Top |
Single-cell gene regulatory network inference analysis |
| Find out the significant the regulons (TFs) and the target genes of each regulon across cell types for different disease states |
| TF | Cell Type | Tissue | Disease Stage | Target Gene | RSS | Regulon Activity |
| ∗The dot plots of a searched regulon are shown for all cell subpopulations in each disease state of each tissue based on the regulon specific score inferred using pySCENIC and by calculating the average expression. |
| Page: 1 |
Top |
Somatic mutation of malignant transformation related genes |
| Annotation of somatic variants for genes involved in malignant transformation |
| Hugo Symbol | Variant Class | Variant Classification | dbSNP RS | HGVSc | HGVSp | HGVSp Short | SWISSPROT | BIOTYPE | SIFT | PolyPhen | Tumor Sample Barcode | Tissue | Histology | Sex | Age | Stage | Therapy Types | Drugs | Outcome |
| FAM126A | SNV | Missense_Mutation | rs775750049 | c.1075N>C | p.Thr359Pro | p.T359P | Q9BYI3 | protein_coding | tolerated(0.06) | benign(0.221) | TCGA-A2-A1G4-01 | Breast | breast invasive carcinoma | Female | >=65 | III/IV | Chemotherapy | adriamycin | SD |
| FAM126A | SNV | Missense_Mutation | novel | c.1400C>T | p.Ser467Leu | p.S467L | Q9BYI3 | protein_coding | tolerated(0.16) | benign(0.027) | TCGA-C8-A8HQ-01 | Breast | breast invasive carcinoma | Female | <65 | I/II | Unknown | Unknown | SD |
| FAM126A | SNV | Missense_Mutation | novel | c.1133N>A | p.Gly378Glu | p.G378E | Q9BYI3 | protein_coding | deleterious(0.03) | probably_damaging(0.916) | TCGA-AA-3855-01 | Colorectum | colon adenocarcinoma | Male | >=65 | I/II | Unknown | Unknown | SD |
| FAM126A | SNV | Missense_Mutation | novel | c.290G>A | p.Ser97Asn | p.S97N | Q9BYI3 | protein_coding | tolerated(0.06) | possibly_damaging(0.783) | TCGA-AA-3947-01 | Colorectum | colon adenocarcinoma | Female | <65 | I/II | Unknown | Unknown | SD |
| FAM126A | SNV | Missense_Mutation | c.78N>G | p.Asn26Lys | p.N26K | Q9BYI3 | protein_coding | deleterious(0.03) | benign(0.138) | TCGA-AA-A010-01 | Colorectum | colon adenocarcinoma | Female | <65 | I/II | Chemotherapy | folinic | CR | |
| FAM126A | SNV | Missense_Mutation | rs148168726 | c.932N>A | p.Arg311Gln | p.R311Q | Q9BYI3 | protein_coding | deleterious(0.01) | possibly_damaging(0.832) | TCGA-CA-6718-01 | Colorectum | colon adenocarcinoma | Male | <65 | I/II | Unknown | Unknown | PD |
| FAM126A | SNV | Missense_Mutation | c.88N>C | p.Asn30His | p.N30H | Q9BYI3 | protein_coding | deleterious(0.02) | possibly_damaging(0.694) | TCGA-CA-6718-01 | Colorectum | colon adenocarcinoma | Male | <65 | I/II | Unknown | Unknown | PD | |
| FAM126A | SNV | Missense_Mutation | c.688A>T | p.Ile230Leu | p.I230L | Q9BYI3 | protein_coding | tolerated(0.37) | benign(0) | TCGA-CM-5861-01 | Colorectum | colon adenocarcinoma | Female | <65 | I/II | Unknown | Unknown | PD | |
| FAM126A | SNV | Missense_Mutation | c.896N>T | p.Arg299Met | p.R299M | Q9BYI3 | protein_coding | tolerated(0.13) | probably_damaging(0.947) | TCGA-CM-6171-01 | Colorectum | colon adenocarcinoma | Female | >=65 | I/II | Unknown | Unknown | SD | |
| FAM126A | SNV | Missense_Mutation | rs777996428 | c.1340C>T | p.Ala447Val | p.A447V | Q9BYI3 | protein_coding | deleterious(0.01) | benign(0.028) | TCGA-D5-6930-01 | Colorectum | colon adenocarcinoma | Male | >=65 | I/II | Unknown | Unknown | SD |
| Page: 1 2 3 4 5 |
Top |
Related drugs of malignant transformation related genes |
| Identification of chemicals and drugs interact with genes involved in malignant transfromation |
| (DGIdb 4.0) |
| Entrez ID | Symbol | Category | Interaction Types | Drug Claim Name | Drug Name | PMIDs |
| Page: 1 |

Copyright 2023-Present -The University of Texas Health Science Center at Houston |