
|
|||||
|
 | |
| |
| |
| |
| |
| |
|
Gene: FAM120AOS |
Gene summary for FAM120AOS |
| Gene information | Species | Human | Gene symbol | FAM120AOS | Gene ID | 158293 |
| Gene name | family with sequence similarity 120A opposite strand | |
| Gene Alias | C9orf10OS | |
| Cytomap | 9q22.31 | |
| Gene Type | protein-coding | GO ID | GO:0003674 | UniProtAcc | E9PCY8 |
Top |
Malignant transformation analysis |
| Identification of the aberrant gene expression in precancerous and cancerous lesions by comparing the gene expression of stem-like cells in diseased tissues with normal stem cells |
| Entrez ID | Symbol | Replicates | Species | Organ | Tissue | Adj P-value | Log2FC | Malignancy |
| 158293 | FAM120AOS | HTA11_347_2000001011 | Human | Colorectum | AD | 8.73e-09 | 3.73e-01 | -0.1954 |
| 158293 | FAM120AOS | A002-C-205 | Human | Colorectum | FAP | 1.35e-02 | -1.52e-01 | -0.1236 |
| 158293 | FAM120AOS | A015-C-006 | Human | Colorectum | FAP | 2.92e-02 | -1.67e-01 | -0.0994 |
| 158293 | FAM120AOS | A015-C-104 | Human | Colorectum | FAP | 8.58e-03 | -1.53e-01 | -0.1899 |
| 158293 | FAM120AOS | A002-C-116 | Human | Colorectum | FAP | 7.66e-03 | -1.38e-01 | -0.0452 |
| 158293 | FAM120AOS | LZE2T | Human | Esophagus | ESCC | 8.19e-04 | 4.69e-01 | 0.082 |
| 158293 | FAM120AOS | LZE4T | Human | Esophagus | ESCC | 4.10e-15 | 4.22e-01 | 0.0811 |
| 158293 | FAM120AOS | LZE5T | Human | Esophagus | ESCC | 2.77e-08 | 4.22e-01 | 0.0514 |
| 158293 | FAM120AOS | LZE7T | Human | Esophagus | ESCC | 4.55e-04 | 3.22e-01 | 0.0667 |
| 158293 | FAM120AOS | LZE8T | Human | Esophagus | ESCC | 4.18e-04 | 2.14e-01 | 0.067 |
| 158293 | FAM120AOS | LZE22T | Human | Esophagus | ESCC | 4.65e-04 | 3.22e-01 | 0.068 |
| 158293 | FAM120AOS | LZE24T | Human | Esophagus | ESCC | 2.77e-32 | 9.57e-01 | 0.0596 |
| 158293 | FAM120AOS | LZE21T | Human | Esophagus | ESCC | 1.28e-06 | 5.82e-01 | 0.0655 |
| 158293 | FAM120AOS | LZE6T | Human | Esophagus | ESCC | 7.83e-06 | 3.45e-01 | 0.0845 |
| 158293 | FAM120AOS | P1T-E | Human | Esophagus | ESCC | 1.23e-09 | 5.35e-01 | 0.0875 |
| 158293 | FAM120AOS | P2T-E | Human | Esophagus | ESCC | 1.09e-42 | 9.10e-01 | 0.1177 |
| 158293 | FAM120AOS | P4T-E | Human | Esophagus | ESCC | 8.95e-30 | 6.75e-01 | 0.1323 |
| 158293 | FAM120AOS | P5T-E | Human | Esophagus | ESCC | 1.88e-12 | 2.61e-01 | 0.1327 |
| 158293 | FAM120AOS | P8T-E | Human | Esophagus | ESCC | 6.39e-23 | 3.68e-01 | 0.0889 |
| 158293 | FAM120AOS | P9T-E | Human | Esophagus | ESCC | 3.83e-18 | 4.34e-01 | 0.1131 |
| Page: 1 2 3 4 5 6 |
| Tissue | Expression Dynamics | Abbreviation |
| Colorectum (GSE201348) |  | FAP: Familial adenomatous polyposis |
| CRC: Colorectal cancer | ||
| Colorectum (HTA11) |  | AD: Adenomas |
| SER: Sessile serrated lesions | ||
| MSI-H: Microsatellite-high colorectal cancer | ||
| MSS: Microsatellite stable colorectal cancer | ||
| Esophagus | 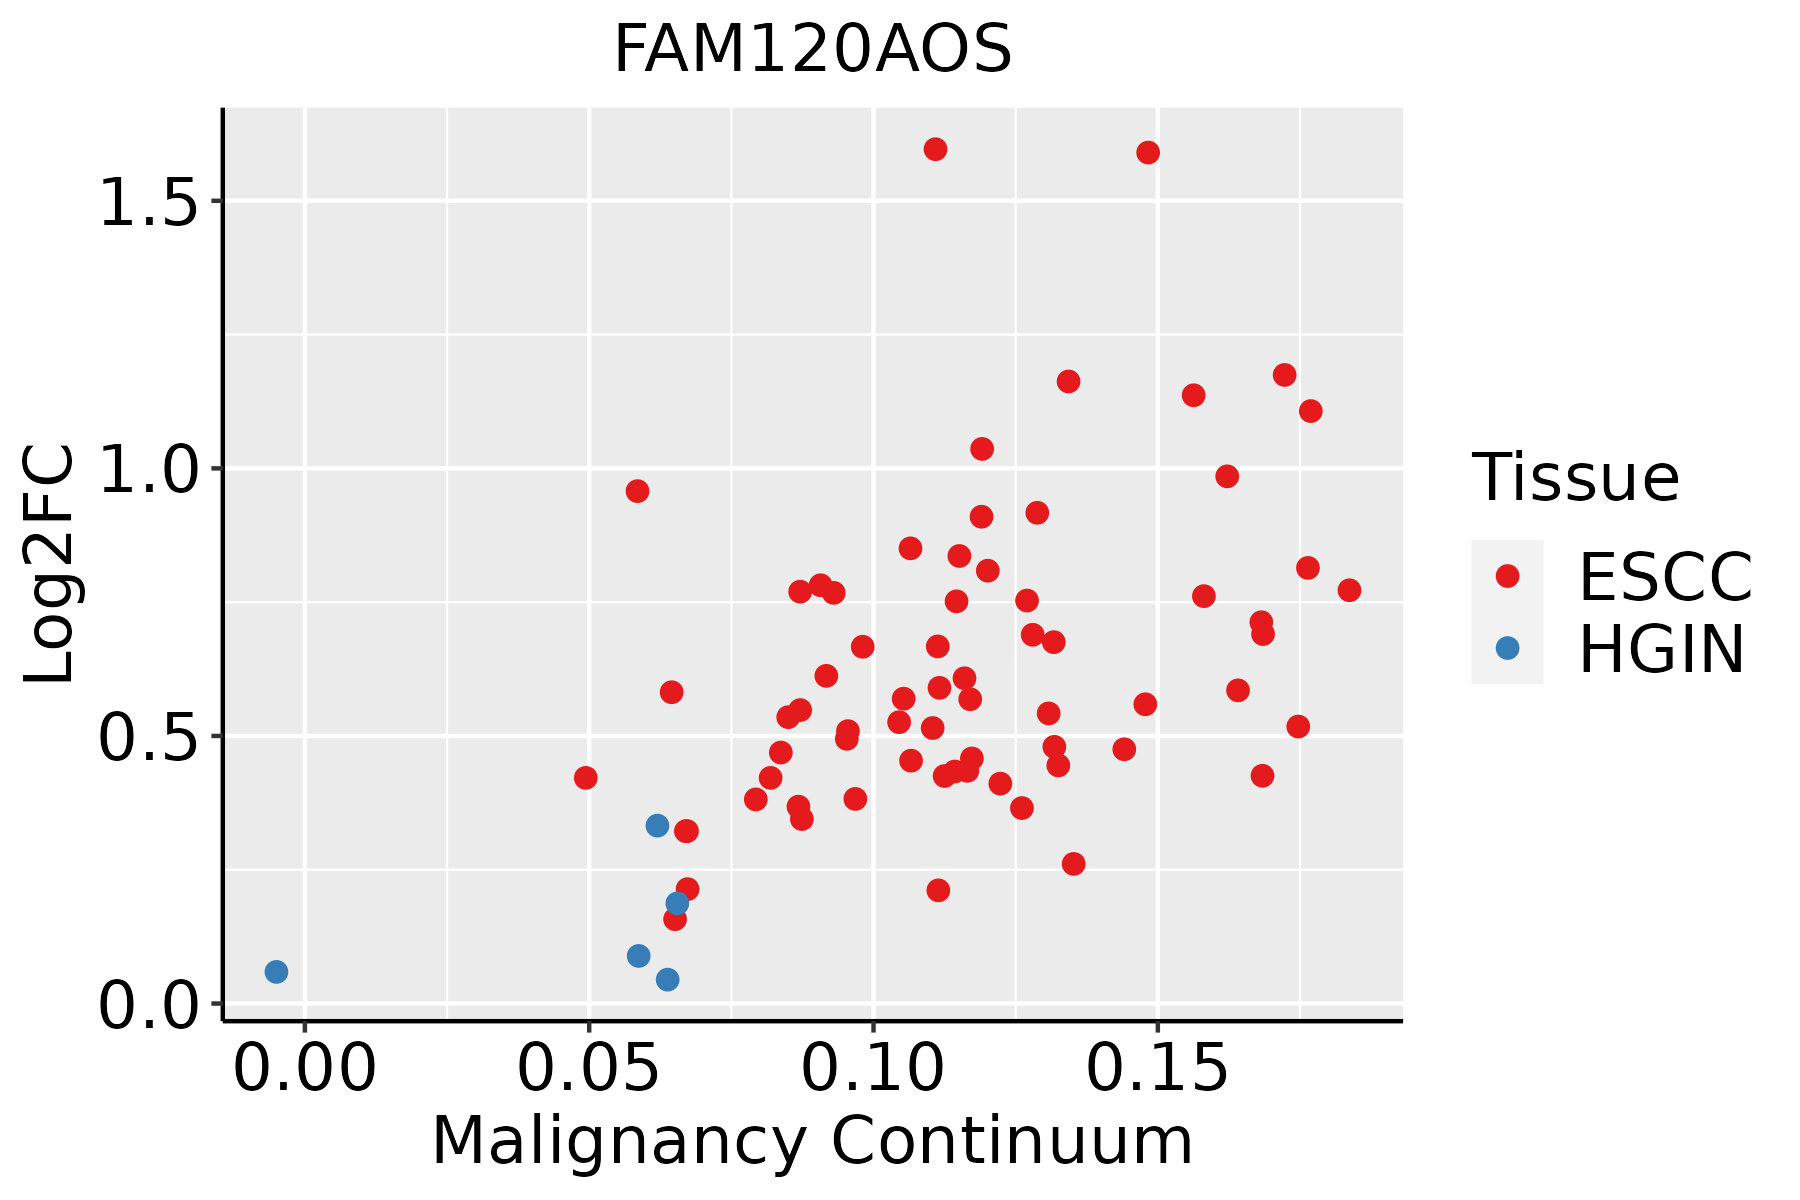 | ESCC: Esophageal squamous cell carcinoma |
| HGIN: High-grade intraepithelial neoplasias | ||
| LGIN: Low-grade intraepithelial neoplasias | ||
| Liver |  | HCC: Hepatocellular carcinoma |
| NAFLD: Non-alcoholic fatty liver disease | ||
| Oral Cavity |  | EOLP: Erosive Oral lichen planus |
| LP: leukoplakia | ||
| NEOLP: Non-erosive oral lichen planus | ||
| OSCC: Oral squamous cell carcinoma | ||
| Prostate | 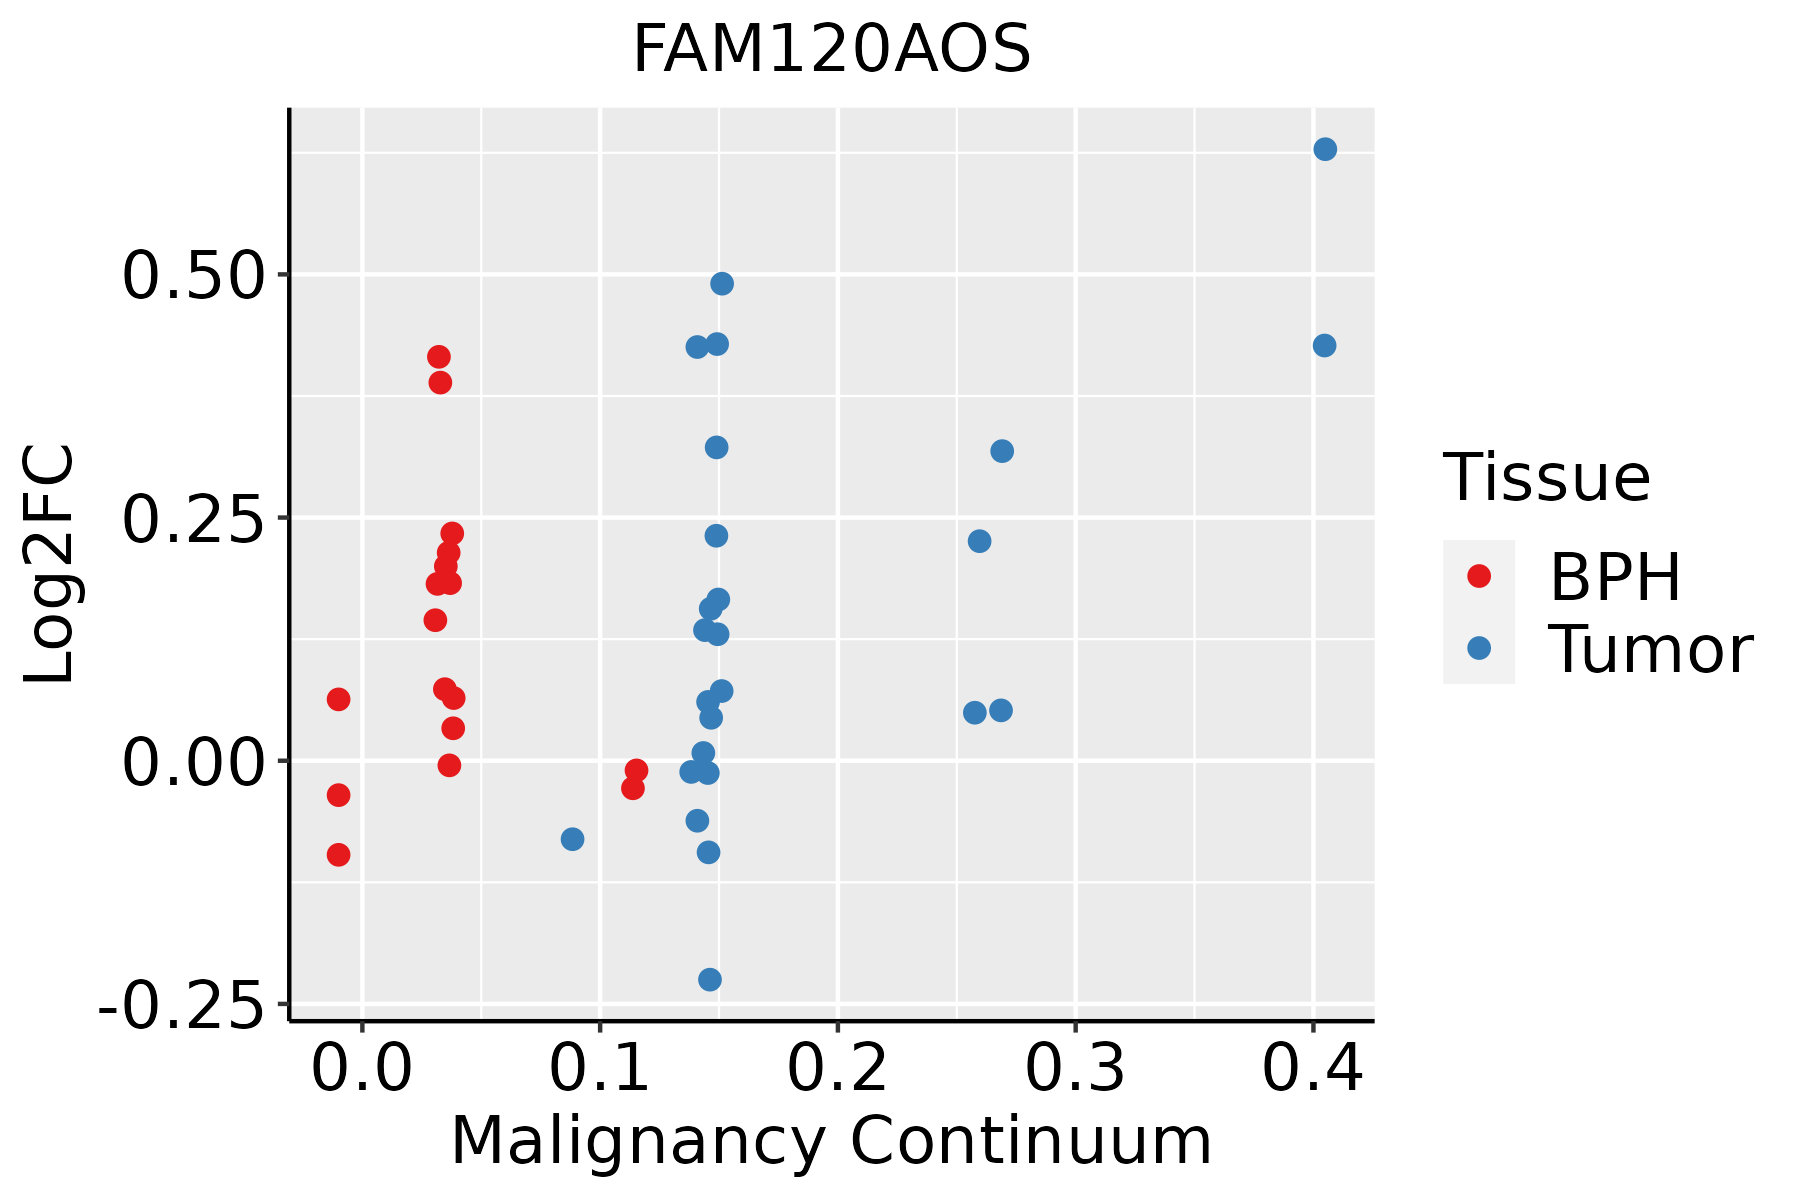 | BPH: Benign Prostatic Hyperplasia |
| Skin |  | AK: Actinic keratosis |
| cSCC: Cutaneous squamous cell carcinoma | ||
| SCCIS:squamous cell carcinoma in situ | ||
| Thyroid | 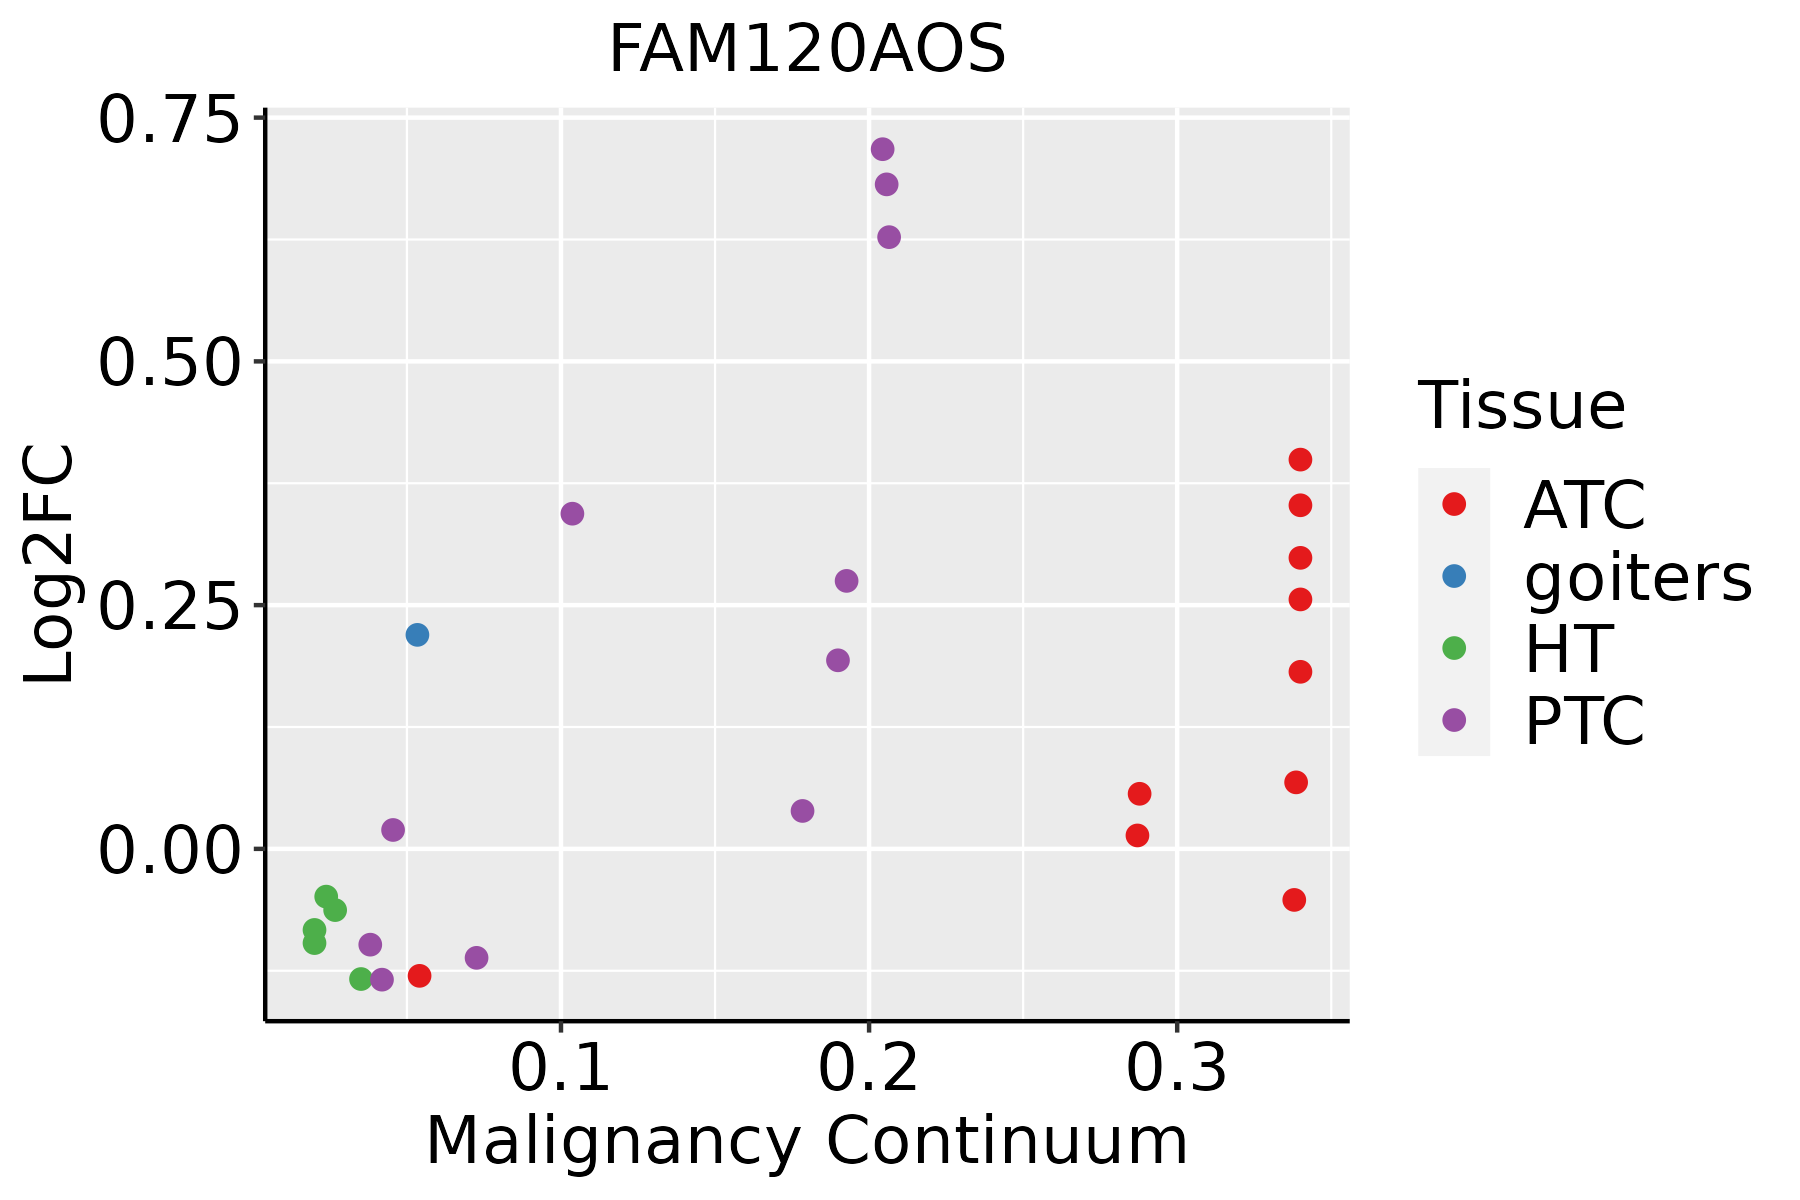 | ATC: Anaplastic thyroid cancer |
| HT: Hashimoto's thyroiditis | ||
| PTC: Papillary thyroid cancer |
| ∗log2FC in expression of this searched gene in stem-like cells from each diseased tissue sample relative to stem-like cells in normal samples in each tissue plotted against the malignancy continuum. Samples are colored based on if they are from different disease stage. |
Top |
Malignant transformation related pathway analysis |
| Find out the enriched GO biological processes and KEGG pathways involved in transition from healthy to precancer to cancer |
| Tissue | Disease Stage | Enriched GO biological Processes |
| Colorectum | AD |  |
| Colorectum | SER |  |
| Colorectum | MSS |  |
| Colorectum | MSI-H |  |
| Colorectum | FAP |  |
| ∗Top 15 enriched GO BP terms are showed in the bar plot of each disease state in each tissue. Each row represents a significant GO biological process which is colored according to the -log10(p.adjust). |
| Page: 1 2 3 4 5 6 7 8 9 |
| GO ID | Tissue | Disease Stage | Description | Gene Ratio | Bg Ratio | pvalue | p.adjust | Count |
| Page: 1 |
| Pathway ID | Tissue | Disease Stage | Description | Gene Ratio | Bg Ratio | pvalue | p.adjust | qvalue | Count |
| Page: 1 |
Top |
Cell-cell communication analysis |
| Identification of potential cell-cell interactions between two cell types and their ligand-receptor pairs for different disease states |
| Ligand | Receptor | LRpair | Pathway | Tissue | Disease Stage |
| Page: 1 |
Top |
Single-cell gene regulatory network inference analysis |
| Find out the significant the regulons (TFs) and the target genes of each regulon across cell types for different disease states |
| TF | Cell Type | Tissue | Disease Stage | Target Gene | RSS | Regulon Activity |
| ∗The dot plots of a searched regulon are shown for all cell subpopulations in each disease state of each tissue based on the regulon specific score inferred using pySCENIC and by calculating the average expression. |
| Page: 1 |
Top |
Somatic mutation of malignant transformation related genes |
| Annotation of somatic variants for genes involved in malignant transformation |
| Hugo Symbol | Variant Class | Variant Classification | dbSNP RS | HGVSc | HGVSp | HGVSp Short | SWISSPROT | BIOTYPE | SIFT | PolyPhen | Tumor Sample Barcode | Tissue | Histology | Sex | Age | Stage | Therapy Types | Drugs | Outcome |
| FAM120AOS | SNV | Missense_Mutation | novel | c.608N>T | p.Gly203Val | p.G203V | Q5T036 | protein_coding | tolerated_low_confidence(0.34) | benign(0.007) | TCGA-EA-A3HU-01 | Cervix | cervical & endocervical cancer | Female | <65 | I/II | Unknown | Unknown | SD |
| FAM120AOS | SNV | Missense_Mutation | novel | c.640G>A | p.Ala214Thr | p.A214T | Q5T036 | protein_coding | deleterious_low_confidence(0.05) | benign(0.001) | TCGA-AA-3845-01 | Colorectum | colon adenocarcinoma | Female | >=65 | I/II | Unknown | Unknown | PD |
| FAM120AOS | SNV | Missense_Mutation | novel | c.728N>A | p.Thr243Asn | p.T243N | Q5T036 | protein_coding | deleterious_low_confidence(0) | benign(0) | TCGA-AJ-A3EK-01 | Endometrium | uterine corpus endometrioid carcinoma | Female | <65 | I/II | Chemotherapy | carboplatin | CR |
| FAM120AOS | SNV | Missense_Mutation | c.736N>T | p.Pro246Ser | p.P246S | Q5T036 | protein_coding | deleterious_low_confidence(0) | benign(0.02) | TCGA-AP-A0LM-01 | Endometrium | uterine corpus endometrioid carcinoma | Female | <65 | III/IV | Chemotherapy | cisplatin | SD | |
| FAM120AOS | SNV | Missense_Mutation | c.311N>A | p.Pro104His | p.P104H | Q5T036 | protein_coding | deleterious_low_confidence(0.01) | benign(0.11) | TCGA-55-5899-01 | Lung | lung adenocarcinoma | Male | <65 | I/II | Chemotherapy | carboplatin | CR | |
| FAM120AOS | SNV | Missense_Mutation | novel | c.597G>T | p.Gln199His | p.Q199H | Q5T036 | protein_coding | deleterious_low_confidence(0) | benign(0.146) | TCGA-55-A4DG-01 | Lung | lung adenocarcinoma | Male | >=65 | I/II | Unknown | Unknown | SD |
| FAM120AOS | SNV | Missense_Mutation | novel | c.387N>C | p.Gln129His | p.Q129H | Q5T036 | protein_coding | deleterious_low_confidence(0) | possibly_damaging(0.522) | TCGA-CQ-6219-01 | Oral cavity | head & neck squamous cell carcinoma | Female | <65 | I/II | Unknown | Unknown | PD |
| FAM120AOS | SNV | Missense_Mutation | novel | c.83T>C | p.Val28Ala | p.V28A | Q5T036 | protein_coding | deleterious_low_confidence(0) | benign(0.235) | TCGA-XK-AAIW-01 | Prostate | prostate adenocarcinoma | Male | >=65 | 9 | Unknown | Unknown | PD |
| Page: 1 |
Top |
Related drugs of malignant transformation related genes |
| Identification of chemicals and drugs interact with genes involved in malignant transfromation |
| (DGIdb 4.0) |
| Entrez ID | Symbol | Category | Interaction Types | Drug Claim Name | Drug Name | PMIDs |
| Page: 1 |

Copyright 2023-Present -The University of Texas Health Science Center at Houston |