
|
|||||
|
 | |
| |
| |
| |
| |
| |
|
Gene: FAM118B |
Gene summary for FAM118B |
| Gene information | Species | Human | Gene symbol | FAM118B | Gene ID | 79607 |
| Gene name | family with sequence similarity 118 member B | |
| Gene Alias | FAM118B | |
| Cytomap | 11q24.2 | |
| Gene Type | protein-coding | GO ID | GO:0006996 | UniProtAcc | J3KP39 |
Top |
Malignant transformation analysis |
| Identification of the aberrant gene expression in precancerous and cancerous lesions by comparing the gene expression of stem-like cells in diseased tissues with normal stem cells |
| Entrez ID | Symbol | Replicates | Species | Organ | Tissue | Adj P-value | Log2FC | Malignancy |
| 79607 | FAM118B | LZE4T | Human | Esophagus | ESCC | 9.80e-04 | 9.99e-02 | 0.0811 |
| 79607 | FAM118B | LZE24T | Human | Esophagus | ESCC | 2.19e-15 | 3.52e-01 | 0.0596 |
| 79607 | FAM118B | P1T-E | Human | Esophagus | ESCC | 3.77e-04 | 1.64e-01 | 0.0875 |
| 79607 | FAM118B | P2T-E | Human | Esophagus | ESCC | 9.49e-08 | 1.09e-01 | 0.1177 |
| 79607 | FAM118B | P4T-E | Human | Esophagus | ESCC | 1.08e-25 | 4.92e-01 | 0.1323 |
| 79607 | FAM118B | P5T-E | Human | Esophagus | ESCC | 9.19e-09 | 1.12e-01 | 0.1327 |
| 79607 | FAM118B | P8T-E | Human | Esophagus | ESCC | 3.36e-12 | 2.82e-01 | 0.0889 |
| 79607 | FAM118B | P9T-E | Human | Esophagus | ESCC | 7.74e-04 | 1.15e-01 | 0.1131 |
| 79607 | FAM118B | P10T-E | Human | Esophagus | ESCC | 1.84e-15 | 2.10e-01 | 0.116 |
| 79607 | FAM118B | P11T-E | Human | Esophagus | ESCC | 5.16e-10 | 2.59e-01 | 0.1426 |
| 79607 | FAM118B | P12T-E | Human | Esophagus | ESCC | 7.23e-14 | 3.07e-01 | 0.1122 |
| 79607 | FAM118B | P15T-E | Human | Esophagus | ESCC | 3.13e-09 | 1.25e-01 | 0.1149 |
| 79607 | FAM118B | P16T-E | Human | Esophagus | ESCC | 6.72e-10 | 2.39e-01 | 0.1153 |
| 79607 | FAM118B | P20T-E | Human | Esophagus | ESCC | 3.29e-05 | 7.40e-02 | 0.1124 |
| 79607 | FAM118B | P21T-E | Human | Esophagus | ESCC | 1.01e-13 | 3.05e-01 | 0.1617 |
| 79607 | FAM118B | P22T-E | Human | Esophagus | ESCC | 1.92e-06 | 1.11e-01 | 0.1236 |
| 79607 | FAM118B | P23T-E | Human | Esophagus | ESCC | 2.49e-14 | 2.83e-01 | 0.108 |
| 79607 | FAM118B | P24T-E | Human | Esophagus | ESCC | 1.81e-05 | 1.19e-01 | 0.1287 |
| 79607 | FAM118B | P26T-E | Human | Esophagus | ESCC | 1.70e-17 | 2.83e-01 | 0.1276 |
| 79607 | FAM118B | P27T-E | Human | Esophagus | ESCC | 3.41e-11 | 2.16e-01 | 0.1055 |
| Page: 1 2 3 |
| Tissue | Expression Dynamics | Abbreviation |
| Esophagus | 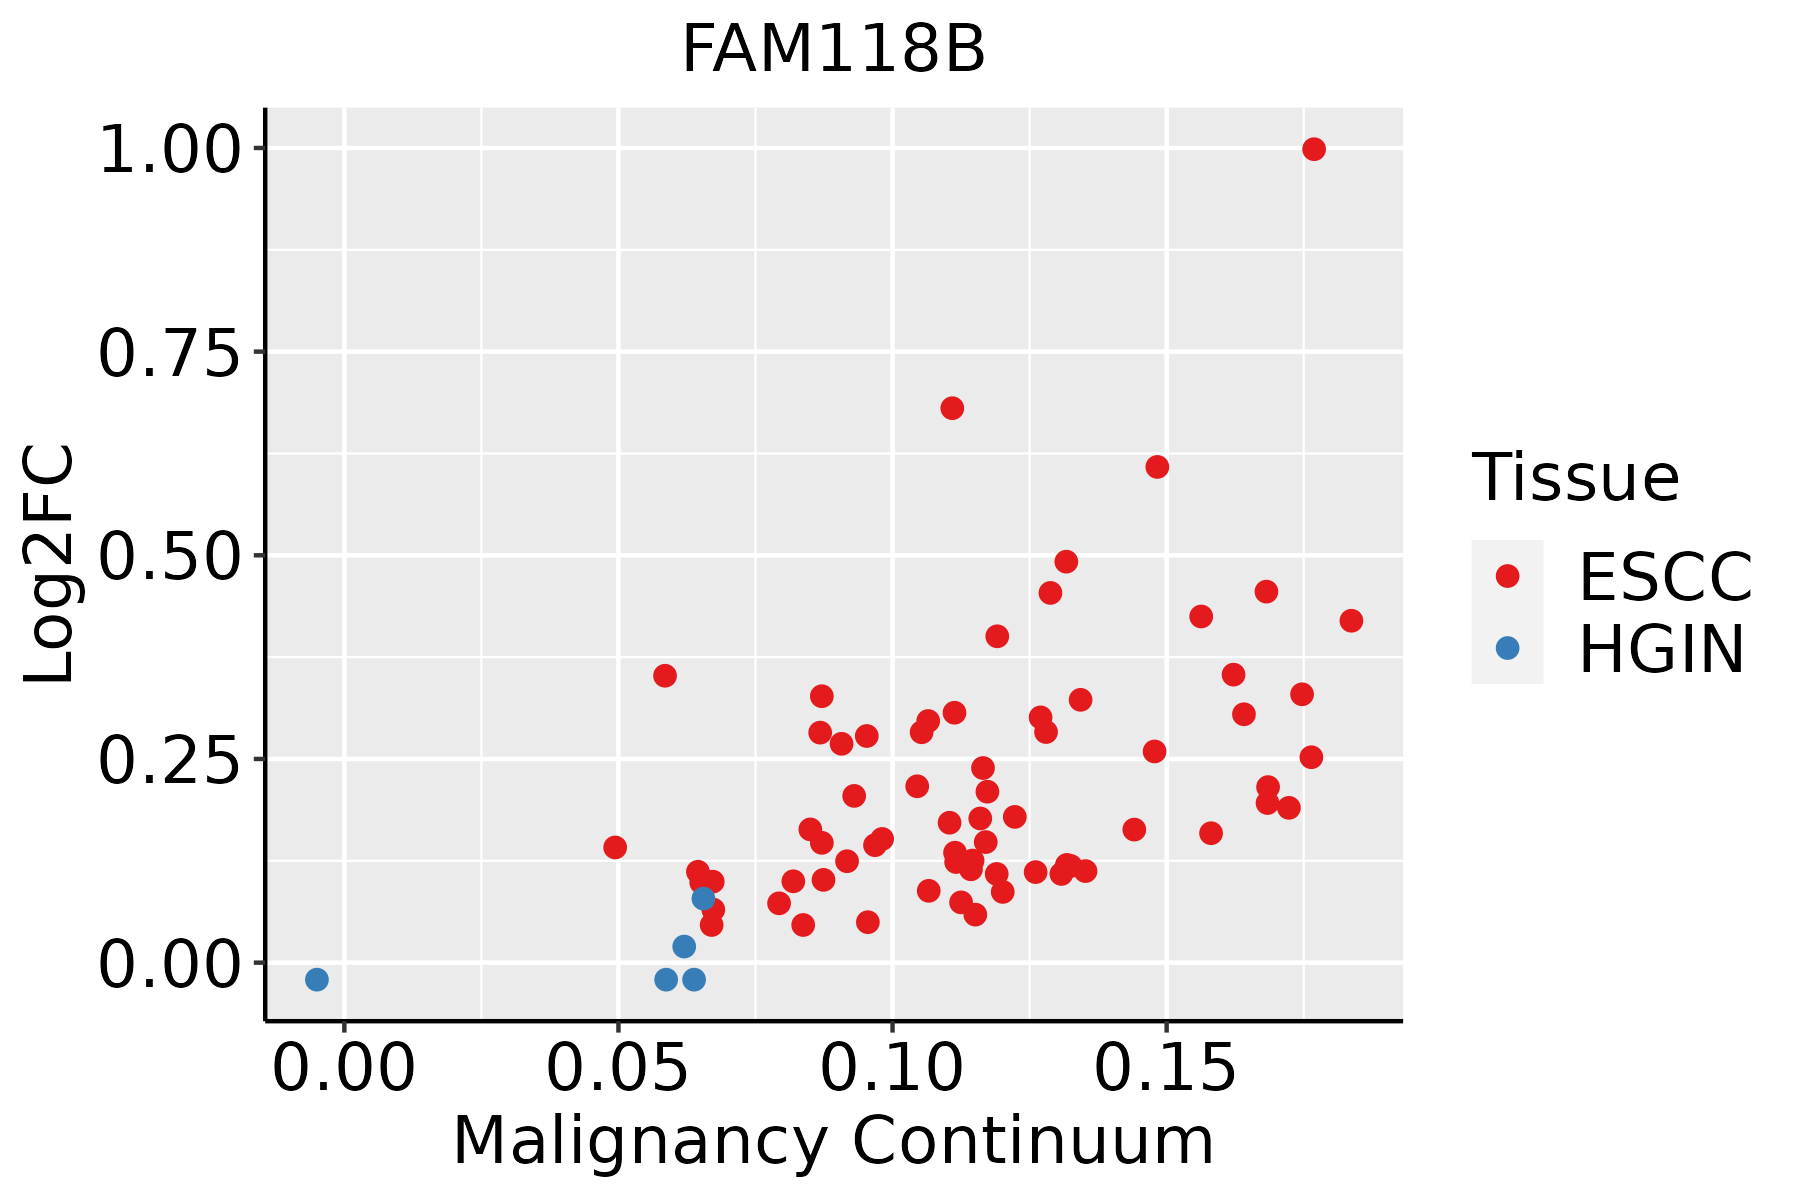 | ESCC: Esophageal squamous cell carcinoma |
| HGIN: High-grade intraepithelial neoplasias | ||
| LGIN: Low-grade intraepithelial neoplasias |
| ∗log2FC in expression of this searched gene in stem-like cells from each diseased tissue sample relative to stem-like cells in normal samples in each tissue plotted against the malignancy continuum. Samples are colored based on if they are from different disease stage. |
Top |
Malignant transformation related pathway analysis |
| Find out the enriched GO biological processes and KEGG pathways involved in transition from healthy to precancer to cancer |
| Tissue | Disease Stage | Enriched GO biological Processes |
| Colorectum | AD |  |
| Colorectum | SER |  |
| Colorectum | MSS |  |
| Colorectum | MSI-H |  |
| Colorectum | FAP |  |
| ∗Top 15 enriched GO BP terms are showed in the bar plot of each disease state in each tissue. Each row represents a significant GO biological process which is colored according to the -log10(p.adjust). |
| Page: 1 2 3 4 5 6 7 8 9 |
| GO ID | Tissue | Disease Stage | Description | Gene Ratio | Bg Ratio | pvalue | p.adjust | Count |
| GO:000699713 | Esophagus | ESCC | nucleus organization | 96/8552 | 133/18723 | 4.66e-10 | 1.21e-08 | 96 |
| Page: 1 |
| Pathway ID | Tissue | Disease Stage | Description | Gene Ratio | Bg Ratio | pvalue | p.adjust | qvalue | Count |
| Page: 1 |
Top |
Cell-cell communication analysis |
| Identification of potential cell-cell interactions between two cell types and their ligand-receptor pairs for different disease states |
| Ligand | Receptor | LRpair | Pathway | Tissue | Disease Stage |
| Page: 1 |
Top |
Single-cell gene regulatory network inference analysis |
| Find out the significant the regulons (TFs) and the target genes of each regulon across cell types for different disease states |
| TF | Cell Type | Tissue | Disease Stage | Target Gene | RSS | Regulon Activity |
| ∗The dot plots of a searched regulon are shown for all cell subpopulations in each disease state of each tissue based on the regulon specific score inferred using pySCENIC and by calculating the average expression. |
| Page: 1 |
Top |
Somatic mutation of malignant transformation related genes |
| Annotation of somatic variants for genes involved in malignant transformation |
| Hugo Symbol | Variant Class | Variant Classification | dbSNP RS | HGVSc | HGVSp | HGVSp Short | SWISSPROT | BIOTYPE | SIFT | PolyPhen | Tumor Sample Barcode | Tissue | Histology | Sex | Age | Stage | Therapy Types | Drugs | Outcome |
| FAM118B | SNV | Missense_Mutation | c.252N>G | p.Asp84Glu | p.D84E | Q9BPY3 | protein_coding | tolerated(1) | benign(0.005) | TCGA-D8-A13Z-01 | Breast | breast invasive carcinoma | Female | <65 | I/II | Chemotherapy | doxorubicine | SD | |
| FAM118B | insertion | In_Frame_Ins | novel | c.850_851insGCC | p.Asp284delinsGlyHis | p.D284delinsGH | Q9BPY3 | protein_coding | TCGA-A8-A07P-01 | Breast | breast invasive carcinoma | Female | >=65 | I/II | Chemotherapy | 5-fluorouracil | SD | ||
| FAM118B | insertion | Frame_Shift_Ins | novel | c.851_852insAGTGCAGTGGCTCACGCCTGTAATCCCAGCACTT | p.Asp284GlufsTer13 | p.D284Efs*13 | Q9BPY3 | protein_coding | TCGA-A8-A07P-01 | Breast | breast invasive carcinoma | Female | >=65 | I/II | Chemotherapy | 5-fluorouracil | SD | ||
| FAM118B | insertion | Nonsense_Mutation | novel | c.519_520insCGCCTGTAGTCCCAGCTACTTGGGAGGCTGAGGCAGGAGAATG | p.Asp174ArgfsTer3 | p.D174Rfs*3 | Q9BPY3 | protein_coding | TCGA-AN-A049-01 | Breast | breast invasive carcinoma | Female | <65 | I/II | Unknown | Unknown | SD | ||
| FAM118B | SNV | Missense_Mutation | rs377146318 | c.869N>A | p.Arg290Gln | p.R290Q | Q9BPY3 | protein_coding | tolerated(0.89) | possibly_damaging(0.465) | TCGA-2W-A8YY-01 | Cervix | cervical & endocervical cancer | Female | <65 | I/II | Chemotherapy | cisplatin | CR |
| FAM118B | SNV | Missense_Mutation | c.340C>T | p.Arg114Cys | p.R114C | Q9BPY3 | protein_coding | deleterious(0) | probably_damaging(0.982) | TCGA-IR-A3LL-01 | Cervix | cervical & endocervical cancer | Female | <65 | I/II | Chemotherapy | cisplatin | CR | |
| FAM118B | SNV | Missense_Mutation | c.174A>T | p.Gln58His | p.Q58H | Q9BPY3 | protein_coding | tolerated(0.09) | probably_damaging(0.979) | TCGA-AA-A022-01 | Colorectum | colon adenocarcinoma | Female | >=65 | I/II | Unknown | Unknown | SD | |
| FAM118B | SNV | Missense_Mutation | c.925N>A | p.Asp309Asn | p.D309N | Q9BPY3 | protein_coding | tolerated(0.42) | probably_damaging(0.909) | TCGA-AU-6004-01 | Colorectum | colon adenocarcinoma | Female | >=65 | I/II | Unknown | Unknown | SD | |
| FAM118B | SNV | Missense_Mutation | novel | c.238G>T | p.Asp80Tyr | p.D80Y | Q9BPY3 | protein_coding | deleterious(0) | probably_damaging(0.995) | TCGA-AZ-4315-01 | Colorectum | colon adenocarcinoma | Male | <65 | I/II | Unknown | Unknown | SD |
| FAM118B | SNV | Missense_Mutation | novel | c.733C>A | p.Leu245Ile | p.L245I | Q9BPY3 | protein_coding | deleterious(0.01) | benign(0.125) | TCGA-AZ-4315-01 | Colorectum | colon adenocarcinoma | Male | <65 | I/II | Unknown | Unknown | SD |
| Page: 1 2 3 4 5 |
Top |
Related drugs of malignant transformation related genes |
| Identification of chemicals and drugs interact with genes involved in malignant transfromation |
| (DGIdb 4.0) |
| Entrez ID | Symbol | Category | Interaction Types | Drug Claim Name | Drug Name | PMIDs |
| Page: 1 |

Copyright 2023-Present -The University of Texas Health Science Center at Houston |