
|
|||||
|
 | |
| |
| |
| |
| |
| |
|
Gene: FAM117B |
Gene summary for FAM117B |
| Gene information | Species | Human | Gene symbol | FAM117B | Gene ID | 150864 |
| Gene name | family with sequence similarity 117 member B | |
| Gene Alias | ALS2CR13 | |
| Cytomap | 2q33.2 | |
| Gene Type | protein-coding | GO ID | GO:0003674 | UniProtAcc | Q6P1L5 |
Top |
Malignant transformation analysis |
| Identification of the aberrant gene expression in precancerous and cancerous lesions by comparing the gene expression of stem-like cells in diseased tissues with normal stem cells |
| Entrez ID | Symbol | Replicates | Species | Organ | Tissue | Adj P-value | Log2FC | Malignancy |
| 150864 | FAM117B | CCI_2 | Human | Cervix | CC | 3.28e-17 | 1.10e+00 | 0.5249 |
| 150864 | FAM117B | CCI_3 | Human | Cervix | CC | 1.25e-02 | 4.07e-01 | 0.516 |
| 150864 | FAM117B | HTA11_3410_2000001011 | Human | Colorectum | AD | 7.12e-13 | -4.61e-01 | 0.0155 |
| 150864 | FAM117B | HTA11_2487_2000001011 | Human | Colorectum | SER | 6.51e-05 | -4.27e-01 | -0.1808 |
| 150864 | FAM117B | HTA11_696_2000001011 | Human | Colorectum | AD | 1.07e-03 | -2.65e-01 | -0.1464 |
| 150864 | FAM117B | HTA11_866_3004761011 | Human | Colorectum | AD | 1.57e-04 | -4.16e-01 | 0.096 |
| 150864 | FAM117B | HTA11_7696_3000711011 | Human | Colorectum | AD | 8.49e-03 | -2.46e-01 | 0.0674 |
| 150864 | FAM117B | HTA11_6818_2000001021 | Human | Colorectum | AD | 3.43e-05 | -5.17e-01 | 0.0588 |
| 150864 | FAM117B | HTA11_99999970781_79442 | Human | Colorectum | MSS | 5.24e-04 | -2.85e-01 | 0.294 |
| 150864 | FAM117B | HTA11_99999973899_84307 | Human | Colorectum | MSS | 3.36e-02 | -4.26e-01 | 0.2585 |
| 150864 | FAM117B | HTA11_99999974143_84620 | Human | Colorectum | MSS | 8.37e-12 | -4.46e-01 | 0.3005 |
| 150864 | FAM117B | A015-C-203 | Human | Colorectum | FAP | 8.73e-28 | -4.24e-01 | -0.1294 |
| 150864 | FAM117B | A015-C-204 | Human | Colorectum | FAP | 4.44e-03 | -1.72e-01 | -0.0228 |
| 150864 | FAM117B | A014-C-040 | Human | Colorectum | FAP | 4.91e-05 | -4.79e-01 | -0.1184 |
| 150864 | FAM117B | A002-C-201 | Human | Colorectum | FAP | 1.97e-13 | -4.42e-01 | 0.0324 |
| 150864 | FAM117B | A001-C-119 | Human | Colorectum | FAP | 7.58e-05 | -3.72e-01 | -0.1557 |
| 150864 | FAM117B | A001-C-108 | Human | Colorectum | FAP | 6.43e-13 | -2.40e-01 | -0.0272 |
| 150864 | FAM117B | A002-C-205 | Human | Colorectum | FAP | 1.14e-17 | -3.51e-01 | -0.1236 |
| 150864 | FAM117B | A001-C-104 | Human | Colorectum | FAP | 5.03e-04 | -2.27e-01 | 0.0184 |
| 150864 | FAM117B | A015-C-005 | Human | Colorectum | FAP | 8.50e-03 | -2.88e-01 | -0.0336 |
| Page: 1 2 |
| Tissue | Expression Dynamics | Abbreviation |
| Cervix | 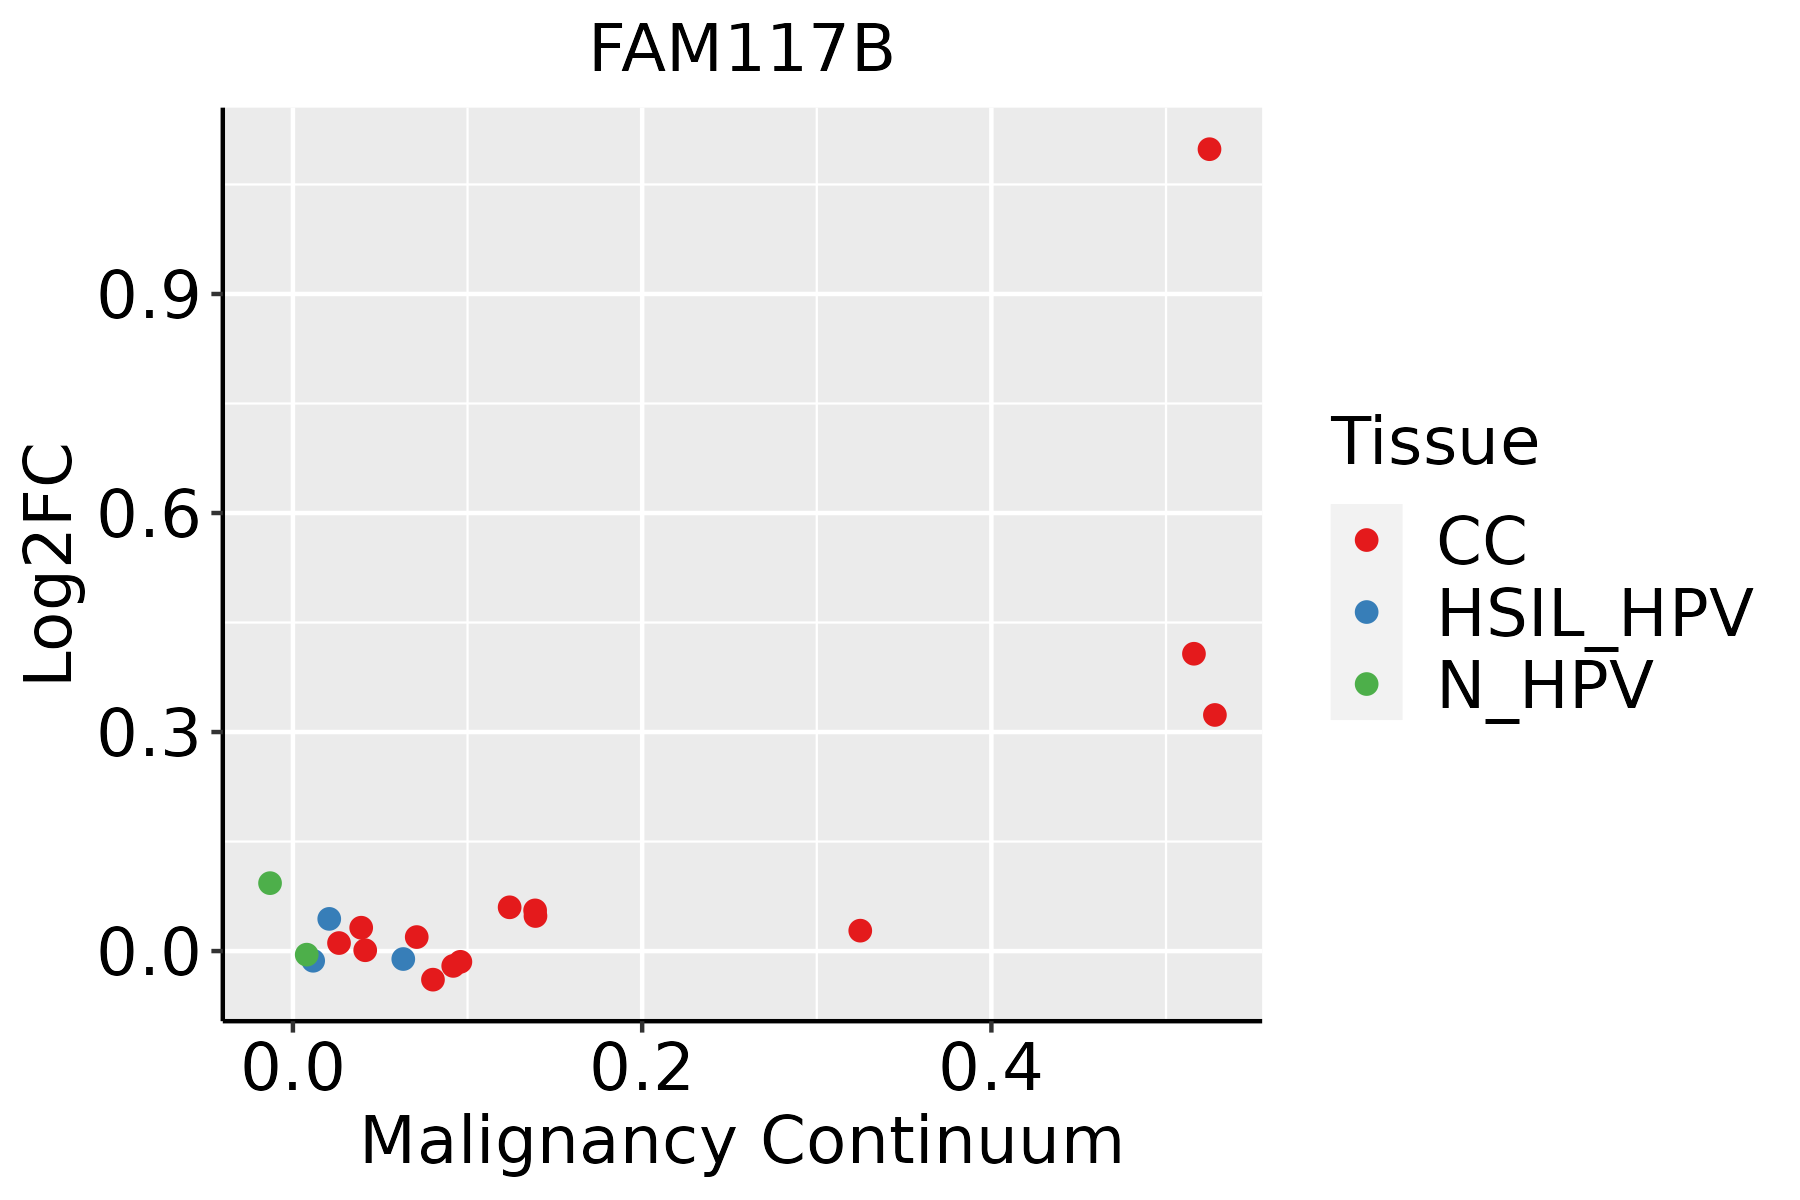 | CC: Cervix cancer |
| HSIL_HPV: HPV-infected high-grade squamous intraepithelial lesions | ||
| N_HPV: HPV-infected normal cervix | ||
| Colorectum (GSE201348) |  | FAP: Familial adenomatous polyposis |
| CRC: Colorectal cancer | ||
| Colorectum (HTA11) |  | AD: Adenomas |
| SER: Sessile serrated lesions | ||
| MSI-H: Microsatellite-high colorectal cancer | ||
| MSS: Microsatellite stable colorectal cancer |
| ∗log2FC in expression of this searched gene in stem-like cells from each diseased tissue sample relative to stem-like cells in normal samples in each tissue plotted against the malignancy continuum. Samples are colored based on if they are from different disease stage. |
Top |
Malignant transformation related pathway analysis |
| Find out the enriched GO biological processes and KEGG pathways involved in transition from healthy to precancer to cancer |
| Tissue | Disease Stage | Enriched GO biological Processes |
| Colorectum | AD |  |
| Colorectum | SER |  |
| Colorectum | MSS |  |
| Colorectum | MSI-H |  |
| Colorectum | FAP |  |
| ∗Top 15 enriched GO BP terms are showed in the bar plot of each disease state in each tissue. Each row represents a significant GO biological process which is colored according to the -log10(p.adjust). |
| Page: 1 2 3 4 5 6 7 8 9 |
| GO ID | Tissue | Disease Stage | Description | Gene Ratio | Bg Ratio | pvalue | p.adjust | Count |
| Page: 1 |
| Pathway ID | Tissue | Disease Stage | Description | Gene Ratio | Bg Ratio | pvalue | p.adjust | qvalue | Count |
| Page: 1 |
Top |
Cell-cell communication analysis |
| Identification of potential cell-cell interactions between two cell types and their ligand-receptor pairs for different disease states |
| Ligand | Receptor | LRpair | Pathway | Tissue | Disease Stage |
| Page: 1 |
Top |
Single-cell gene regulatory network inference analysis |
| Find out the significant the regulons (TFs) and the target genes of each regulon across cell types for different disease states |
| TF | Cell Type | Tissue | Disease Stage | Target Gene | RSS | Regulon Activity |
| ∗The dot plots of a searched regulon are shown for all cell subpopulations in each disease state of each tissue based on the regulon specific score inferred using pySCENIC and by calculating the average expression. |
| Page: 1 |
Top |
Somatic mutation of malignant transformation related genes |
| Annotation of somatic variants for genes involved in malignant transformation |
| Hugo Symbol | Variant Class | Variant Classification | dbSNP RS | HGVSc | HGVSp | HGVSp Short | SWISSPROT | BIOTYPE | SIFT | PolyPhen | Tumor Sample Barcode | Tissue | Histology | Sex | Age | Stage | Therapy Types | Drugs | Outcome |
| FAM117B | SNV | Missense_Mutation | c.683A>T | p.Tyr228Phe | p.Y228F | Q6P1L5 | protein_coding | deleterious(0.01) | probably_damaging(0.994) | TCGA-A1-A0SO-01 | Breast | breast invasive carcinoma | Female | >=65 | I/II | Chemotherapy | SD | ||
| FAM117B | SNV | Missense_Mutation | c.884N>G | p.His295Arg | p.H295R | Q6P1L5 | protein_coding | tolerated(0.15) | benign(0.069) | TCGA-A7-A0CE-01 | Breast | breast invasive carcinoma | Female | <65 | I/II | Chemotherapy | adriamycin | SD | |
| FAM117B | SNV | Missense_Mutation | c.1414G>C | p.Glu472Gln | p.E472Q | Q6P1L5 | protein_coding | deleterious(0) | probably_damaging(0.997) | TCGA-GM-A2DO-01 | Breast | breast invasive carcinoma | Female | <65 | I/II | Hormone Therapy | tamoxiphen | CR | |
| FAM117B | SNV | Missense_Mutation | novel | c.802N>G | p.His268Asp | p.H268D | Q6P1L5 | protein_coding | deleterious(0) | possibly_damaging(0.871) | TCGA-OL-A5RW-01 | Breast | breast invasive carcinoma | Female | <65 | I/II | Chemotherapy | adriamycin | CR |
| FAM117B | insertion | Nonsense_Mutation | novel | c.1291_1292insATTTATTTATCTAACCGTCTCTCTATTCTTTAGTGAAGGAGGAATTGA | p.Cys431delinsTyrLeuPheIleTerProSerLeuTyrSerLeuValLysGluGluLeuSer | p.C431delinsYLFI*PSLYSLVKEELS | Q6P1L5 | protein_coding | TCGA-AN-A0FN-01 | Breast | breast invasive carcinoma | Female | <65 | I/II | Unknown | Unknown | SD | ||
| FAM117B | SNV | Missense_Mutation | novel | c.1036G>A | p.Val346Met | p.V346M | Q6P1L5 | protein_coding | tolerated(0.15) | possibly_damaging(0.855) | TCGA-AA-3947-01 | Colorectum | colon adenocarcinoma | Female | <65 | I/II | Unknown | Unknown | SD |
| FAM117B | SNV | Missense_Mutation | c.1130N>A | p.Arg377His | p.R377H | Q6P1L5 | protein_coding | deleterious(0) | probably_damaging(0.998) | TCGA-AA-A010-01 | Colorectum | colon adenocarcinoma | Female | <65 | I/II | Chemotherapy | folinic | CR | |
| FAM117B | SNV | Missense_Mutation | novel | c.1481N>G | p.Phe494Cys | p.F494C | Q6P1L5 | protein_coding | deleterious(0.01) | probably_damaging(0.98) | TCGA-CA-6717-01 | Colorectum | colon adenocarcinoma | Male | <65 | I/II | Chemotherapy | oxaliplatin | CR |
| FAM117B | SNV | Missense_Mutation | c.650N>A | p.Arg217His | p.R217H | Q6P1L5 | protein_coding | deleterious(0.01) | probably_damaging(0.998) | TCGA-D5-6928-01 | Colorectum | colon adenocarcinoma | Male | >=65 | I/II | Unknown | Unknown | SD | |
| FAM117B | deletion | Frame_Shift_Del | c.1138delN | p.Val383TyrfsTer120 | p.V383Yfs*120 | Q6P1L5 | protein_coding | TCGA-5M-AAT6-01 | Colorectum | colon adenocarcinoma | Female | <65 | III/IV | Unknown | Unknown | PD |
| Page: 1 2 3 4 5 6 |
Top |
Related drugs of malignant transformation related genes |
| Identification of chemicals and drugs interact with genes involved in malignant transfromation |
| (DGIdb 4.0) |
| Entrez ID | Symbol | Category | Interaction Types | Drug Claim Name | Drug Name | PMIDs |
| Page: 1 |

Copyright 2023-Present -The University of Texas Health Science Center at Houston |