
|
|||||
|
 | |
| |
| |
| |
| |
| |
|
Gene: FAM117A |
Gene summary for FAM117A |
| Gene information | Species | Human | Gene symbol | FAM117A | Gene ID | 81558 |
| Gene name | family with sequence similarity 117 member A | |
| Gene Alias | FAM117A | |
| Cytomap | 17q21.33 | |
| Gene Type | protein-coding | GO ID | NA | UniProtAcc | Q9C073 |
Top |
Malignant transformation analysis |
| Identification of the aberrant gene expression in precancerous and cancerous lesions by comparing the gene expression of stem-like cells in diseased tissues with normal stem cells |
| Entrez ID | Symbol | Replicates | Species | Organ | Tissue | Adj P-value | Log2FC | Malignancy |
| 81558 | FAM117A | AEH-subject1 | Human | Endometrium | AEH | 1.22e-04 | 2.79e-01 | -0.3059 |
| 81558 | FAM117A | AEH-subject2 | Human | Endometrium | AEH | 1.63e-04 | 2.71e-01 | -0.2525 |
| 81558 | FAM117A | AEH-subject3 | Human | Endometrium | AEH | 1.04e-04 | 2.78e-01 | -0.2576 |
| 81558 | FAM117A | AEH-subject4 | Human | Endometrium | AEH | 5.34e-03 | 2.41e-01 | -0.2657 |
| Page: 1 |
| Tissue | Expression Dynamics | Abbreviation |
| Endometrium | 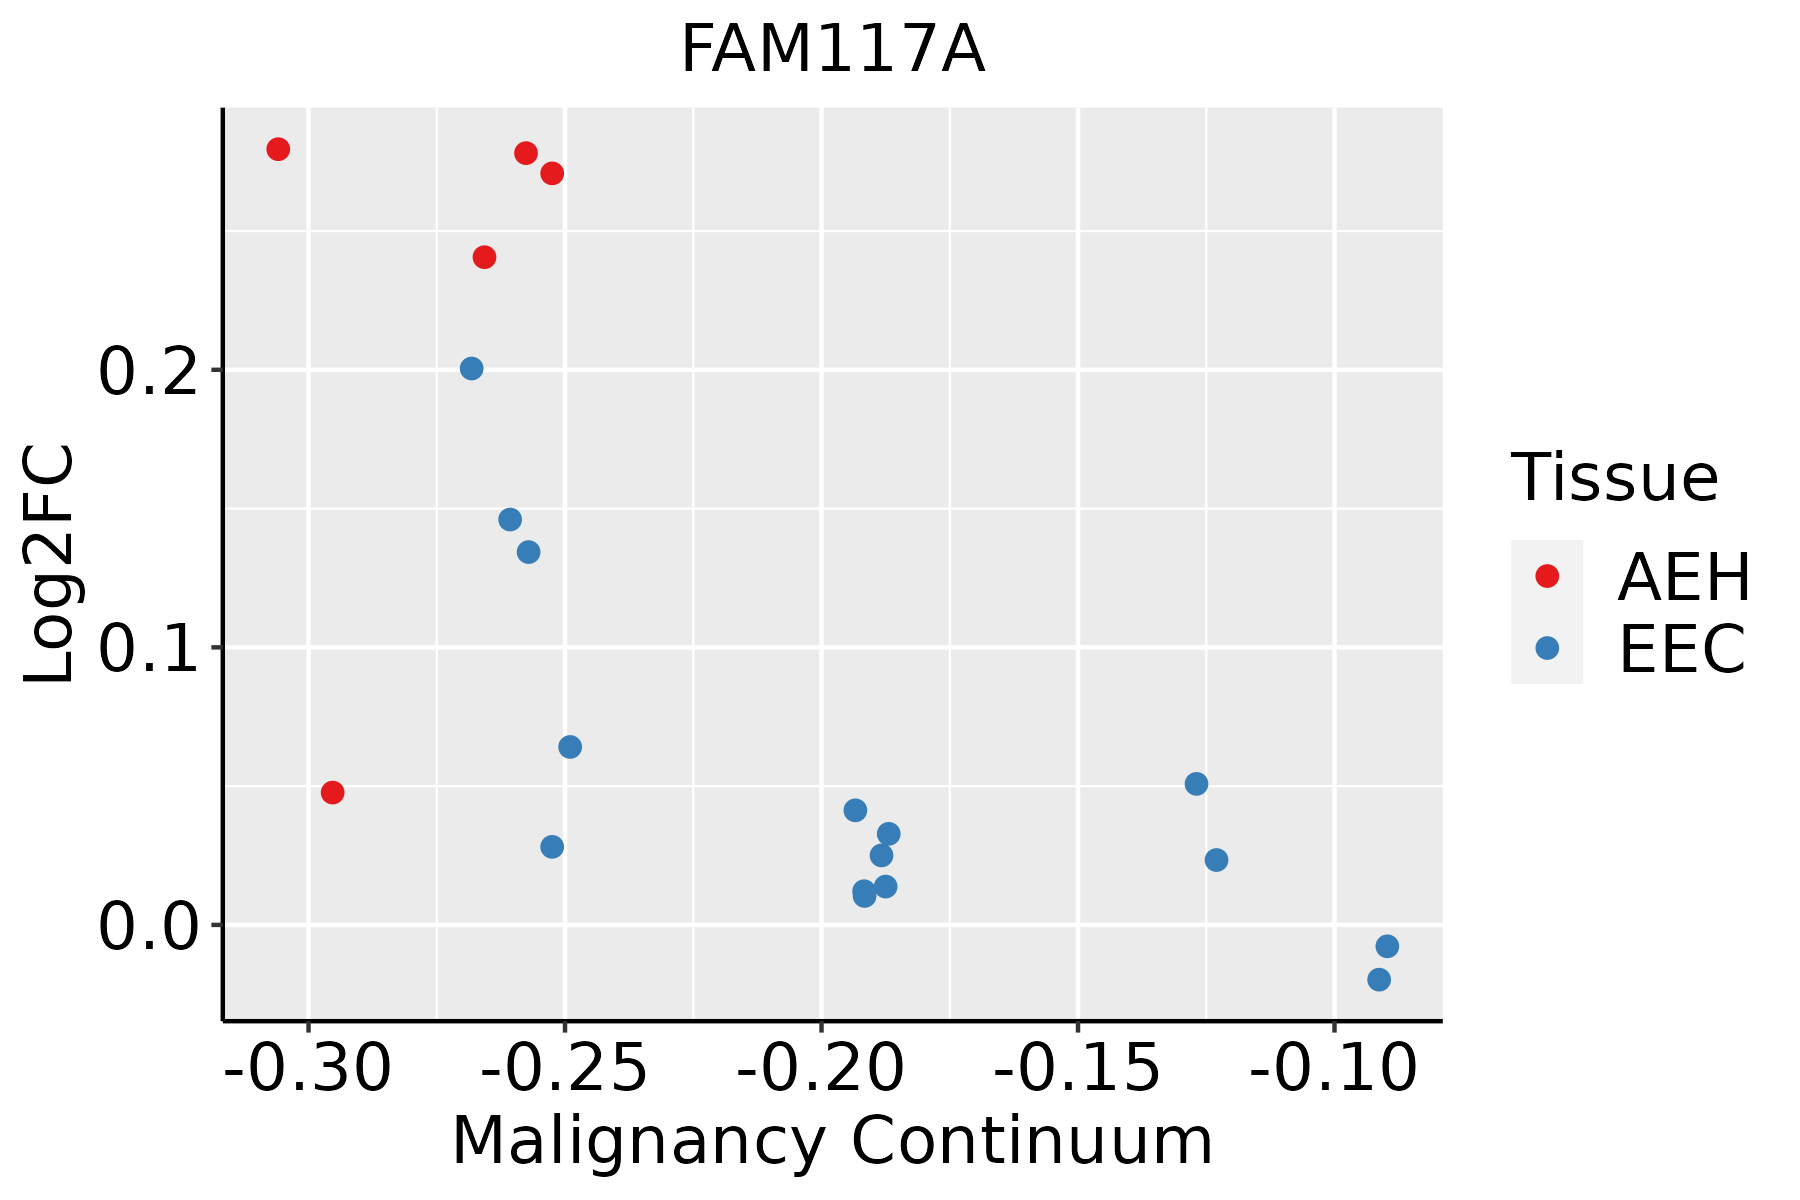 | AEH: Atypical endometrial hyperplasia |
| EEC: Endometrioid Cancer |
| ∗log2FC in expression of this searched gene in stem-like cells from each diseased tissue sample relative to stem-like cells in normal samples in each tissue plotted against the malignancy continuum. Samples are colored based on if they are from different disease stage. |
Top |
Malignant transformation related pathway analysis |
| Find out the enriched GO biological processes and KEGG pathways involved in transition from healthy to precancer to cancer |
| Tissue | Disease Stage | Enriched GO biological Processes |
| Colorectum | AD |  |
| Colorectum | SER |  |
| Colorectum | MSS |  |
| Colorectum | MSI-H |  |
| Colorectum | FAP |  |
| ∗Top 15 enriched GO BP terms are showed in the bar plot of each disease state in each tissue. Each row represents a significant GO biological process which is colored according to the -log10(p.adjust). |
| Page: 1 2 3 4 5 6 7 8 9 |
| GO ID | Tissue | Disease Stage | Description | Gene Ratio | Bg Ratio | pvalue | p.adjust | Count |
| Page: 1 |
| Pathway ID | Tissue | Disease Stage | Description | Gene Ratio | Bg Ratio | pvalue | p.adjust | qvalue | Count |
| Page: 1 |
Top |
Cell-cell communication analysis |
| Identification of potential cell-cell interactions between two cell types and their ligand-receptor pairs for different disease states |
| Ligand | Receptor | LRpair | Pathway | Tissue | Disease Stage |
| Page: 1 |
Top |
Single-cell gene regulatory network inference analysis |
| Find out the significant the regulons (TFs) and the target genes of each regulon across cell types for different disease states |
| TF | Cell Type | Tissue | Disease Stage | Target Gene | RSS | Regulon Activity |
| ∗The dot plots of a searched regulon are shown for all cell subpopulations in each disease state of each tissue based on the regulon specific score inferred using pySCENIC and by calculating the average expression. |
| Page: 1 |
Top |
Somatic mutation of malignant transformation related genes |
| Annotation of somatic variants for genes involved in malignant transformation |
| Hugo Symbol | Variant Class | Variant Classification | dbSNP RS | HGVSc | HGVSp | HGVSp Short | SWISSPROT | BIOTYPE | SIFT | PolyPhen | Tumor Sample Barcode | Tissue | Histology | Sex | Age | Stage | Therapy Types | Drugs | Outcome |
| FAM117A | SNV | Missense_Mutation | novel | c.683A>G | p.Glu228Gly | p.E228G | Q9C073 | protein_coding | deleterious(0.02) | benign(0.439) | TCGA-B6-A0IB-01 | Breast | breast invasive carcinoma | Female | <65 | III/IV | Unknown | Unknown | PD |
| FAM117A | SNV | Missense_Mutation | c.917N>T | p.Ser306Phe | p.S306F | Q9C073 | protein_coding | deleterious(0.01) | possibly_damaging(0.598) | TCGA-E9-A1RF-01 | Breast | breast invasive carcinoma | Female | >=65 | III/IV | Hormone Therapy | tamoxiphen | SD | |
| FAM117A | deletion | In_Frame_Del | c.1070_1075delNNNNNN | p.Gly357_Pro358del | p.G357_P358del | Q9C073 | protein_coding | TCGA-AR-A24H-01 | Breast | breast invasive carcinoma | Female | >=65 | I/II | Hormone Therapy | tamoxiphen | SD | |||
| FAM117A | SNV | Missense_Mutation | rs755529128 | c.262N>T | p.Arg88Cys | p.R88C | Q9C073 | protein_coding | deleterious(0) | possibly_damaging(0.897) | TCGA-2W-A8YY-01 | Cervix | cervical & endocervical cancer | Female | <65 | I/II | Chemotherapy | cisplatin | CR |
| FAM117A | SNV | Missense_Mutation | novel | c.364N>A | p.Gln122Lys | p.Q122K | Q9C073 | protein_coding | deleterious(0) | benign(0.229) | TCGA-EX-A1H5-01 | Cervix | cervical & endocervical cancer | Female | <65 | I/II | Unknown | Unknown | SD |
| FAM117A | SNV | Missense_Mutation | rs368699234 | c.1255C>T | p.Arg419Trp | p.R419W | Q9C073 | protein_coding | deleterious_low_confidence(0) | probably_damaging(0.977) | TCGA-VS-A959-01 | Cervix | cervical & endocervical cancer | Female | >=65 | I/II | Unknown | Unknown | SD |
| FAM117A | SNV | Missense_Mutation | novel | c.563N>A | p.Gly188Glu | p.G188E | Q9C073 | protein_coding | deleterious(0.04) | probably_damaging(0.976) | TCGA-VS-A9UJ-01 | Cervix | cervical & endocervical cancer | Female | <65 | I/II | Unknown | Unknown | PD |
| FAM117A | SNV | Missense_Mutation | novel | c.254N>G | p.Gln85Arg | p.Q85R | Q9C073 | protein_coding | tolerated(1) | benign(0.003) | TCGA-A6-2686-01 | Colorectum | colon adenocarcinoma | Female | >=65 | I/II | Unknown | Unknown | SD |
| FAM117A | SNV | Missense_Mutation | c.865C>T | p.His289Tyr | p.H289Y | Q9C073 | protein_coding | tolerated(1) | benign(0.201) | TCGA-A6-6780-01 | Colorectum | colon adenocarcinoma | Male | >=65 | I/II | Unknown | Unknown | SD | |
| FAM117A | SNV | Missense_Mutation | c.620N>T | p.Ser207Ile | p.S207I | Q9C073 | protein_coding | tolerated(0.06) | probably_damaging(0.997) | TCGA-G4-6306-01 | Colorectum | colon adenocarcinoma | Male | >=65 | I/II | Unknown | Unknown | SD |
| Page: 1 2 3 4 |
Top |
Related drugs of malignant transformation related genes |
| Identification of chemicals and drugs interact with genes involved in malignant transfromation |
| (DGIdb 4.0) |
| Entrez ID | Symbol | Category | Interaction Types | Drug Claim Name | Drug Name | PMIDs |
| Page: 1 |

Copyright 2023-Present -The University of Texas Health Science Center at Houston |