
|
|||||
|
 | |
| |
| |
| |
| |
| |
|
Gene: FAM114A2 |
Gene summary for FAM114A2 |
| Gene information | Species | Human | Gene symbol | FAM114A2 | Gene ID | 10827 |
| Gene name | family with sequence similarity 114 member A2 | |
| Gene Alias | 133K02 | |
| Cytomap | 5q33.2 | |
| Gene Type | protein-coding | GO ID | GO:0008150 | UniProtAcc | A0A140VKG4 |
Top |
Malignant transformation analysis |
| Identification of the aberrant gene expression in precancerous and cancerous lesions by comparing the gene expression of stem-like cells in diseased tissues with normal stem cells |
| Entrez ID | Symbol | Replicates | Species | Organ | Tissue | Adj P-value | Log2FC | Malignancy |
| 10827 | FAM114A2 | LZE24T | Human | Esophagus | ESCC | 2.16e-07 | 1.71e-01 | 0.0596 |
| 10827 | FAM114A2 | P2T-E | Human | Esophagus | ESCC | 2.06e-08 | 1.50e-01 | 0.1177 |
| 10827 | FAM114A2 | P4T-E | Human | Esophagus | ESCC | 1.19e-03 | 1.01e-01 | 0.1323 |
| 10827 | FAM114A2 | P5T-E | Human | Esophagus | ESCC | 7.31e-14 | 2.35e-01 | 0.1327 |
| 10827 | FAM114A2 | P8T-E | Human | Esophagus | ESCC | 3.75e-03 | 7.13e-02 | 0.0889 |
| 10827 | FAM114A2 | P10T-E | Human | Esophagus | ESCC | 1.88e-04 | 1.08e-01 | 0.116 |
| 10827 | FAM114A2 | P12T-E | Human | Esophagus | ESCC | 4.40e-09 | 1.78e-01 | 0.1122 |
| 10827 | FAM114A2 | P15T-E | Human | Esophagus | ESCC | 1.67e-02 | 1.09e-01 | 0.1149 |
| 10827 | FAM114A2 | P16T-E | Human | Esophagus | ESCC | 2.32e-10 | 1.49e-01 | 0.1153 |
| 10827 | FAM114A2 | P17T-E | Human | Esophagus | ESCC | 2.68e-02 | 1.92e-01 | 0.1278 |
| 10827 | FAM114A2 | P20T-E | Human | Esophagus | ESCC | 1.48e-04 | 1.26e-01 | 0.1124 |
| 10827 | FAM114A2 | P21T-E | Human | Esophagus | ESCC | 8.35e-13 | 2.28e-01 | 0.1617 |
| 10827 | FAM114A2 | P22T-E | Human | Esophagus | ESCC | 3.50e-02 | 7.53e-02 | 0.1236 |
| 10827 | FAM114A2 | P23T-E | Human | Esophagus | ESCC | 1.44e-10 | 2.28e-01 | 0.108 |
| 10827 | FAM114A2 | P24T-E | Human | Esophagus | ESCC | 1.78e-03 | 9.52e-02 | 0.1287 |
| 10827 | FAM114A2 | P26T-E | Human | Esophagus | ESCC | 7.98e-13 | 2.17e-01 | 0.1276 |
| 10827 | FAM114A2 | P27T-E | Human | Esophagus | ESCC | 2.74e-03 | 1.18e-01 | 0.1055 |
| 10827 | FAM114A2 | P28T-E | Human | Esophagus | ESCC | 8.40e-04 | 9.41e-02 | 0.1149 |
| 10827 | FAM114A2 | P31T-E | Human | Esophagus | ESCC | 3.75e-03 | 8.85e-02 | 0.1251 |
| 10827 | FAM114A2 | P32T-E | Human | Esophagus | ESCC | 7.28e-26 | 4.69e-01 | 0.1666 |
| Page: 1 2 3 |
| Tissue | Expression Dynamics | Abbreviation |
| Esophagus | 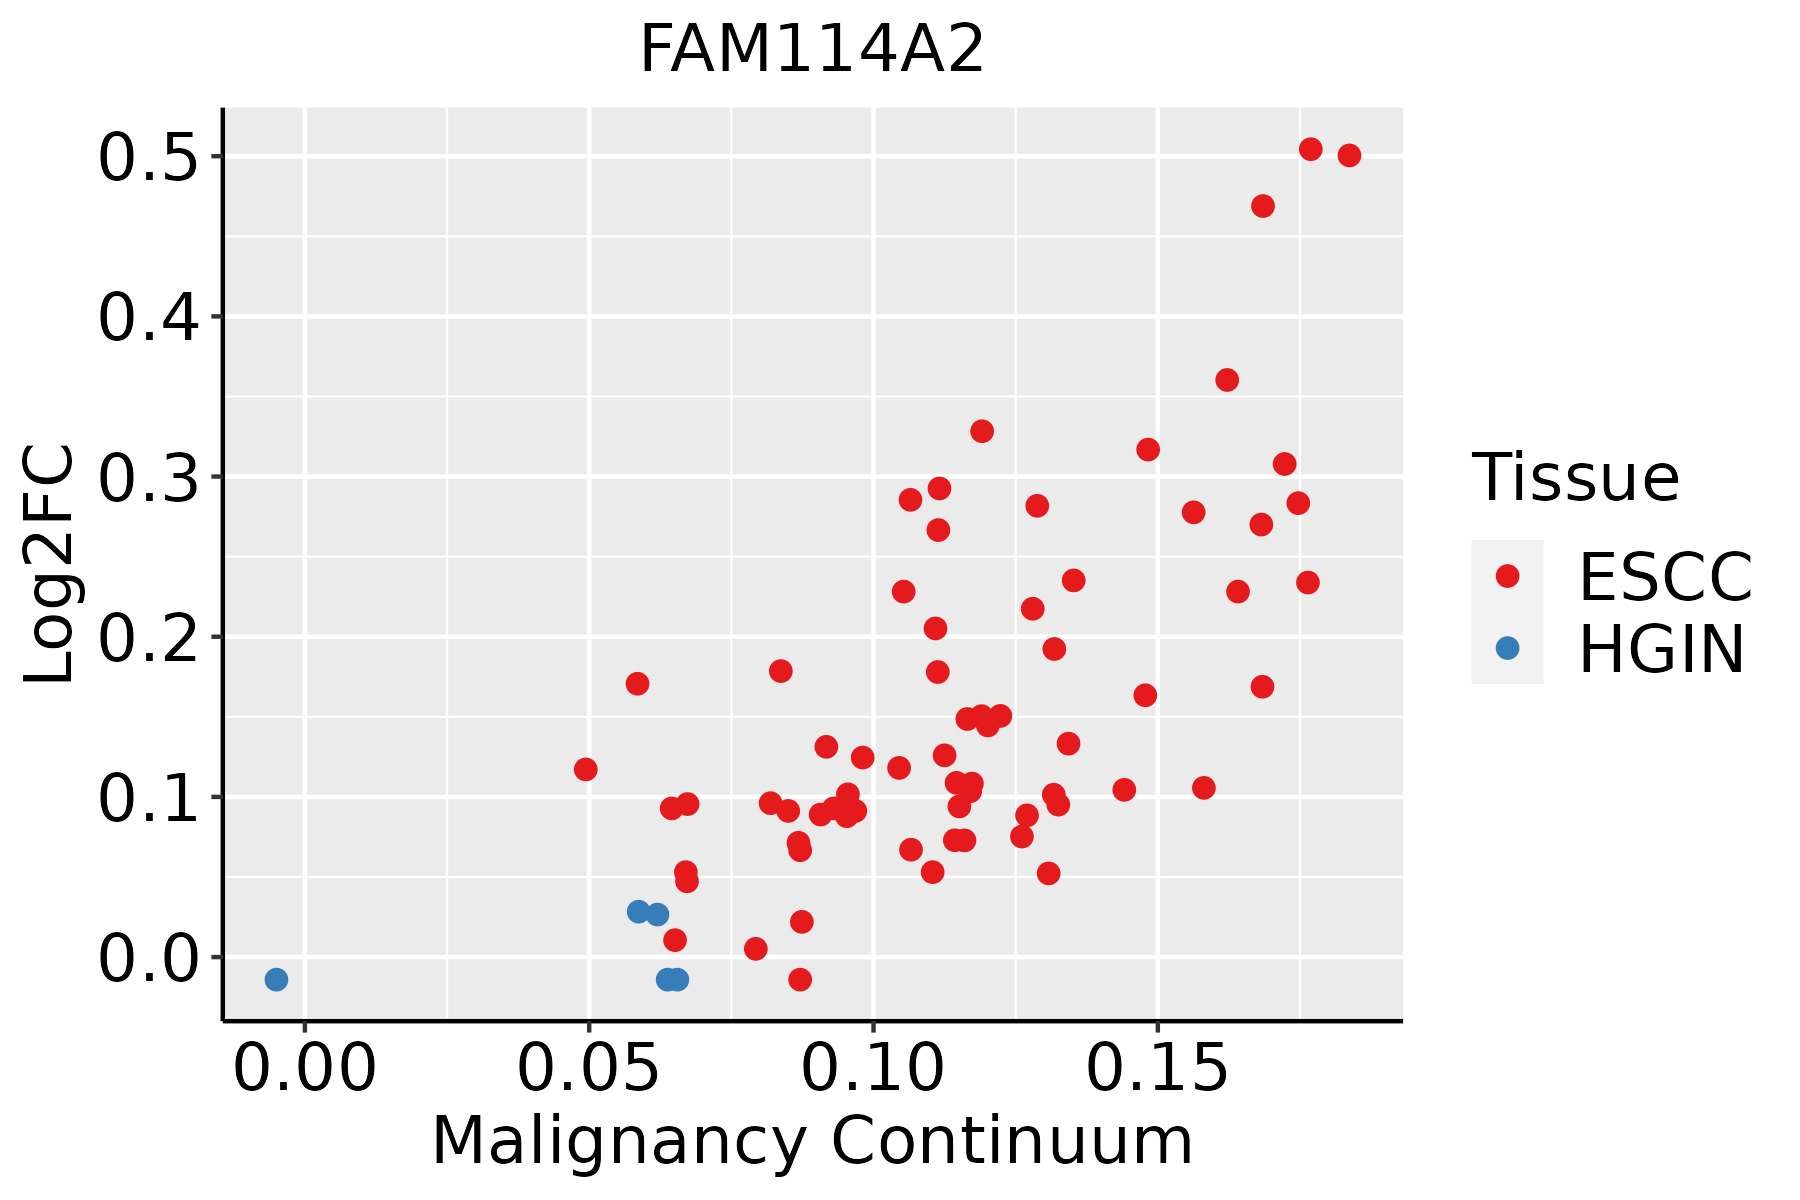 | ESCC: Esophageal squamous cell carcinoma |
| HGIN: High-grade intraepithelial neoplasias | ||
| LGIN: Low-grade intraepithelial neoplasias |
| ∗log2FC in expression of this searched gene in stem-like cells from each diseased tissue sample relative to stem-like cells in normal samples in each tissue plotted against the malignancy continuum. Samples are colored based on if they are from different disease stage. |
Top |
Malignant transformation related pathway analysis |
| Find out the enriched GO biological processes and KEGG pathways involved in transition from healthy to precancer to cancer |
| Tissue | Disease Stage | Enriched GO biological Processes |
| Colorectum | AD |  |
| Colorectum | SER |  |
| Colorectum | MSS |  |
| Colorectum | MSI-H |  |
| Colorectum | FAP |  |
| ∗Top 15 enriched GO BP terms are showed in the bar plot of each disease state in each tissue. Each row represents a significant GO biological process which is colored according to the -log10(p.adjust). |
| Page: 1 2 3 4 5 6 7 8 9 |
| GO ID | Tissue | Disease Stage | Description | Gene Ratio | Bg Ratio | pvalue | p.adjust | Count |
| Page: 1 |
| Pathway ID | Tissue | Disease Stage | Description | Gene Ratio | Bg Ratio | pvalue | p.adjust | qvalue | Count |
| Page: 1 |
Top |
Cell-cell communication analysis |
| Identification of potential cell-cell interactions between two cell types and their ligand-receptor pairs for different disease states |
| Ligand | Receptor | LRpair | Pathway | Tissue | Disease Stage |
| Page: 1 |
Top |
Single-cell gene regulatory network inference analysis |
| Find out the significant the regulons (TFs) and the target genes of each regulon across cell types for different disease states |
| TF | Cell Type | Tissue | Disease Stage | Target Gene | RSS | Regulon Activity |
| ∗The dot plots of a searched regulon are shown for all cell subpopulations in each disease state of each tissue based on the regulon specific score inferred using pySCENIC and by calculating the average expression. |
| Page: 1 |
Top |
Somatic mutation of malignant transformation related genes |
| Annotation of somatic variants for genes involved in malignant transformation |
| Hugo Symbol | Variant Class | Variant Classification | dbSNP RS | HGVSc | HGVSp | HGVSp Short | SWISSPROT | BIOTYPE | SIFT | PolyPhen | Tumor Sample Barcode | Tissue | Histology | Sex | Age | Stage | Therapy Types | Drugs | Outcome |
| FAM114A2 | SNV | Missense_Mutation | c.1343N>T | p.Ala448Val | p.A448V | Q9NRY5 | protein_coding | deleterious(0.01) | benign(0.219) | TCGA-A2-A04R-01 | Breast | breast invasive carcinoma | Female | <65 | I/II | Chemotherapy | taxol | SD | |
| FAM114A2 | SNV | Missense_Mutation | c.270N>T | p.Lys90Asn | p.K90N | Q9NRY5 | protein_coding | deleterious(0) | probably_damaging(1) | TCGA-A8-A08F-01 | Breast | breast invasive carcinoma | Female | <65 | III/IV | Chemotherapy | 5-fluorouracil | CR | |
| FAM114A2 | SNV | Missense_Mutation | c.1483N>A | p.Glu495Lys | p.E495K | Q9NRY5 | protein_coding | tolerated_low_confidence(0.05) | benign(0.283) | TCGA-BH-A0BR-01 | Breast | breast invasive carcinoma | Female | <65 | I/II | Unknown | Unknown | SD | |
| FAM114A2 | SNV | Missense_Mutation | c.465N>G | p.Phe155Leu | p.F155L | Q9NRY5 | protein_coding | tolerated(1) | benign(0.014) | TCGA-C8-A26Y-01 | Breast | breast invasive carcinoma | Female | >=65 | I/II | Unknown | Unknown | SD | |
| FAM114A2 | SNV | Missense_Mutation | c.487C>G | p.Gln163Glu | p.Q163E | Q9NRY5 | protein_coding | deleterious(0.05) | probably_damaging(0.998) | TCGA-E2-A159-01 | Breast | breast invasive carcinoma | Female | <65 | I/II | Chemotherapy | cyclophosphamide | SD | |
| FAM114A2 | SNV | Missense_Mutation | rs765339513 | c.118N>A | p.Glu40Lys | p.E40K | Q9NRY5 | protein_coding | deleterious(0.03) | benign(0.321) | TCGA-C5-A3HD-01 | Cervix | cervical & endocervical cancer | Female | <65 | I/II | Chemotherapy | cisplatin | SD |
| FAM114A2 | SNV | Missense_Mutation | novel | c.5C>T | p.Ser2Leu | p.S2L | Q9NRY5 | protein_coding | deleterious_low_confidence(0) | benign(0.386) | TCGA-DS-A1OB-01 | Cervix | cervical & endocervical cancer | Female | <65 | I/II | Chemotherapy | carboplatin | PD |
| FAM114A2 | SNV | Missense_Mutation | c.1305N>G | p.Phe435Leu | p.F435L | Q9NRY5 | protein_coding | deleterious(0.01) | possibly_damaging(0.64) | TCGA-Q1-A73P-01 | Cervix | cervical & endocervical cancer | Female | <65 | I/II | Unknown | Unknown | SD | |
| FAM114A2 | SNV | Missense_Mutation | c.725A>T | p.Asp242Val | p.D242V | Q9NRY5 | protein_coding | deleterious(0) | probably_damaging(1) | TCGA-AA-3713-01 | Colorectum | colon adenocarcinoma | Male | >=65 | III/IV | Chemotherapy | 5-fluorouracil | PR | |
| FAM114A2 | SNV | Missense_Mutation | novel | c.715N>A | p.Leu239Ile | p.L239I | Q9NRY5 | protein_coding | tolerated(0.28) | possibly_damaging(0.665) | TCGA-AA-3947-01 | Colorectum | colon adenocarcinoma | Female | <65 | I/II | Unknown | Unknown | SD |
| Page: 1 2 3 4 5 6 7 |
Top |
Related drugs of malignant transformation related genes |
| Identification of chemicals and drugs interact with genes involved in malignant transfromation |
| (DGIdb 4.0) |
| Entrez ID | Symbol | Category | Interaction Types | Drug Claim Name | Drug Name | PMIDs |
| Page: 1 |

Copyright 2023-Present -The University of Texas Health Science Center at Houston |