
|
|||||
|
 | |
| |
| |
| |
| |
| |
|
Gene: FAM111A |
Gene summary for FAM111A |
| Gene information | Species | Human | Gene symbol | FAM111A | Gene ID | 63901 |
| Gene name | FAM111 trypsin like peptidase A | |
| Gene Alias | GCLEB | |
| Cytomap | 11q12.1 | |
| Gene Type | protein-coding | GO ID | GO:0006139 | UniProtAcc | A0A024R4Z3 |
Top |
Malignant transformation analysis |
| Identification of the aberrant gene expression in precancerous and cancerous lesions by comparing the gene expression of stem-like cells in diseased tissues with normal stem cells |
| Entrez ID | Symbol | Replicates | Species | Organ | Tissue | Adj P-value | Log2FC | Malignancy |
| 63901 | FAM111A | LZE4T | Human | Esophagus | ESCC | 1.71e-04 | 2.38e-01 | 0.0811 |
| 63901 | FAM111A | LZE20T | Human | Esophagus | ESCC | 5.45e-03 | 1.32e-01 | 0.0662 |
| 63901 | FAM111A | LZE21D1 | Human | Esophagus | HGIN | 4.37e-02 | 3.62e-01 | 0.0632 |
| 63901 | FAM111A | LZE24T | Human | Esophagus | ESCC | 1.52e-18 | 4.80e-01 | 0.0596 |
| 63901 | FAM111A | LZE6T | Human | Esophagus | ESCC | 6.59e-07 | 3.36e-01 | 0.0845 |
| 63901 | FAM111A | P1T-E | Human | Esophagus | ESCC | 1.71e-07 | 2.45e-01 | 0.0875 |
| 63901 | FAM111A | P2T-E | Human | Esophagus | ESCC | 6.22e-26 | 5.38e-01 | 0.1177 |
| 63901 | FAM111A | P4T-E | Human | Esophagus | ESCC | 1.78e-19 | 5.22e-01 | 0.1323 |
| 63901 | FAM111A | P8T-E | Human | Esophagus | ESCC | 1.28e-29 | 6.05e-01 | 0.0889 |
| 63901 | FAM111A | P10T-E | Human | Esophagus | ESCC | 5.28e-07 | 3.03e-01 | 0.116 |
| 63901 | FAM111A | P11T-E | Human | Esophagus | ESCC | 9.27e-08 | 3.70e-01 | 0.1426 |
| 63901 | FAM111A | P12T-E | Human | Esophagus | ESCC | 2.88e-06 | 1.80e-01 | 0.1122 |
| 63901 | FAM111A | P15T-E | Human | Esophagus | ESCC | 8.30e-08 | 1.42e-01 | 0.1149 |
| 63901 | FAM111A | P16T-E | Human | Esophagus | ESCC | 2.20e-14 | 4.49e-01 | 0.1153 |
| 63901 | FAM111A | P17T-E | Human | Esophagus | ESCC | 6.15e-05 | 3.11e-01 | 0.1278 |
| 63901 | FAM111A | P19T-E | Human | Esophagus | ESCC | 1.45e-02 | 2.17e-01 | 0.1662 |
| 63901 | FAM111A | P20T-E | Human | Esophagus | ESCC | 3.77e-16 | 3.47e-01 | 0.1124 |
| 63901 | FAM111A | P21T-E | Human | Esophagus | ESCC | 3.44e-11 | 3.09e-01 | 0.1617 |
| 63901 | FAM111A | P22T-E | Human | Esophagus | ESCC | 1.41e-11 | 2.59e-01 | 0.1236 |
| 63901 | FAM111A | P23T-E | Human | Esophagus | ESCC | 2.15e-11 | 2.58e-01 | 0.108 |
| Page: 1 2 3 4 5 |
| Tissue | Expression Dynamics | Abbreviation |
| Esophagus | 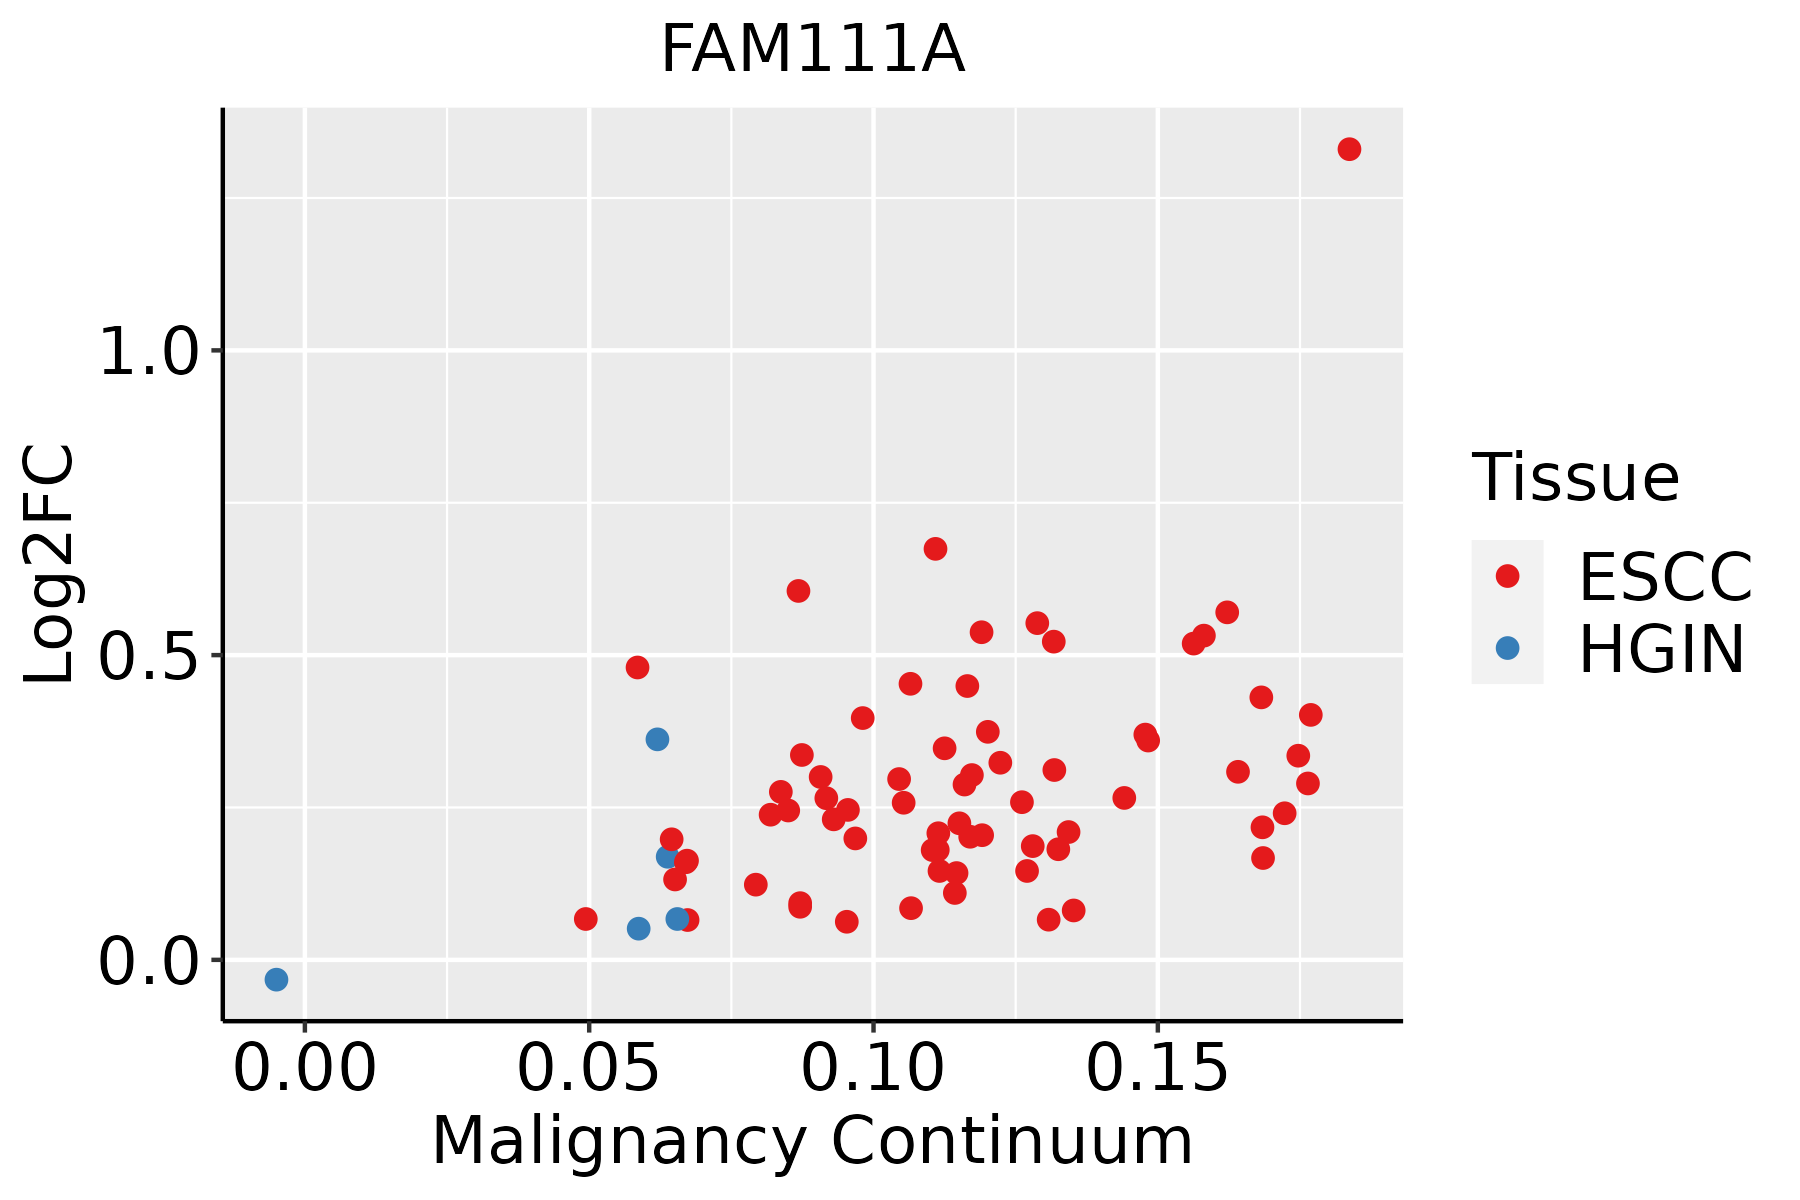 | ESCC: Esophageal squamous cell carcinoma |
| HGIN: High-grade intraepithelial neoplasias | ||
| LGIN: Low-grade intraepithelial neoplasias | ||
| Oral Cavity | 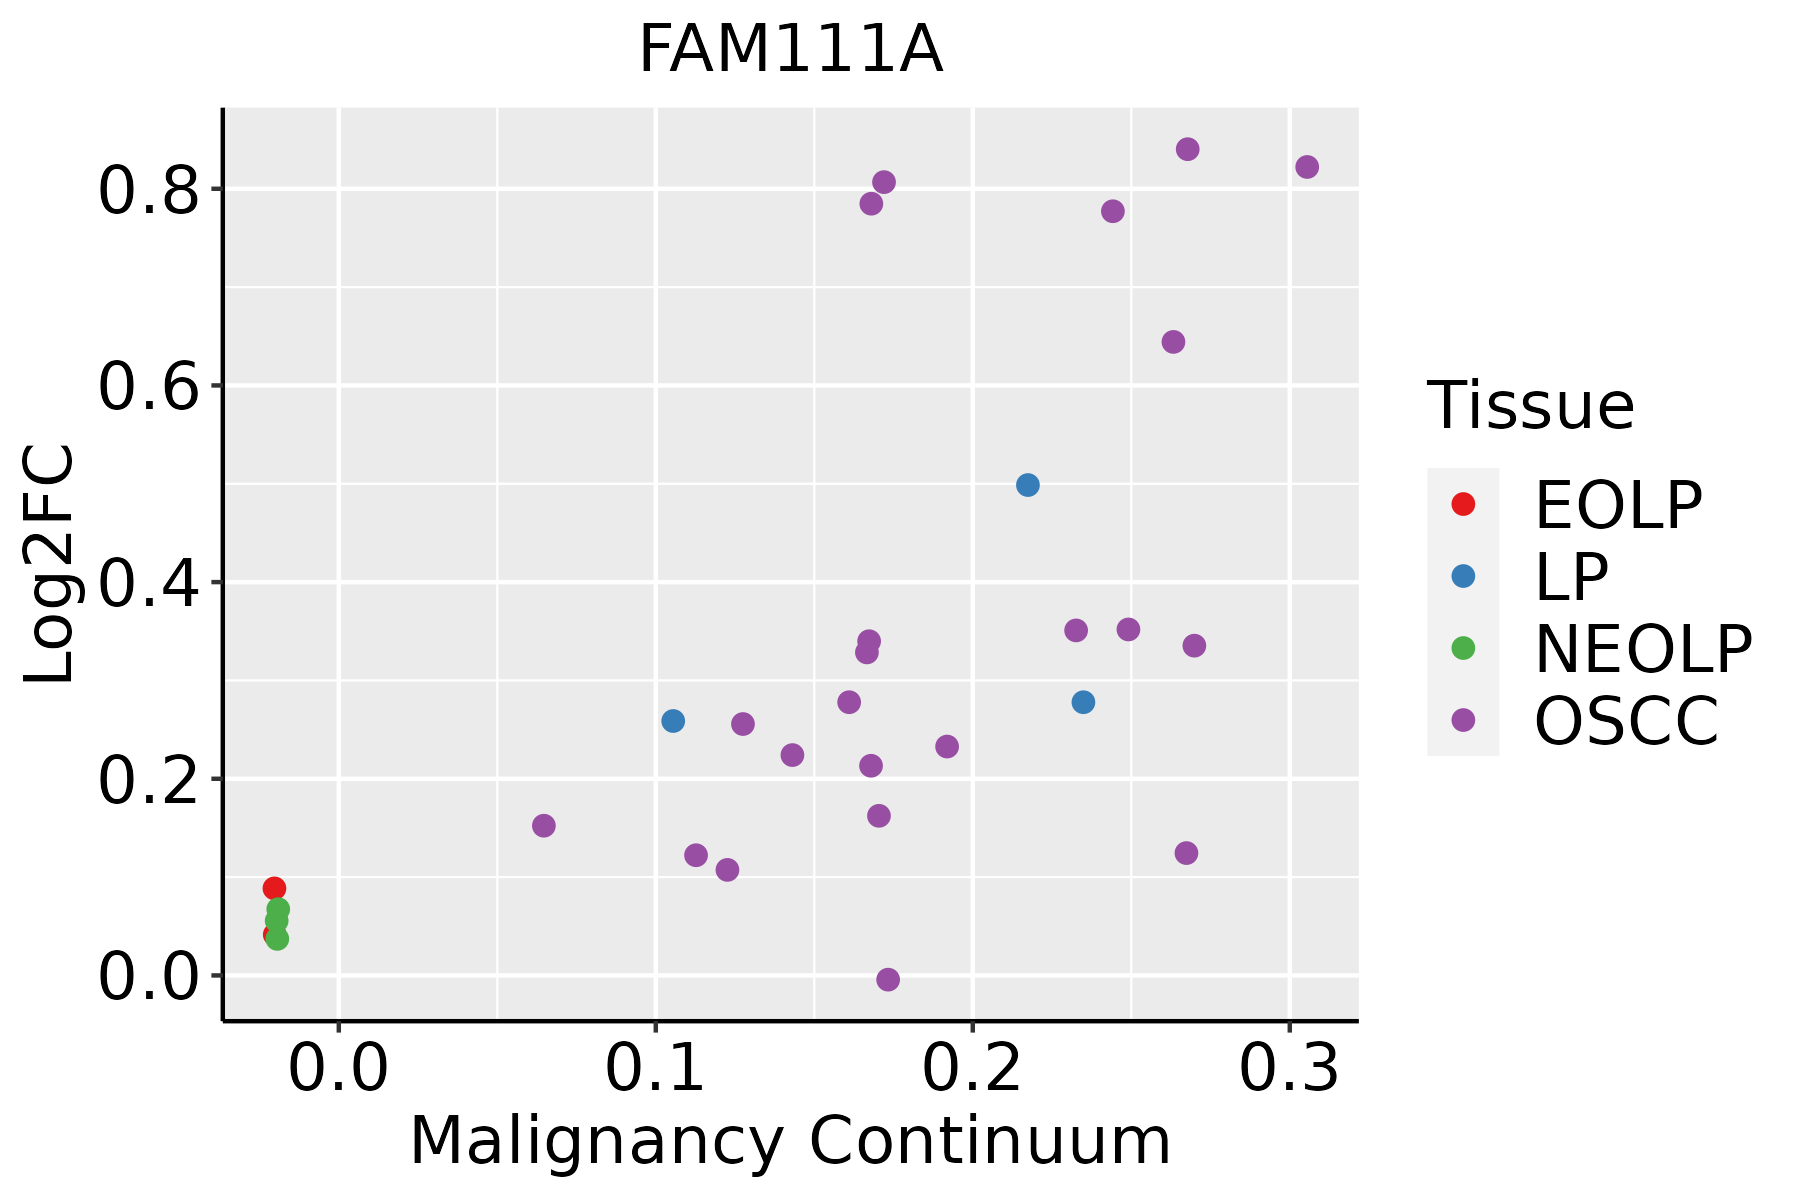 | EOLP: Erosive Oral lichen planus |
| LP: leukoplakia | ||
| NEOLP: Non-erosive oral lichen planus | ||
| OSCC: Oral squamous cell carcinoma | ||
| Prostate |  | BPH: Benign Prostatic Hyperplasia |
| Skin |  | AK: Actinic keratosis |
| cSCC: Cutaneous squamous cell carcinoma | ||
| SCCIS:squamous cell carcinoma in situ | ||
| Thyroid | 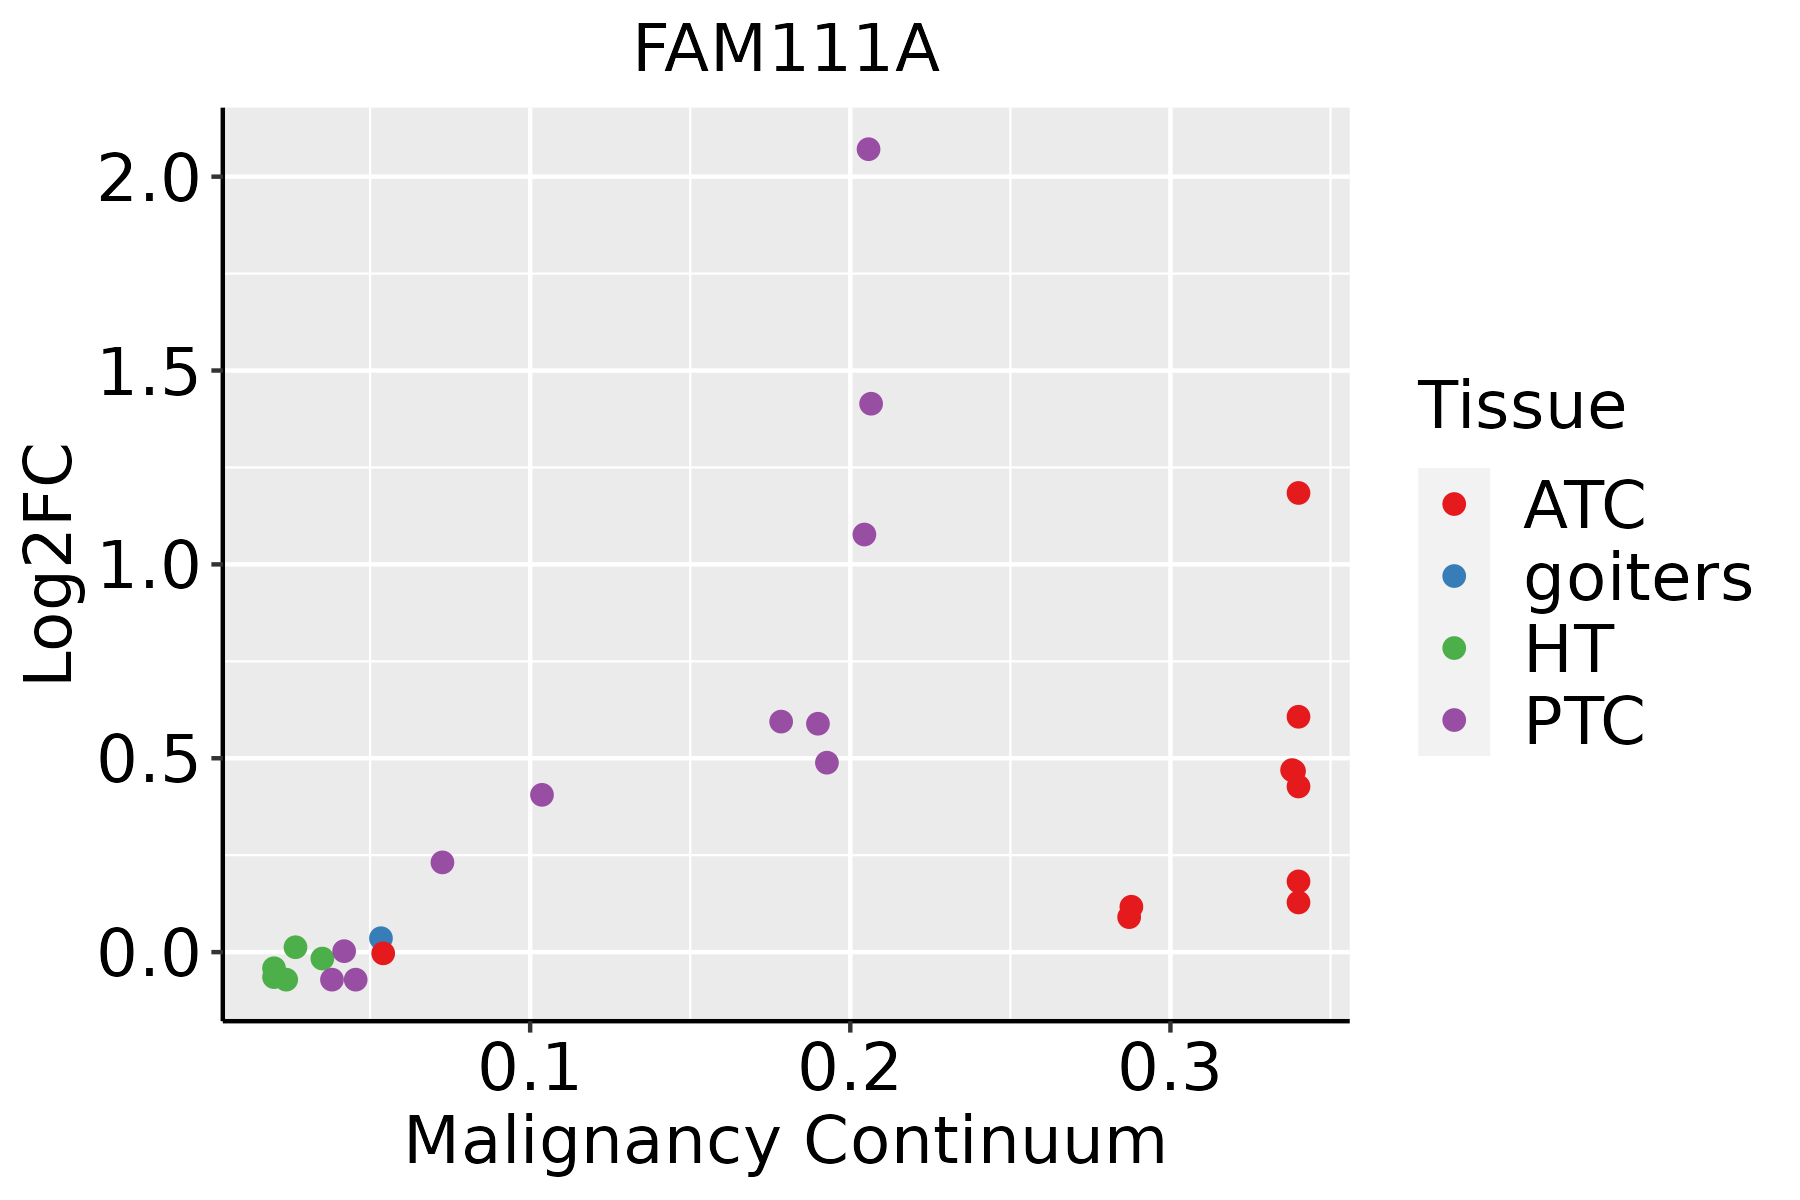 | ATC: Anaplastic thyroid cancer |
| HT: Hashimoto's thyroiditis | ||
| PTC: Papillary thyroid cancer |
| ∗log2FC in expression of this searched gene in stem-like cells from each diseased tissue sample relative to stem-like cells in normal samples in each tissue plotted against the malignancy continuum. Samples are colored based on if they are from different disease stage. |
Top |
Malignant transformation related pathway analysis |
| Find out the enriched GO biological processes and KEGG pathways involved in transition from healthy to precancer to cancer |
| Tissue | Disease Stage | Enriched GO biological Processes |
| Colorectum | AD |  |
| Colorectum | SER |  |
| Colorectum | MSS |  |
| Colorectum | MSI-H |  |
| Colorectum | FAP |  |
| ∗Top 15 enriched GO BP terms are showed in the bar plot of each disease state in each tissue. Each row represents a significant GO biological process which is colored according to the -log10(p.adjust). |
| Page: 1 2 3 4 5 6 7 8 9 |
| GO ID | Tissue | Disease Stage | Description | Gene Ratio | Bg Ratio | pvalue | p.adjust | Count |
| GO:001603227 | Esophagus | HGIN | viral process | 118/2587 | 415/18723 | 3.01e-15 | 6.22e-13 | 118 |
| GO:001905827 | Esophagus | HGIN | viral life cycle | 93/2587 | 317/18723 | 3.66e-13 | 5.63e-11 | 93 |
| GO:001907926 | Esophagus | HGIN | viral genome replication | 48/2587 | 131/18723 | 4.65e-11 | 5.07e-09 | 48 |
| GO:005079225 | Esophagus | HGIN | regulation of viral process | 50/2587 | 164/18723 | 2.53e-08 | 1.49e-06 | 50 |
| GO:004506919 | Esophagus | HGIN | regulation of viral genome replication | 32/2587 | 85/18723 | 3.61e-08 | 2.04e-06 | 32 |
| GO:190390025 | Esophagus | HGIN | regulation of viral life cycle | 45/2587 | 148/18723 | 1.36e-07 | 6.78e-06 | 45 |
| GO:005160417 | Esophagus | HGIN | protein maturation | 68/2587 | 294/18723 | 9.77e-06 | 2.86e-04 | 68 |
| GO:00450718 | Esophagus | HGIN | negative regulation of viral genome replication | 19/2587 | 56/18723 | 1.10e-04 | 2.33e-03 | 19 |
| GO:004852510 | Esophagus | HGIN | negative regulation of viral process | 25/2587 | 92/18723 | 5.41e-04 | 7.71e-03 | 25 |
| GO:00164857 | Esophagus | HGIN | protein processing | 49/2587 | 225/18723 | 7.04e-04 | 9.52e-03 | 49 |
| GO:0016032111 | Esophagus | ESCC | viral process | 301/8552 | 415/18723 | 3.34e-29 | 1.32e-26 | 301 |
| GO:0019058111 | Esophagus | ESCC | viral life cycle | 226/8552 | 317/18723 | 1.17e-20 | 1.76e-18 | 226 |
| GO:00062604 | Esophagus | ESCC | DNA replication | 181/8552 | 260/18723 | 3.55e-15 | 2.05e-13 | 181 |
| GO:0019079111 | Esophagus | ESCC | viral genome replication | 102/8552 | 131/18723 | 4.31e-14 | 2.19e-12 | 102 |
| GO:0050792111 | Esophagus | ESCC | regulation of viral process | 119/8552 | 164/18723 | 2.19e-12 | 9.03e-11 | 119 |
| GO:005160418 | Esophagus | ESCC | protein maturation | 189/8552 | 294/18723 | 7.64e-11 | 2.39e-09 | 189 |
| GO:1903900111 | Esophagus | ESCC | regulation of viral life cycle | 106/8552 | 148/18723 | 1.26e-10 | 3.72e-09 | 106 |
| GO:0045069110 | Esophagus | ESCC | regulation of viral genome replication | 67/8552 | 85/18723 | 3.81e-10 | 1.04e-08 | 67 |
| GO:00062612 | Esophagus | ESCC | DNA-dependent DNA replication | 100/8552 | 151/18723 | 2.61e-07 | 3.94e-06 | 100 |
| GO:004852516 | Esophagus | ESCC | negative regulation of viral process | 66/8552 | 92/18723 | 3.49e-07 | 4.88e-06 | 66 |
| Page: 1 2 3 4 5 |
| Pathway ID | Tissue | Disease Stage | Description | Gene Ratio | Bg Ratio | pvalue | p.adjust | qvalue | Count |
| Page: 1 |
Top |
Cell-cell communication analysis |
| Identification of potential cell-cell interactions between two cell types and their ligand-receptor pairs for different disease states |
| Ligand | Receptor | LRpair | Pathway | Tissue | Disease Stage |
| Page: 1 |
Top |
Single-cell gene regulatory network inference analysis |
| Find out the significant the regulons (TFs) and the target genes of each regulon across cell types for different disease states |
| TF | Cell Type | Tissue | Disease Stage | Target Gene | RSS | Regulon Activity |
| ∗The dot plots of a searched regulon are shown for all cell subpopulations in each disease state of each tissue based on the regulon specific score inferred using pySCENIC and by calculating the average expression. |
| Page: 1 |
Top |
Somatic mutation of malignant transformation related genes |
| Annotation of somatic variants for genes involved in malignant transformation |
| Hugo Symbol | Variant Class | Variant Classification | dbSNP RS | HGVSc | HGVSp | HGVSp Short | SWISSPROT | BIOTYPE | SIFT | PolyPhen | Tumor Sample Barcode | Tissue | Histology | Sex | Age | Stage | Therapy Types | Drugs | Outcome |
| FAM111A | SNV | Missense_Mutation | c.1519N>A | p.Glu507Lys | p.E507K | Q96PZ2 | protein_coding | tolerated(0.23) | benign(0.062) | TCGA-A1-A0SH-01 | Breast | breast invasive carcinoma | Female | <65 | I/II | Chemotherapy | tc | SD | |
| FAM111A | SNV | Missense_Mutation | rs748840540 | c.1028N>T | p.Ser343Leu | p.S343L | Q96PZ2 | protein_coding | tolerated(0.39) | benign(0) | TCGA-AN-A046-01 | Breast | breast invasive carcinoma | Female | >=65 | I/II | Unknown | Unknown | SD |
| FAM111A | SNV | Missense_Mutation | c.697T>C | p.Ser233Pro | p.S233P | Q96PZ2 | protein_coding | tolerated(0.41) | benign(0.003) | TCGA-D8-A1J8-01 | Breast | breast invasive carcinoma | Female | >=65 | I/II | Hormone Therapy | nolvadex | SD | |
| FAM111A | SNV | Missense_Mutation | rs187676082 | c.625N>T | p.Arg209Cys | p.R209C | Q96PZ2 | protein_coding | tolerated(0.2) | benign(0) | TCGA-E2-A1IO-01 | Breast | breast invasive carcinoma | Female | <65 | I/II | Chemotherapy | docetaxel | SD |
| FAM111A | SNV | Missense_Mutation | c.1481N>G | p.Ala494Gly | p.A494G | Q96PZ2 | protein_coding | tolerated(0.38) | benign(0.001) | TCGA-EW-A1PD-01 | Breast | breast invasive carcinoma | Male | <65 | I/II | Chemotherapy | docetaxel | SD | |
| FAM111A | insertion | Frame_Shift_Ins | novel | c.774_775insATCTCATTCCAAGTTTCTTTCCTCAGCTCTATCCTCACCAC | p.Leu259IlefsTer15 | p.L259Ifs*15 | Q96PZ2 | protein_coding | TCGA-A8-A09W-01 | Breast | breast invasive carcinoma | Female | >=65 | III/IV | Unknown | Unknown | SD | ||
| FAM111A | SNV | Missense_Mutation | c.1294N>C | p.Glu432Gln | p.E432Q | Q96PZ2 | protein_coding | deleterious(0.04) | probably_damaging(0.964) | TCGA-C5-A1BQ-01 | Cervix | cervical & endocervical cancer | Female | >=65 | III/IV | Chemotherapy | cisplatin | CR | |
| FAM111A | SNV | Missense_Mutation | c.1818N>A | p.Met606Ile | p.M606I | Q96PZ2 | protein_coding | tolerated(0.41) | benign(0) | TCGA-C5-A1MH-01 | Cervix | cervical & endocervical cancer | Female | >=65 | III/IV | Chemotherapy | cisplatin | PD | |
| FAM111A | SNV | Missense_Mutation | c.1172N>C | p.Val391Ala | p.V391A | Q96PZ2 | protein_coding | tolerated(0.08) | possibly_damaging(0.873) | TCGA-EA-A78R-01 | Cervix | cervical & endocervical cancer | Female | <65 | I/II | Unknown | Unknown | SD | |
| FAM111A | SNV | Missense_Mutation | c.1003N>T | p.Gly335Trp | p.G335W | Q96PZ2 | protein_coding | deleterious(0) | benign(0.104) | TCGA-EX-A69M-01 | Cervix | cervical & endocervical cancer | Female | <65 | I/II | Unknown | Unknown | PD |
| Page: 1 2 3 4 5 6 7 |
Top |
Related drugs of malignant transformation related genes |
| Identification of chemicals and drugs interact with genes involved in malignant transfromation |
| (DGIdb 4.0) |
| Entrez ID | Symbol | Category | Interaction Types | Drug Claim Name | Drug Name | PMIDs |
| Page: 1 |

Copyright 2023-Present -The University of Texas Health Science Center at Houston |