
|
|||||
|
 | |
| |
| |
| |
| |
| |
|
Gene: FAM110C |
Gene summary for FAM110C |
| Gene information | Species | Human | Gene symbol | FAM110C | Gene ID | 642273 |
| Gene name | family with sequence similarity 110 member C | |
| Gene Alias | FAM110C | |
| Cytomap | 2p25.3 | |
| Gene Type | protein-coding | GO ID | GO:0006928 | UniProtAcc | Q1W6H9 |
Top |
Malignant transformation analysis |
| Identification of the aberrant gene expression in precancerous and cancerous lesions by comparing the gene expression of stem-like cells in diseased tissues with normal stem cells |
| Entrez ID | Symbol | Replicates | Species | Organ | Tissue | Adj P-value | Log2FC | Malignancy |
| 642273 | FAM110C | LZE4T | Human | Esophagus | ESCC | 9.86e-11 | -4.30e-01 | 0.0811 |
| 642273 | FAM110C | LZE8T | Human | Esophagus | ESCC | 1.98e-06 | -6.10e-01 | 0.067 |
| 642273 | FAM110C | LZE20T | Human | Esophagus | ESCC | 4.65e-10 | -5.76e-01 | 0.0662 |
| 642273 | FAM110C | LZE22D1 | Human | Esophagus | HGIN | 4.30e-03 | -6.51e-01 | 0.0595 |
| 642273 | FAM110C | LZE24T | Human | Esophagus | ESCC | 1.69e-09 | -1.71e-01 | 0.0596 |
| 642273 | FAM110C | LZE21T | Human | Esophagus | ESCC | 5.32e-10 | -3.73e-01 | 0.0655 |
| 642273 | FAM110C | LZE6T | Human | Esophagus | ESCC | 3.81e-04 | -6.54e-01 | 0.0845 |
| 642273 | FAM110C | P1T-E | Human | Esophagus | ESCC | 1.93e-02 | -3.77e-01 | 0.0875 |
| 642273 | FAM110C | P2T-E | Human | Esophagus | ESCC | 4.60e-19 | -6.02e-01 | 0.1177 |
| 642273 | FAM110C | P4T-E | Human | Esophagus | ESCC | 2.84e-20 | -4.06e-01 | 0.1323 |
| 642273 | FAM110C | P5T-E | Human | Esophagus | ESCC | 6.20e-25 | -5.69e-01 | 0.1327 |
| 642273 | FAM110C | P8T-E | Human | Esophagus | ESCC | 8.44e-15 | -5.39e-01 | 0.0889 |
| 642273 | FAM110C | P9T-E | Human | Esophagus | ESCC | 2.24e-17 | -5.10e-01 | 0.1131 |
| 642273 | FAM110C | P10T-E | Human | Esophagus | ESCC | 6.15e-20 | -6.59e-01 | 0.116 |
| 642273 | FAM110C | P12T-E | Human | Esophagus | ESCC | 2.21e-21 | -6.21e-01 | 0.1122 |
| 642273 | FAM110C | P15T-E | Human | Esophagus | ESCC | 2.07e-20 | -4.31e-01 | 0.1149 |
| 642273 | FAM110C | P16T-E | Human | Esophagus | ESCC | 9.74e-22 | -6.67e-01 | 0.1153 |
| 642273 | FAM110C | P17T-E | Human | Esophagus | ESCC | 1.53e-04 | -5.15e-01 | 0.1278 |
| 642273 | FAM110C | P20T-E | Human | Esophagus | ESCC | 2.63e-16 | -5.20e-01 | 0.1124 |
| 642273 | FAM110C | P21T-E | Human | Esophagus | ESCC | 1.19e-23 | -5.16e-01 | 0.1617 |
| Page: 1 2 3 4 5 |
| Tissue | Expression Dynamics | Abbreviation |
| Esophagus | 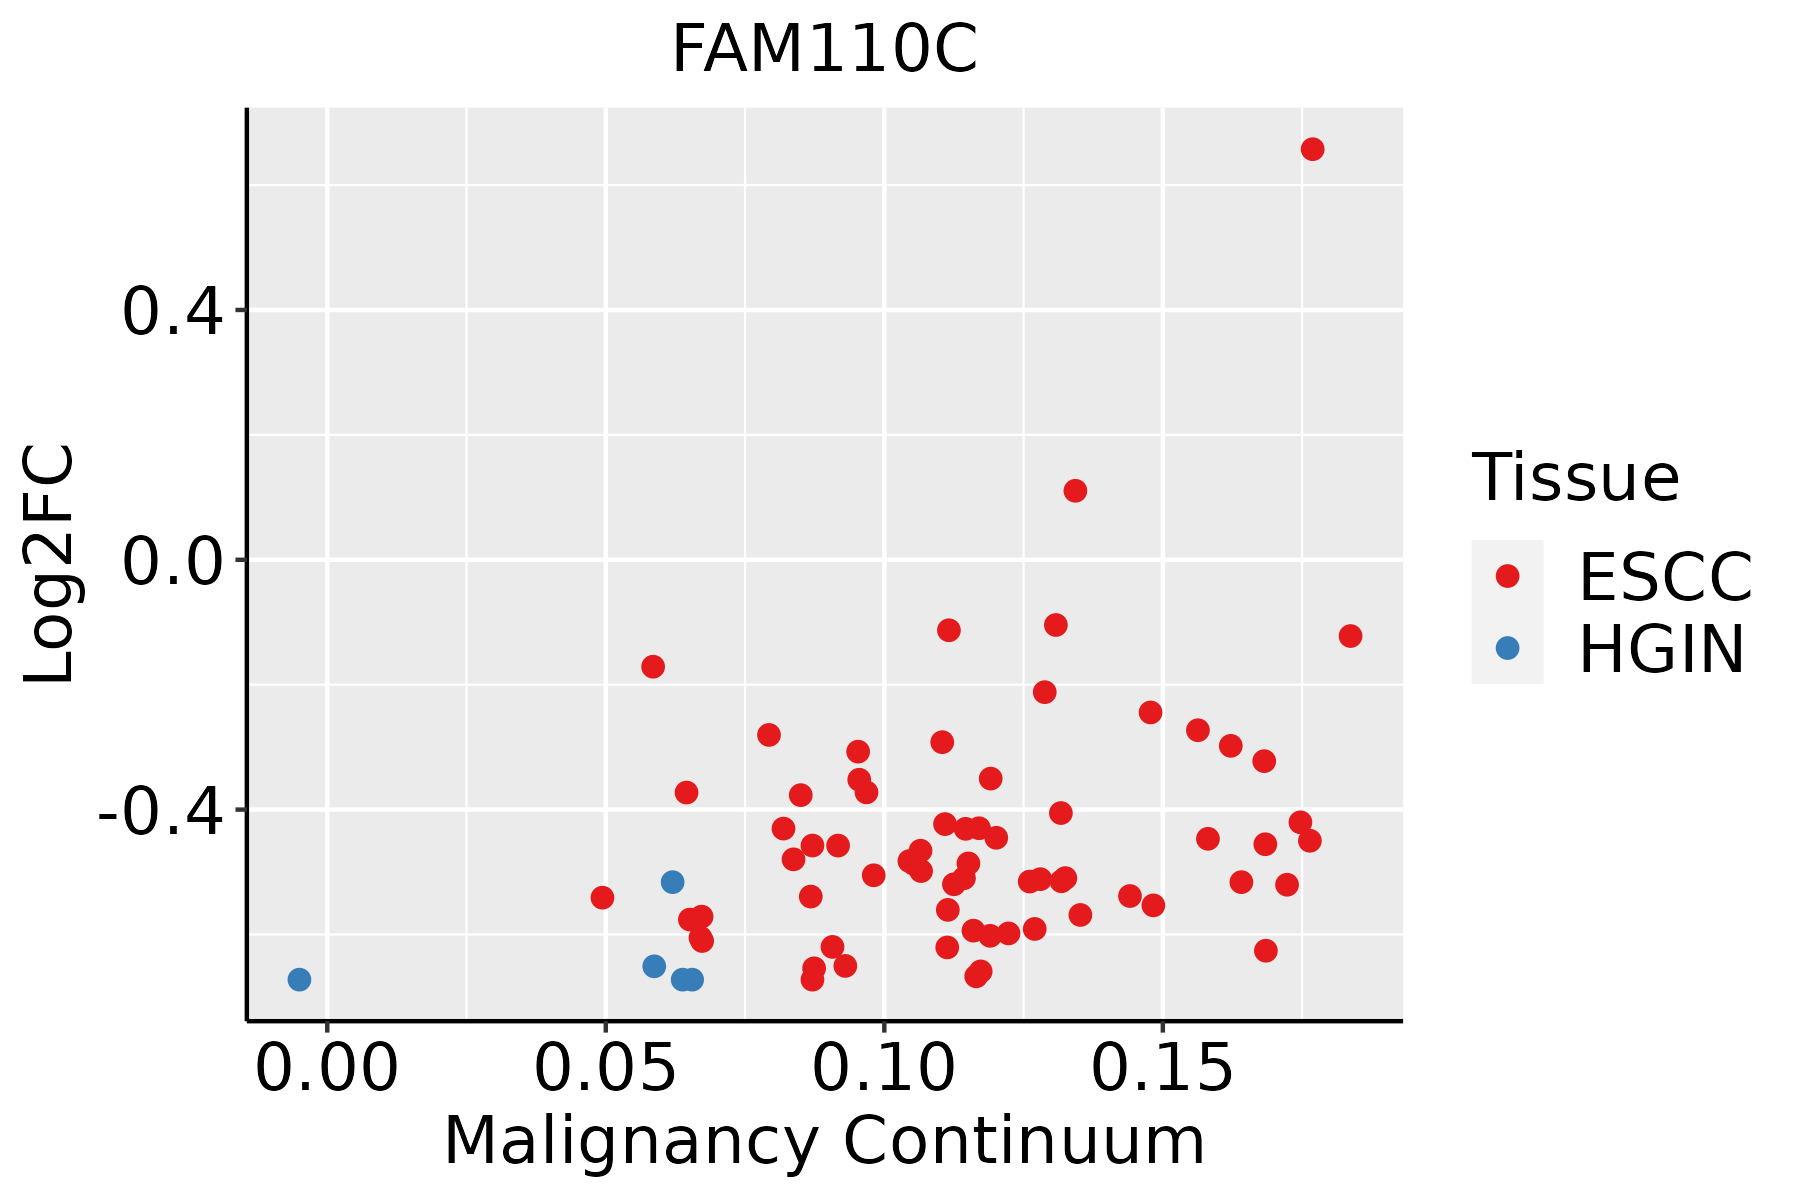 | ESCC: Esophageal squamous cell carcinoma |
| HGIN: High-grade intraepithelial neoplasias | ||
| LGIN: Low-grade intraepithelial neoplasias | ||
| Oral Cavity |  | EOLP: Erosive Oral lichen planus |
| LP: leukoplakia | ||
| NEOLP: Non-erosive oral lichen planus | ||
| OSCC: Oral squamous cell carcinoma | ||
| Prostate |  | BPH: Benign Prostatic Hyperplasia |
| Skin |  | AK: Actinic keratosis |
| cSCC: Cutaneous squamous cell carcinoma | ||
| SCCIS:squamous cell carcinoma in situ |
| ∗log2FC in expression of this searched gene in stem-like cells from each diseased tissue sample relative to stem-like cells in normal samples in each tissue plotted against the malignancy continuum. Samples are colored based on if they are from different disease stage. |
Top |
Malignant transformation related pathway analysis |
| Find out the enriched GO biological processes and KEGG pathways involved in transition from healthy to precancer to cancer |
| Tissue | Disease Stage | Enriched GO biological Processes |
| Colorectum | AD |  |
| Colorectum | SER |  |
| Colorectum | MSS |  |
| Colorectum | MSI-H |  |
| Colorectum | FAP |  |
| ∗Top 15 enriched GO BP terms are showed in the bar plot of each disease state in each tissue. Each row represents a significant GO biological process which is colored according to the -log10(p.adjust). |
| Page: 1 2 3 4 5 6 7 8 9 |
| GO ID | Tissue | Disease Stage | Description | Gene Ratio | Bg Ratio | pvalue | p.adjust | Count |
| GO:006049117 | Esophagus | HGIN | regulation of cell projection assembly | 39/2587 | 188/18723 | 5.61e-03 | 4.57e-02 | 39 |
| GO:006049118 | Esophagus | ESCC | regulation of cell projection assembly | 110/8552 | 188/18723 | 2.60e-04 | 1.58e-03 | 110 |
| GO:006049110 | Oral cavity | OSCC | regulation of cell projection assembly | 100/7305 | 188/18723 | 5.27e-05 | 4.38e-04 | 100 |
| GO:00434916 | Oral cavity | OSCC | protein kinase B signaling | 103/7305 | 211/18723 | 2.29e-03 | 1.02e-02 | 103 |
| GO:00518976 | Oral cavity | OSCC | positive regulation of protein kinase B signaling | 61/7305 | 120/18723 | 5.52e-03 | 2.14e-02 | 61 |
| GO:00518967 | Oral cavity | OSCC | regulation of protein kinase B signaling | 88/7305 | 185/18723 | 1.07e-02 | 3.64e-02 | 88 |
| GO:006049116 | Oral cavity | LP | regulation of cell projection assembly | 66/4623 | 188/18723 | 8.62e-04 | 7.49e-03 | 66 |
| GO:00518975 | Prostate | BPH | positive regulation of protein kinase B signaling | 38/3107 | 120/18723 | 3.37e-05 | 3.77e-04 | 38 |
| GO:00434915 | Prostate | BPH | protein kinase B signaling | 58/3107 | 211/18723 | 4.33e-05 | 4.58e-04 | 58 |
| GO:00518966 | Prostate | BPH | regulation of protein kinase B signaling | 51/3107 | 185/18723 | 1.12e-04 | 1.02e-03 | 51 |
| GO:00604919 | Prostate | BPH | regulation of cell projection assembly | 51/3107 | 188/18723 | 1.73e-04 | 1.48e-03 | 51 |
| GO:005189713 | Prostate | Tumor | positive regulation of protein kinase B signaling | 39/3246 | 120/18723 | 3.81e-05 | 4.41e-04 | 39 |
| GO:004349114 | Prostate | Tumor | protein kinase B signaling | 60/3246 | 211/18723 | 4.05e-05 | 4.62e-04 | 60 |
| GO:005189613 | Prostate | Tumor | regulation of protein kinase B signaling | 54/3246 | 185/18723 | 4.44e-05 | 5.02e-04 | 54 |
| GO:006049115 | Prostate | Tumor | regulation of cell projection assembly | 52/3246 | 188/18723 | 2.71e-04 | 2.24e-03 | 52 |
| GO:0060491110 | Skin | cSCC | regulation of cell projection assembly | 65/4864 | 188/18723 | 5.34e-03 | 2.69e-02 | 65 |
| Page: 1 |
| Pathway ID | Tissue | Disease Stage | Description | Gene Ratio | Bg Ratio | pvalue | p.adjust | qvalue | Count |
| Page: 1 |
Top |
Cell-cell communication analysis |
| Identification of potential cell-cell interactions between two cell types and their ligand-receptor pairs for different disease states |
| Ligand | Receptor | LRpair | Pathway | Tissue | Disease Stage |
| Page: 1 |
Top |
Single-cell gene regulatory network inference analysis |
| Find out the significant the regulons (TFs) and the target genes of each regulon across cell types for different disease states |
| TF | Cell Type | Tissue | Disease Stage | Target Gene | RSS | Regulon Activity |
| ∗The dot plots of a searched regulon are shown for all cell subpopulations in each disease state of each tissue based on the regulon specific score inferred using pySCENIC and by calculating the average expression. |
| Page: 1 |
Top |
Somatic mutation of malignant transformation related genes |
| Annotation of somatic variants for genes involved in malignant transformation |
| Hugo Symbol | Variant Class | Variant Classification | dbSNP RS | HGVSc | HGVSp | HGVSp Short | SWISSPROT | BIOTYPE | SIFT | PolyPhen | Tumor Sample Barcode | Tissue | Histology | Sex | Age | Stage | Therapy Types | Drugs | Outcome |
| FAM110C | SNV | Missense_Mutation | novel | c.734N>T | p.Thr245Ile | p.T245I | Q1W6H9 | protein_coding | deleterious(0.01) | benign(0.089) | TCGA-5M-AAT6-01 | Colorectum | colon adenocarcinoma | Female | <65 | III/IV | Unknown | Unknown | PD |
| FAM110C | SNV | Missense_Mutation | novel | c.831A>G | p.Ile277Met | p.I277M | Q1W6H9 | protein_coding | tolerated(0.18) | benign(0.006) | TCGA-AA-3984-01 | Colorectum | colon adenocarcinoma | Female | <65 | I/II | Unknown | Unknown | SD |
| FAM110C | SNV | Missense_Mutation | c.912G>T | p.Lys304Asn | p.K304N | Q1W6H9 | protein_coding | deleterious(0.03) | possibly_damaging(0.711) | TCGA-AD-5900-01 | Colorectum | colon adenocarcinoma | Male | >=65 | I/II | Unknown | Unknown | SD | |
| FAM110C | SNV | Missense_Mutation | novel | c.875N>A | p.Arg292His | p.R292H | Q1W6H9 | protein_coding | deleterious(0) | probably_damaging(1) | TCGA-AZ-4315-01 | Colorectum | colon adenocarcinoma | Male | <65 | I/II | Unknown | Unknown | SD |
| FAM110C | SNV | Missense_Mutation | c.327N>A | p.Phe109Leu | p.F109L | Q1W6H9 | protein_coding | tolerated(0.38) | benign(0.001) | TCGA-CA-6718-01 | Colorectum | colon adenocarcinoma | Male | <65 | I/II | Unknown | Unknown | PD | |
| FAM110C | SNV | Missense_Mutation | c.797N>A | p.Gly266Asp | p.G266D | Q1W6H9 | protein_coding | tolerated(0.11) | benign(0.053) | TCGA-F4-6570-01 | Colorectum | colon adenocarcinoma | Female | >=65 | I/II | Unknown | Unknown | SD | |
| FAM110C | SNV | Missense_Mutation | c.845N>T | p.Ser282Ile | p.S282I | Q1W6H9 | protein_coding | deleterious(0) | possibly_damaging(0.868) | TCGA-AP-A0LM-01 | Endometrium | uterine corpus endometrioid carcinoma | Female | <65 | III/IV | Chemotherapy | cisplatin | SD | |
| FAM110C | SNV | Missense_Mutation | novel | c.835N>A | p.Gln279Lys | p.Q279K | Q1W6H9 | protein_coding | tolerated(0.12) | probably_damaging(0.931) | TCGA-EY-A1GX-01 | Endometrium | uterine corpus endometrioid carcinoma | Female | >=65 | III/IV | Unknown | Unknown | PD |
| FAM110C | SNV | Missense_Mutation | novel | c.772A>G | p.Ser258Gly | p.S258G | Q1W6H9 | protein_coding | tolerated(0.15) | benign(0.015) | TCGA-55-8506-01 | Lung | lung adenocarcinoma | Female | <65 | I/II | Unknown | Unknown | SD |
| FAM110C | SNV | Missense_Mutation | c.265N>C | p.Ala89Pro | p.A89P | Q1W6H9 | protein_coding | tolerated(0.08) | benign(0.013) | TCGA-BR-8683-01 | Stomach | stomach adenocarcinoma | Male | >=65 | III/IV | Unknown | Unknown | SD |
| Page: 1 2 |
Top |
Related drugs of malignant transformation related genes |
| Identification of chemicals and drugs interact with genes involved in malignant transfromation |
| (DGIdb 4.0) |
| Entrez ID | Symbol | Category | Interaction Types | Drug Claim Name | Drug Name | PMIDs |
| Page: 1 |

Copyright 2023-Present -The University of Texas Health Science Center at Houston |