
|
|||||
|
 | |
| |
| |
| |
| |
| |
|
Gene: FAM110B |
Gene summary for FAM110B |
| Gene information | Species | Human | Gene symbol | FAM110B | Gene ID | 90362 |
| Gene name | family with sequence similarity 110 member B | |
| Gene Alias | C8orf72 | |
| Cytomap | 8q12.1 | |
| Gene Type | protein-coding | GO ID | GO:0005575 | UniProtAcc | A0A024R7V5 |
Top |
Malignant transformation analysis |
| Identification of the aberrant gene expression in precancerous and cancerous lesions by comparing the gene expression of stem-like cells in diseased tissues with normal stem cells |
| Entrez ID | Symbol | Replicates | Species | Organ | Tissue | Adj P-value | Log2FC | Malignancy |
| 90362 | FAM110B | NAFLD1 | Human | Liver | NAFLD | 1.40e-02 | 4.46e-01 | -0.04 |
| 90362 | FAM110B | HCC1_Meng | Human | Liver | HCC | 6.37e-12 | -1.15e-01 | 0.0246 |
| 90362 | FAM110B | HCC2_Meng | Human | Liver | HCC | 3.93e-03 | -1.31e-01 | 0.0107 |
| 90362 | FAM110B | S014 | Human | Liver | HCC | 1.95e-06 | 5.24e-01 | 0.2254 |
| 90362 | FAM110B | S015 | Human | Liver | HCC | 3.84e-10 | 6.82e-01 | 0.2375 |
| 90362 | FAM110B | S016 | Human | Liver | HCC | 4.86e-08 | 5.55e-01 | 0.2243 |
| 90362 | FAM110B | 047563_1562-all-cells | Human | Prostate | BPH | 2.31e-02 | 1.76e-01 | 0.0791 |
| 90362 | FAM110B | 048752_1579-all-cells | Human | Prostate | BPH | 1.41e-21 | 6.05e-01 | 0.1008 |
| 90362 | FAM110B | 052095_1628-all-cells | Human | Prostate | BPH | 1.03e-03 | 2.76e-01 | 0.1032 |
| 90362 | FAM110B | 052097_1595-all-cells | Human | Prostate | BPH | 1.45e-13 | 5.43e-01 | 0.0972 |
| 90362 | FAM110B | 052099_1652-all-cells | Human | Prostate | BPH | 7.95e-15 | 5.82e-01 | 0.1038 |
| 90362 | FAM110B | Dong_P1 | Human | Prostate | Tumor | 5.25e-06 | 6.40e-02 | 0.035 |
| 90362 | FAM110B | Dong_P4 | Human | Prostate | Tumor | 1.11e-04 | 2.14e-01 | 0.0292 |
| 90362 | FAM110B | male-WTA | Human | Thyroid | PTC | 5.30e-12 | 1.03e-01 | 0.1037 |
| 90362 | FAM110B | PTC01 | Human | Thyroid | PTC | 2.26e-10 | 1.22e-01 | 0.1899 |
| 90362 | FAM110B | PTC04 | Human | Thyroid | PTC | 6.67e-04 | 4.62e-02 | 0.1927 |
| 90362 | FAM110B | PTC05 | Human | Thyroid | PTC | 5.49e-12 | 6.83e-01 | 0.2065 |
| 90362 | FAM110B | PTC06 | Human | Thyroid | PTC | 6.72e-11 | 3.29e-01 | 0.2057 |
| 90362 | FAM110B | PTC07 | Human | Thyroid | PTC | 5.18e-13 | 2.34e-01 | 0.2044 |
| 90362 | FAM110B | ATC13 | Human | Thyroid | ATC | 4.06e-31 | 7.61e-01 | 0.34 |
| Page: 1 2 |
| Tissue | Expression Dynamics | Abbreviation |
| Liver |  | HCC: Hepatocellular carcinoma |
| NAFLD: Non-alcoholic fatty liver disease | ||
| Prostate | 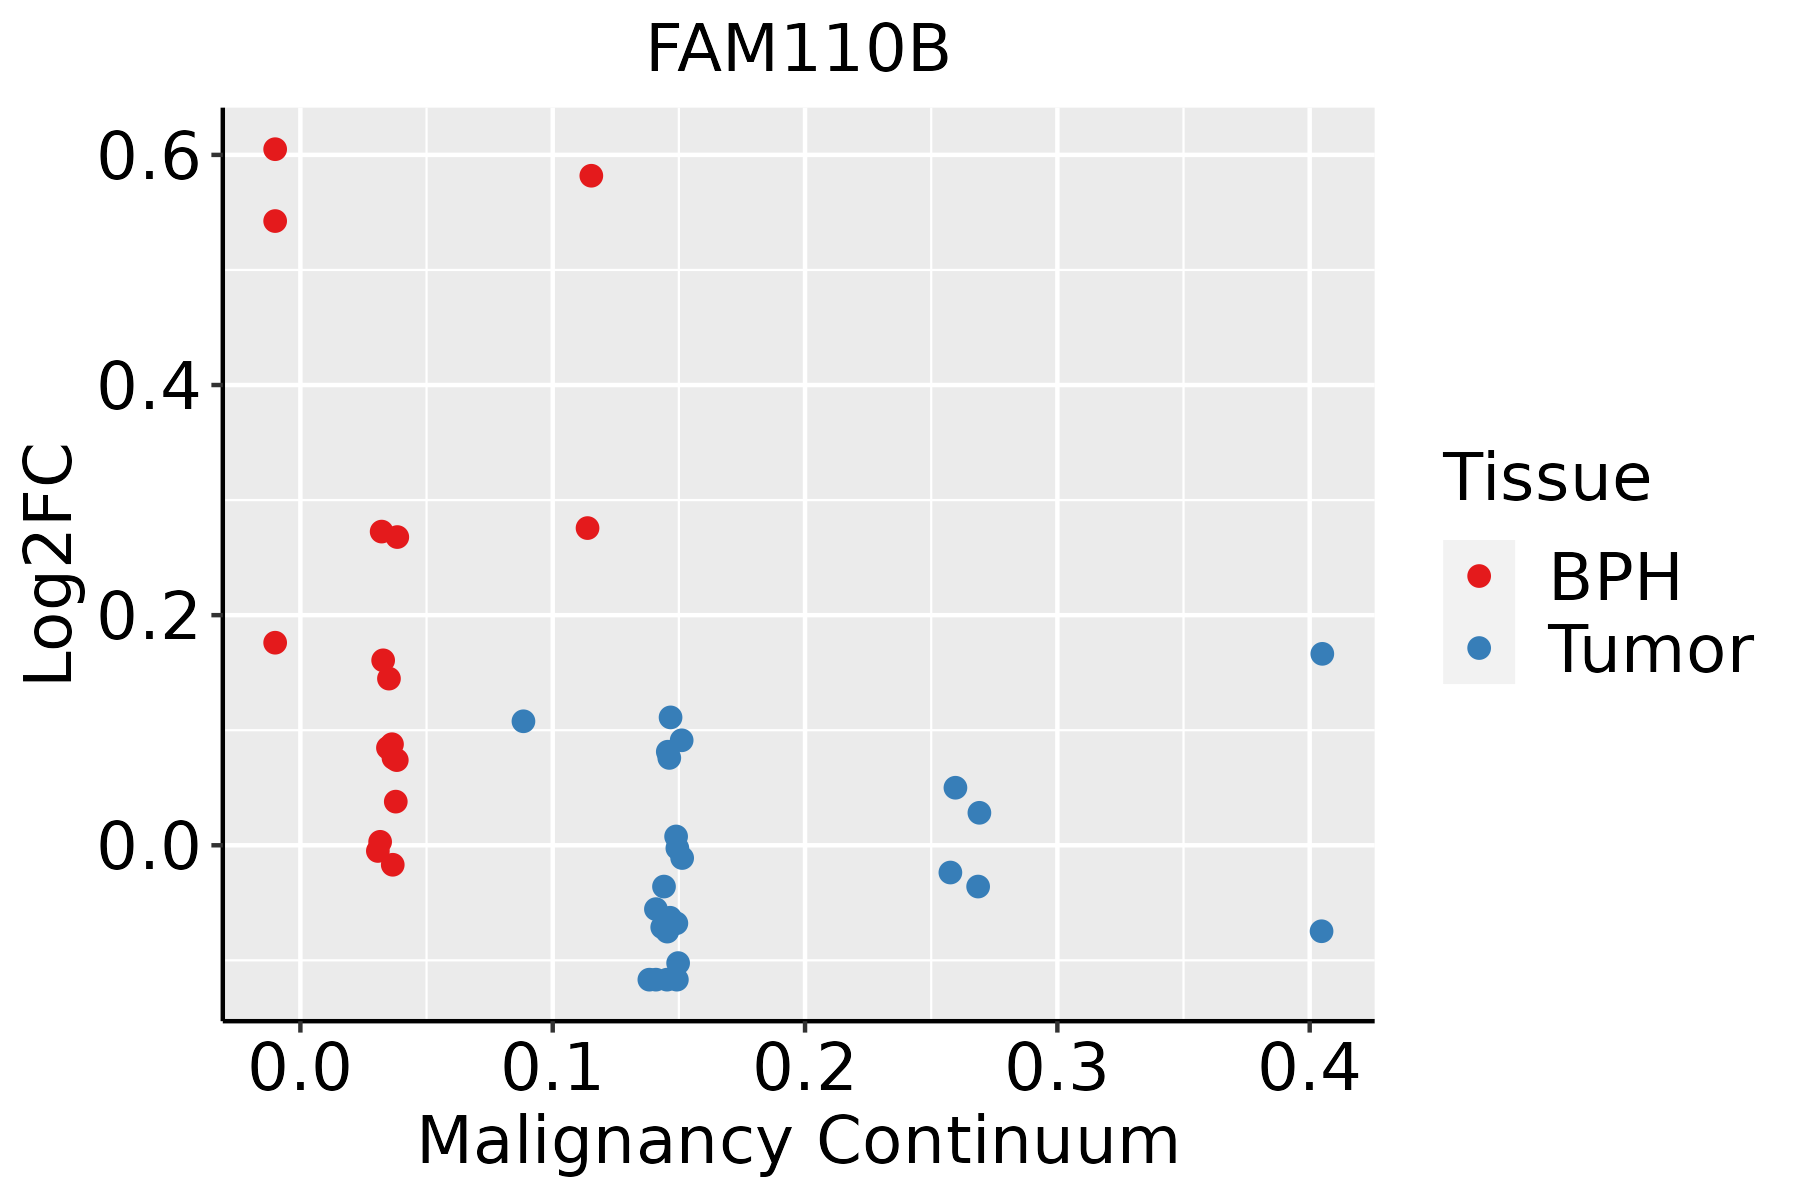 | BPH: Benign Prostatic Hyperplasia |
| Thyroid | 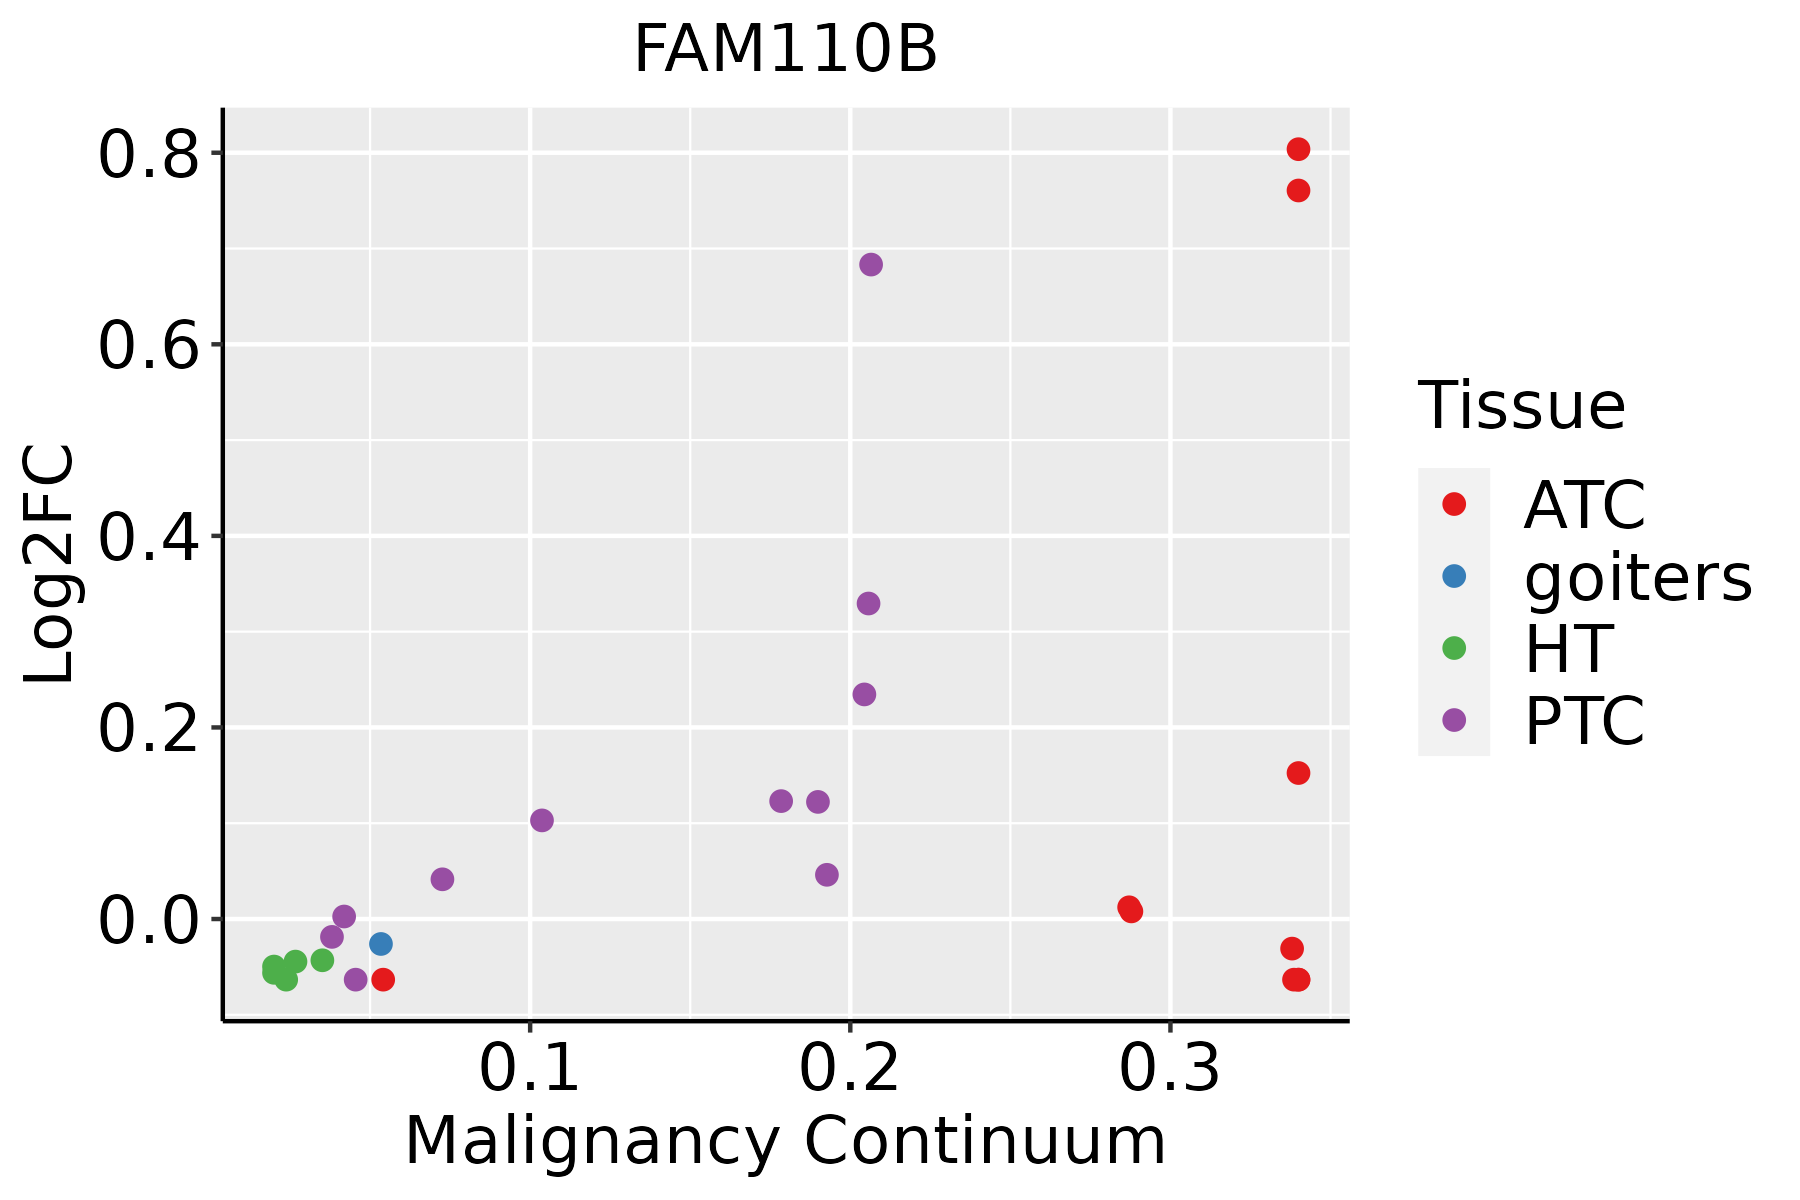 | ATC: Anaplastic thyroid cancer |
| HT: Hashimoto's thyroiditis | ||
| PTC: Papillary thyroid cancer |
| ∗log2FC in expression of this searched gene in stem-like cells from each diseased tissue sample relative to stem-like cells in normal samples in each tissue plotted against the malignancy continuum. Samples are colored based on if they are from different disease stage. |
Top |
Malignant transformation related pathway analysis |
| Find out the enriched GO biological processes and KEGG pathways involved in transition from healthy to precancer to cancer |
| Tissue | Disease Stage | Enriched GO biological Processes |
| Colorectum | AD |  |
| Colorectum | SER |  |
| Colorectum | MSS |  |
| Colorectum | MSI-H |  |
| Colorectum | FAP |  |
| ∗Top 15 enriched GO BP terms are showed in the bar plot of each disease state in each tissue. Each row represents a significant GO biological process which is colored according to the -log10(p.adjust). |
| Page: 1 2 3 4 5 6 7 8 9 |
| GO ID | Tissue | Disease Stage | Description | Gene Ratio | Bg Ratio | pvalue | p.adjust | Count |
| Page: 1 |
| Pathway ID | Tissue | Disease Stage | Description | Gene Ratio | Bg Ratio | pvalue | p.adjust | qvalue | Count |
| Page: 1 |
Top |
Cell-cell communication analysis |
| Identification of potential cell-cell interactions between two cell types and their ligand-receptor pairs for different disease states |
| Ligand | Receptor | LRpair | Pathway | Tissue | Disease Stage |
| Page: 1 |
Top |
Single-cell gene regulatory network inference analysis |
| Find out the significant the regulons (TFs) and the target genes of each regulon across cell types for different disease states |
| TF | Cell Type | Tissue | Disease Stage | Target Gene | RSS | Regulon Activity |
| ∗The dot plots of a searched regulon are shown for all cell subpopulations in each disease state of each tissue based on the regulon specific score inferred using pySCENIC and by calculating the average expression. |
| Page: 1 |
Top |
Somatic mutation of malignant transformation related genes |
| Annotation of somatic variants for genes involved in malignant transformation |
| Hugo Symbol | Variant Class | Variant Classification | dbSNP RS | HGVSc | HGVSp | HGVSp Short | SWISSPROT | BIOTYPE | SIFT | PolyPhen | Tumor Sample Barcode | Tissue | Histology | Sex | Age | Stage | Therapy Types | Drugs | Outcome |
| FAM110B | SNV | Missense_Mutation | novel | c.83G>A | p.Arg28His | p.R28H | Q8TC76 | protein_coding | deleterious(0) | probably_damaging(0.999) | TCGA-BH-A18G-01 | Breast | breast invasive carcinoma | Female | >=65 | I/II | Unknown | Unknown | SD |
| FAM110B | insertion | Nonsense_Mutation | novel | c.932_933insGAATAGGTTACTCTCTTAGCATTCCTAATTAT | p.Ser312AsnfsTer6 | p.S312Nfs*6 | Q8TC76 | protein_coding | TCGA-BH-A0HK-01 | Breast | breast invasive carcinoma | Female | >=65 | I/II | Hormone Therapy | arimidex | SD | ||
| FAM110B | SNV | Missense_Mutation | novel | c.242N>T | p.Ala81Val | p.A81V | Q8TC76 | protein_coding | tolerated(0.24) | benign(0.005) | TCGA-C5-A2LZ-01 | Cervix | cervical & endocervical cancer | Female | >=65 | III/IV | Unknown | Unknown | PD |
| FAM110B | SNV | Missense_Mutation | c.772C>T | p.Arg258Trp | p.R258W | Q8TC76 | protein_coding | deleterious(0) | probably_damaging(0.999) | TCGA-AA-3660-01 | Colorectum | colon adenocarcinoma | Female | <65 | I/II | Unknown | Unknown | SD | |
| FAM110B | SNV | Missense_Mutation | c.383N>T | p.Ser128Phe | p.S128F | Q8TC76 | protein_coding | deleterious(0.04) | probably_damaging(0.979) | TCGA-AA-3710-01 | Colorectum | colon adenocarcinoma | Female | >=65 | I/II | Unknown | Unknown | SD | |
| FAM110B | SNV | Missense_Mutation | novel | c.512N>A | p.Arg171His | p.R171H | Q8TC76 | protein_coding | tolerated(0.16) | benign(0) | TCGA-AA-3947-01 | Colorectum | colon adenocarcinoma | Female | <65 | I/II | Unknown | Unknown | SD |
| FAM110B | SNV | Missense_Mutation | rs765086827 | c.443N>A | p.Arg148Gln | p.R148Q | Q8TC76 | protein_coding | tolerated(0.55) | benign(0) | TCGA-AA-3975-01 | Colorectum | colon adenocarcinoma | Male | >=65 | I/II | Unknown | Unknown | SD |
| FAM110B | SNV | Missense_Mutation | novel | c.804N>A | p.Phe268Leu | p.F268L | Q8TC76 | protein_coding | deleterious(0.04) | benign(0.209) | TCGA-AA-3984-01 | Colorectum | colon adenocarcinoma | Female | <65 | I/II | Unknown | Unknown | SD |
| FAM110B | SNV | Missense_Mutation | c.274G>A | p.Ala92Thr | p.A92T | Q8TC76 | protein_coding | tolerated(0.52) | benign(0.041) | TCGA-AA-A02K-01 | Colorectum | colon adenocarcinoma | Male | <65 | III/IV | Chemotherapy | folinic | PD | |
| FAM110B | SNV | Missense_Mutation | c.1036N>A | p.Glu346Lys | p.E346K | Q8TC76 | protein_coding | deleterious(0) | probably_damaging(0.995) | TCGA-CA-6718-01 | Colorectum | colon adenocarcinoma | Male | <65 | I/II | Unknown | Unknown | PD |
| Page: 1 2 3 4 5 6 7 8 |
Top |
Related drugs of malignant transformation related genes |
| Identification of chemicals and drugs interact with genes involved in malignant transfromation |
| (DGIdb 4.0) |
| Entrez ID | Symbol | Category | Interaction Types | Drug Claim Name | Drug Name | PMIDs |
| Page: 1 |

Copyright 2023-Present -The University of Texas Health Science Center at Houston |