
|
|||||
|
 | |
| |
| |
| |
| |
| |
|
Gene: FAM110A |
Gene summary for FAM110A |
| Gene information | Species | Human | Gene symbol | FAM110A | Gene ID | 83541 |
| Gene name | family with sequence similarity 110 member A | |
| Gene Alias | C20orf55 | |
| Cytomap | 20p13 | |
| Gene Type | protein-coding | GO ID | GO:0000922 | UniProtAcc | Q9BQ89 |
Top |
Malignant transformation analysis |
| Identification of the aberrant gene expression in precancerous and cancerous lesions by comparing the gene expression of stem-like cells in diseased tissues with normal stem cells |
| Entrez ID | Symbol | Replicates | Species | Organ | Tissue | Adj P-value | Log2FC | Malignancy |
| 83541 | FAM110A | GSM4909292 | Human | Breast | IDC | 1.84e-02 | 4.67e-01 | 0.1236 |
| 83541 | FAM110A | GSM4909297 | Human | Breast | IDC | 1.04e-02 | 1.44e-02 | 0.1517 |
| 83541 | FAM110A | GSM4909298 | Human | Breast | IDC | 3.24e-04 | 2.90e-01 | 0.1551 |
| 83541 | FAM110A | GSM4909311 | Human | Breast | IDC | 1.05e-06 | -5.88e-02 | 0.1534 |
| 83541 | FAM110A | GSM4909312 | Human | Breast | IDC | 3.96e-02 | 9.60e-02 | 0.1552 |
| 83541 | FAM110A | GSM4909317 | Human | Breast | IDC | 5.79e-19 | 5.63e-01 | 0.1355 |
| 83541 | FAM110A | GSM4909319 | Human | Breast | IDC | 4.75e-10 | -7.16e-02 | 0.1563 |
| 83541 | FAM110A | GSM4909321 | Human | Breast | IDC | 1.19e-03 | 8.04e-02 | 0.1559 |
| 83541 | FAM110A | P1 | Human | Breast | IDC | 1.10e-04 | -9.38e-02 | 0.1527 |
| 83541 | FAM110A | DCIS2 | Human | Breast | DCIS | 1.55e-23 | 1.58e-02 | 0.0085 |
| 83541 | FAM110A | LZE4T | Human | Esophagus | ESCC | 2.35e-07 | 2.08e-01 | 0.0811 |
| 83541 | FAM110A | LZE20T | Human | Esophagus | ESCC | 1.19e-10 | 2.90e-01 | 0.0662 |
| 83541 | FAM110A | LZE24T | Human | Esophagus | ESCC | 2.96e-15 | 1.89e-01 | 0.0596 |
| 83541 | FAM110A | LZE21T | Human | Esophagus | ESCC | 1.43e-02 | 2.13e-01 | 0.0655 |
| 83541 | FAM110A | P1T-E | Human | Esophagus | ESCC | 1.30e-11 | 6.15e-01 | 0.0875 |
| 83541 | FAM110A | P2T-E | Human | Esophagus | ESCC | 6.73e-27 | 5.28e-01 | 0.1177 |
| 83541 | FAM110A | P4T-E | Human | Esophagus | ESCC | 1.37e-16 | 5.73e-01 | 0.1323 |
| 83541 | FAM110A | P5T-E | Human | Esophagus | ESCC | 3.59e-07 | 7.85e-02 | 0.1327 |
| 83541 | FAM110A | P8T-E | Human | Esophagus | ESCC | 1.84e-20 | 3.21e-01 | 0.0889 |
| 83541 | FAM110A | P9T-E | Human | Esophagus | ESCC | 6.63e-18 | 3.48e-01 | 0.1131 |
| Page: 1 2 3 4 5 |
| Tissue | Expression Dynamics | Abbreviation |
| Breast | 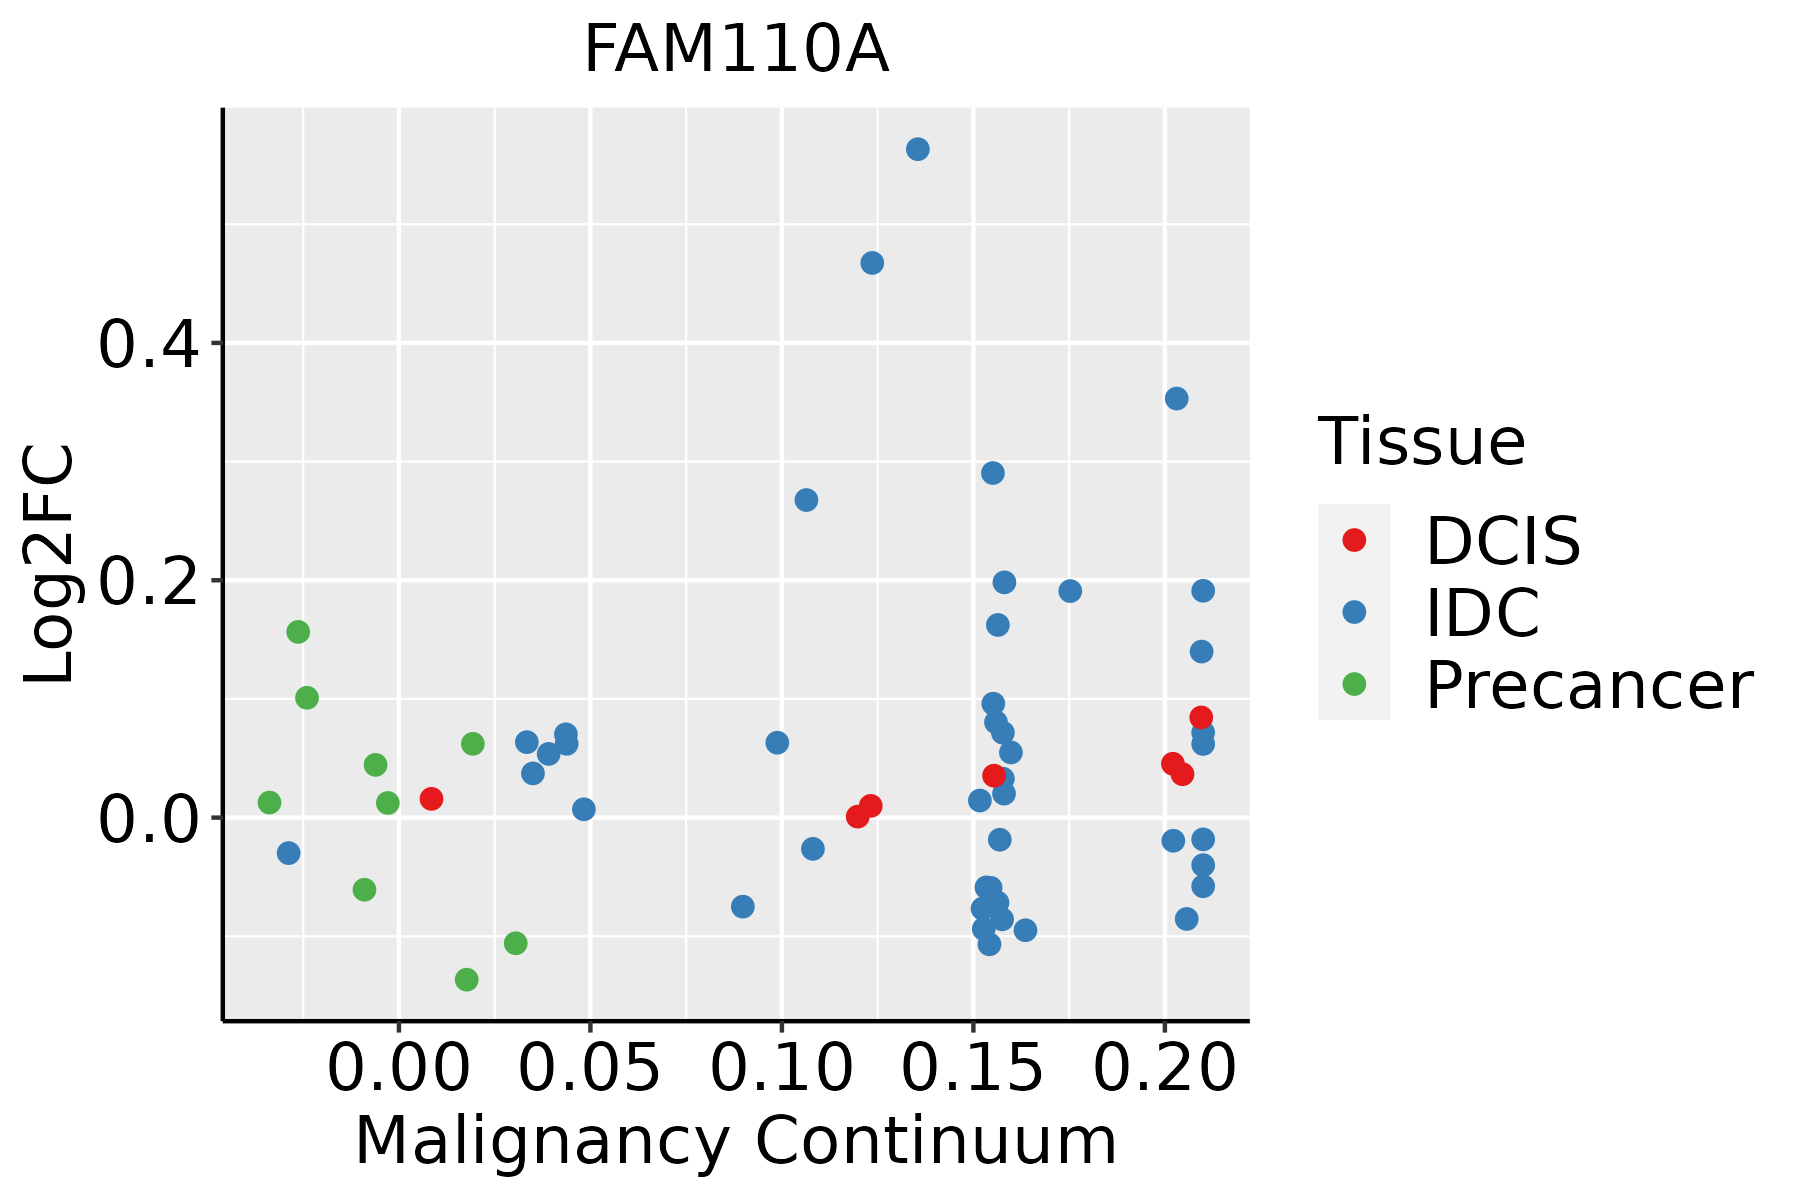 | IDC: Invasive ductal carcinoma |
| DCIS: Ductal carcinoma in situ | ||
| Precancer(BRCA1-mut): Precancerous lesion from BRCA1 mutation carriers | ||
| Esophagus |  | ESCC: Esophageal squamous cell carcinoma |
| HGIN: High-grade intraepithelial neoplasias | ||
| LGIN: Low-grade intraepithelial neoplasias | ||
| Oral Cavity | 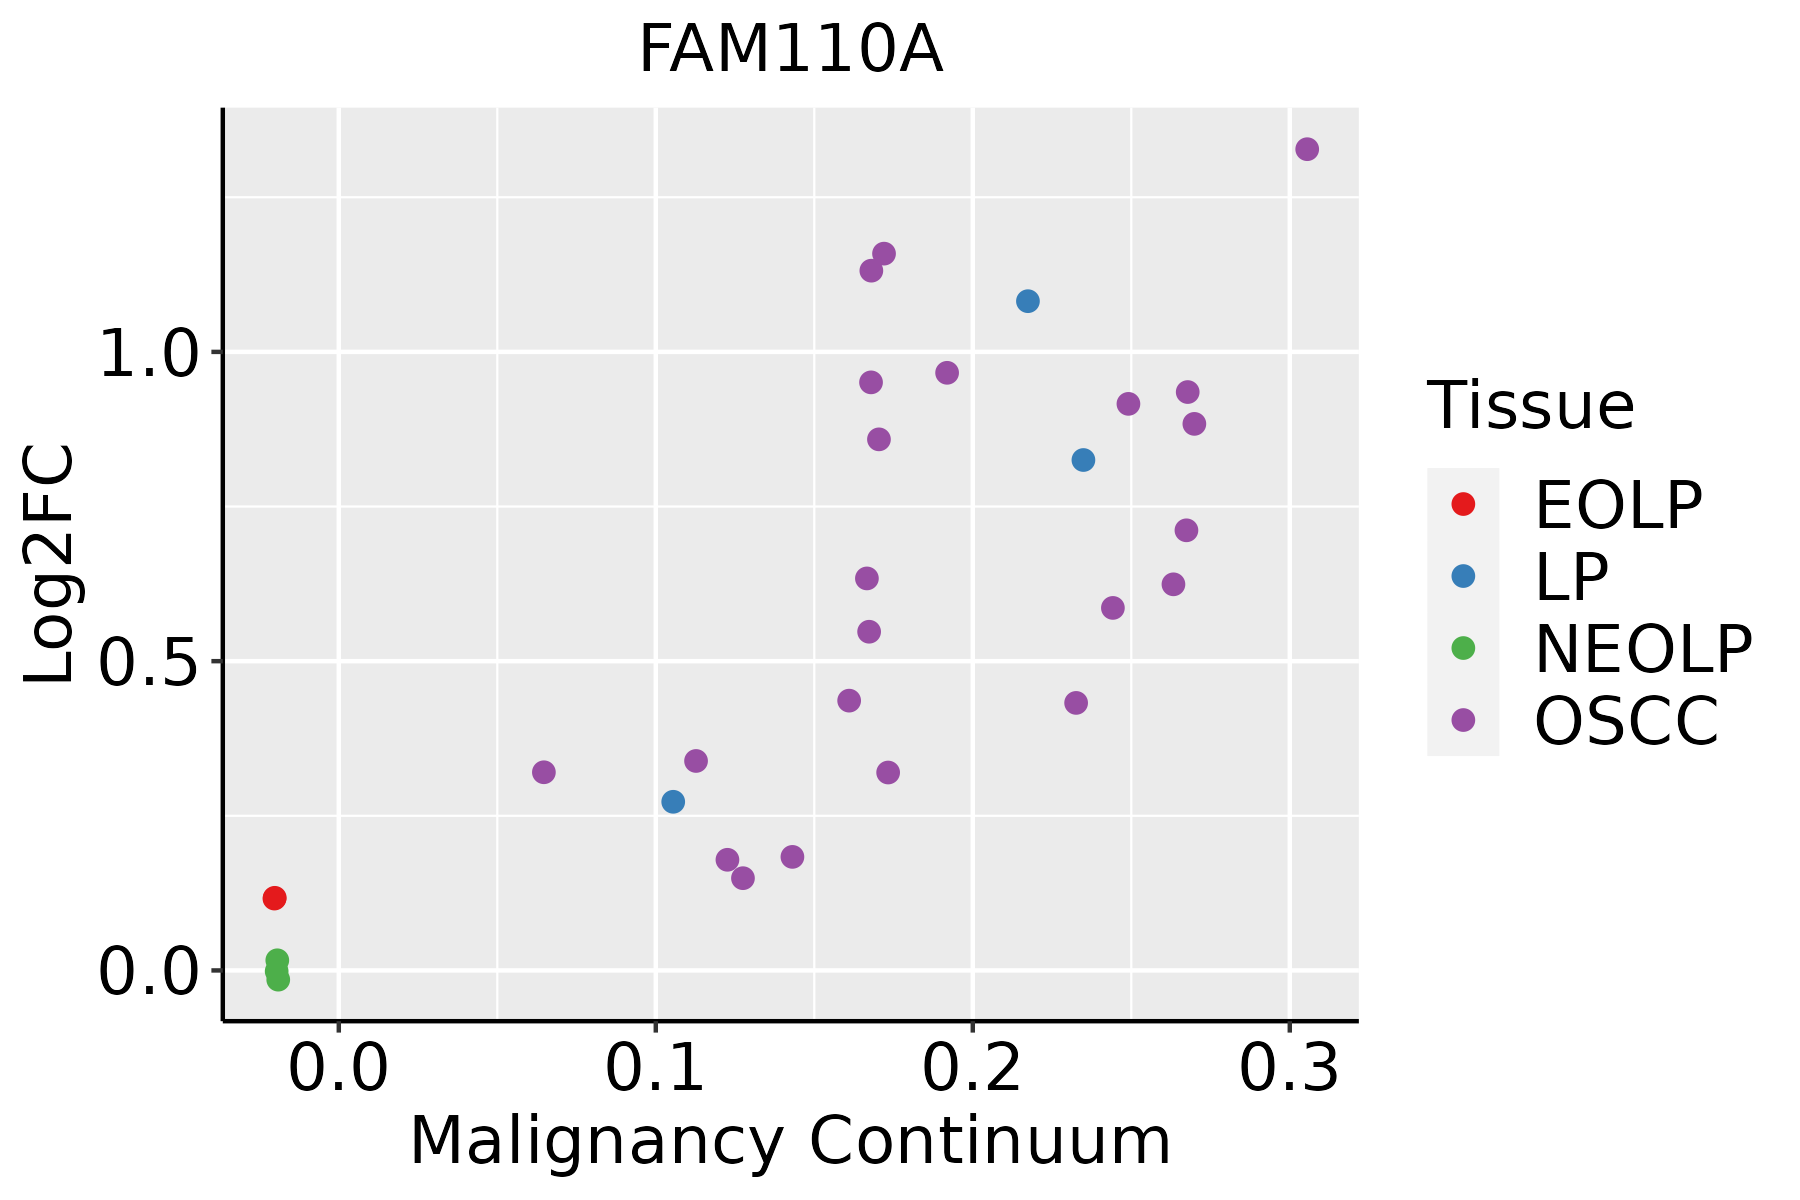 | EOLP: Erosive Oral lichen planus |
| LP: leukoplakia | ||
| NEOLP: Non-erosive oral lichen planus | ||
| OSCC: Oral squamous cell carcinoma | ||
| Skin | 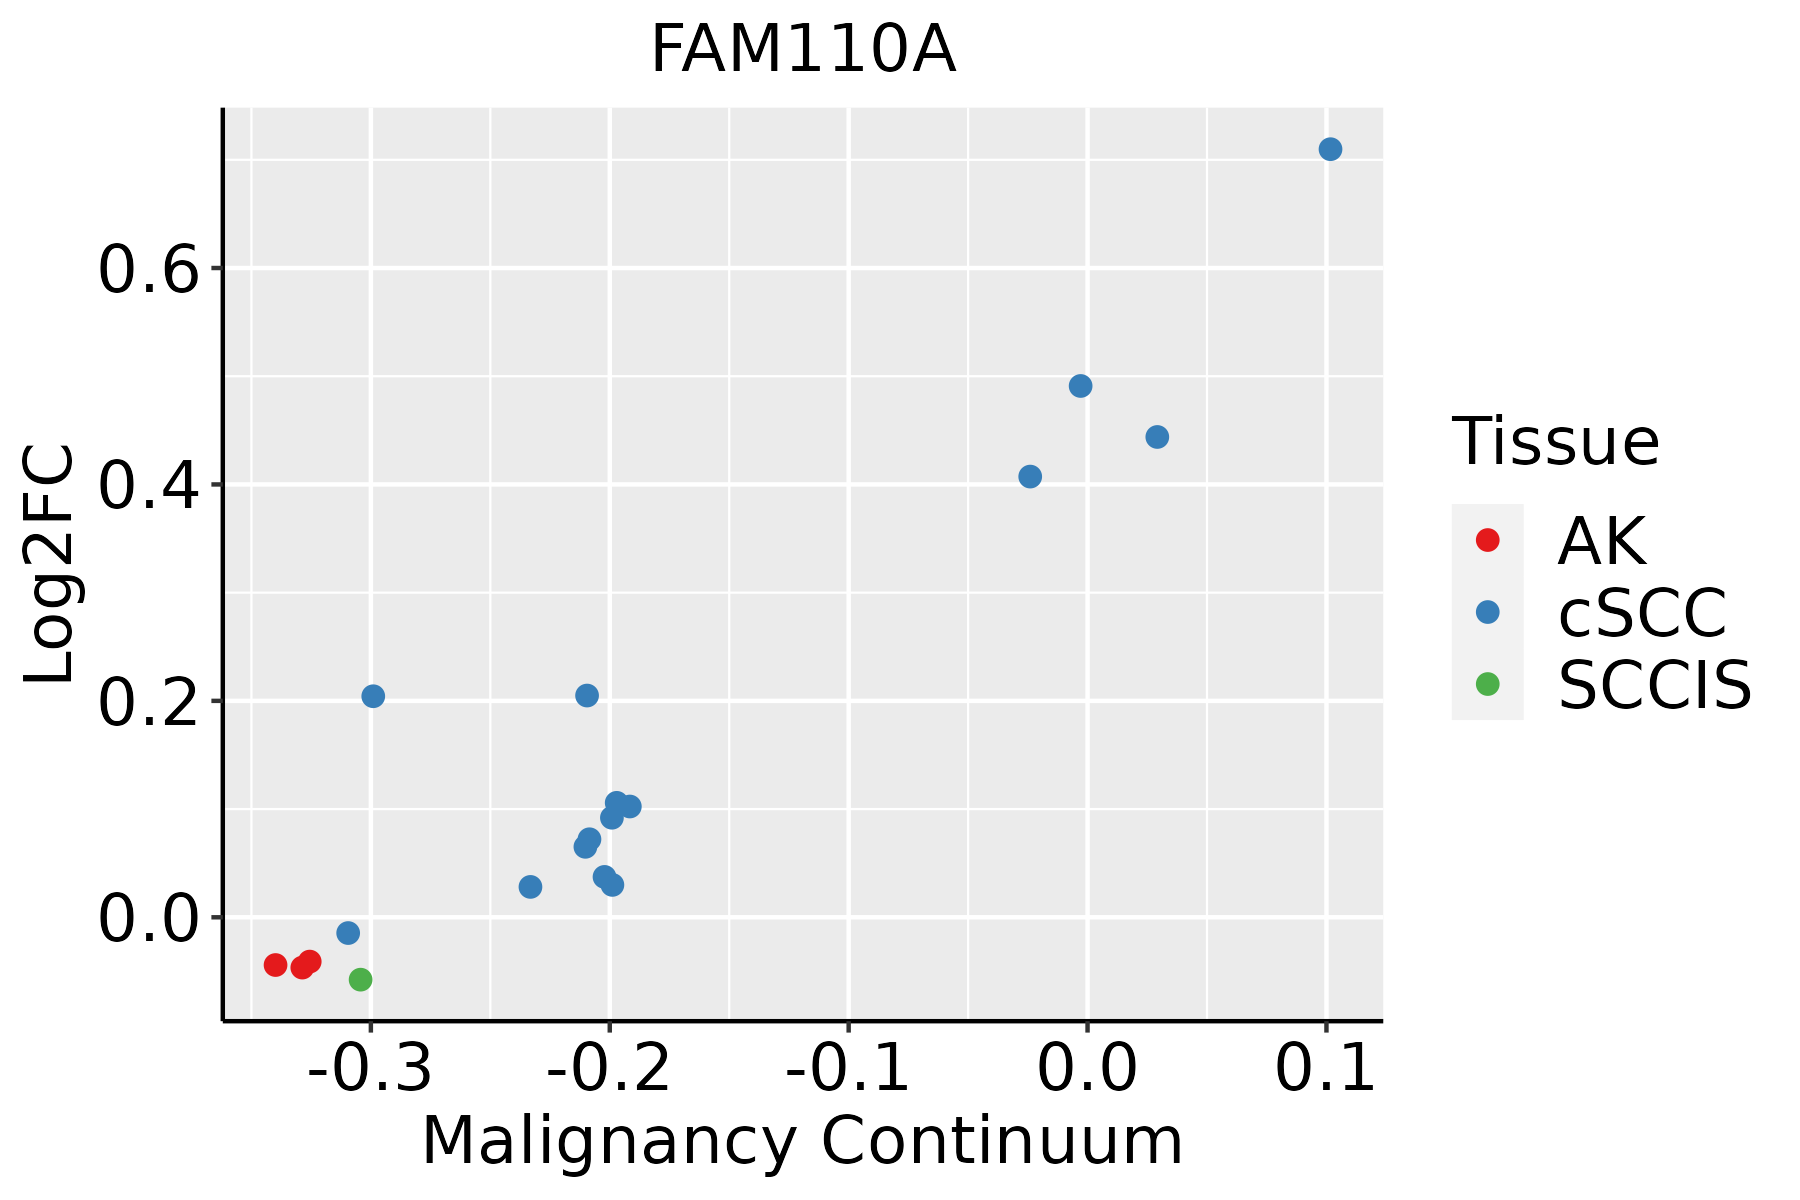 | AK: Actinic keratosis |
| cSCC: Cutaneous squamous cell carcinoma | ||
| SCCIS:squamous cell carcinoma in situ |
| ∗log2FC in expression of this searched gene in stem-like cells from each diseased tissue sample relative to stem-like cells in normal samples in each tissue plotted against the malignancy continuum. Samples are colored based on if they are from different disease stage. |
Top |
Malignant transformation related pathway analysis |
| Find out the enriched GO biological processes and KEGG pathways involved in transition from healthy to precancer to cancer |
| Tissue | Disease Stage | Enriched GO biological Processes |
| Colorectum | AD |  |
| Colorectum | SER |  |
| Colorectum | MSS |  |
| Colorectum | MSI-H |  |
| Colorectum | FAP |  |
| ∗Top 15 enriched GO BP terms are showed in the bar plot of each disease state in each tissue. Each row represents a significant GO biological process which is colored according to the -log10(p.adjust). |
| Page: 1 2 3 4 5 6 7 8 9 |
| GO ID | Tissue | Disease Stage | Description | Gene Ratio | Bg Ratio | pvalue | p.adjust | Count |
| Page: 1 |
| Pathway ID | Tissue | Disease Stage | Description | Gene Ratio | Bg Ratio | pvalue | p.adjust | qvalue | Count |
| Page: 1 |
Top |
Cell-cell communication analysis |
| Identification of potential cell-cell interactions between two cell types and their ligand-receptor pairs for different disease states |
| Ligand | Receptor | LRpair | Pathway | Tissue | Disease Stage |
| Page: 1 |
Top |
Single-cell gene regulatory network inference analysis |
| Find out the significant the regulons (TFs) and the target genes of each regulon across cell types for different disease states |
| TF | Cell Type | Tissue | Disease Stage | Target Gene | RSS | Regulon Activity |
| ∗The dot plots of a searched regulon are shown for all cell subpopulations in each disease state of each tissue based on the regulon specific score inferred using pySCENIC and by calculating the average expression. |
| Page: 1 |
Top |
Somatic mutation of malignant transformation related genes |
| Annotation of somatic variants for genes involved in malignant transformation |
| Hugo Symbol | Variant Class | Variant Classification | dbSNP RS | HGVSc | HGVSp | HGVSp Short | SWISSPROT | BIOTYPE | SIFT | PolyPhen | Tumor Sample Barcode | Tissue | Histology | Sex | Age | Stage | Therapy Types | Drugs | Outcome |
| FAM110A | SNV | Missense_Mutation | rs529130062 | c.55N>T | p.Arg19Cys | p.R19C | Q9BQ89 | protein_coding | deleterious(0) | probably_damaging(0.995) | TCGA-AR-A0TR-01 | Breast | breast invasive carcinoma | Female | >=65 | I/II | Hormone Therapy | tamoxiphen | SD |
| FAM110A | SNV | Missense_Mutation | novel | c.650N>T | p.Arg217Ile | p.R217I | Q9BQ89 | protein_coding | deleterious(0) | probably_damaging(0.934) | TCGA-BH-A1F5-01 | Breast | breast invasive carcinoma | Female | <65 | I/II | Unknown | Unknown | SD |
| FAM110A | deletion | Frame_Shift_Del | c.610delN | p.Arg204AlafsTer51 | p.R204Afs*51 | Q9BQ89 | protein_coding | TCGA-D8-A27V-01 | Breast | breast invasive carcinoma | Female | <65 | I/II | Hormone Therapy | tamoxiphen | SD | |||
| FAM110A | SNV | Missense_Mutation | c.53N>A | p.Cys18Tyr | p.C18Y | Q9BQ89 | protein_coding | deleterious(0.01) | benign(0.014) | TCGA-AD-5900-01 | Colorectum | colon adenocarcinoma | Male | >=65 | I/II | Unknown | Unknown | SD | |
| FAM110A | SNV | Missense_Mutation | c.611N>A | p.Arg204His | p.R204H | Q9BQ89 | protein_coding | deleterious(0) | probably_damaging(0.999) | TCGA-D5-6540-01 | Colorectum | colon adenocarcinoma | Male | >=65 | I/II | Unknown | Unknown | SD | |
| FAM110A | SNV | Missense_Mutation | c.253N>A | p.Val85Met | p.V85M | Q9BQ89 | protein_coding | tolerated(0.38) | benign(0.024) | TCGA-G4-6628-01 | Colorectum | colon adenocarcinoma | Male | >=65 | I/II | Unknown | Unknown | SD | |
| FAM110A | SNV | Missense_Mutation | novel | c.679N>A | p.Ala227Thr | p.A227T | Q9BQ89 | protein_coding | deleterious(0.01) | probably_damaging(0.939) | TCGA-A5-A2K3-01 | Endometrium | uterine corpus endometrioid carcinoma | Female | >=65 | I/II | Chemotherapy | carboplatin | SD |
| FAM110A | SNV | Missense_Mutation | novel | c.824N>T | p.Ala275Val | p.A275V | Q9BQ89 | protein_coding | deleterious(0) | probably_damaging(0.998) | TCGA-AX-A06F-01 | Endometrium | uterine corpus endometrioid carcinoma | Female | <65 | III/IV | Chemotherapy | carboplatin | SD |
| FAM110A | SNV | Missense_Mutation | rs758683222 | c.862N>T | p.Arg288Trp | p.R288W | Q9BQ89 | protein_coding | deleterious(0.03) | probably_damaging(0.991) | TCGA-BS-A0UV-01 | Endometrium | uterine corpus endometrioid carcinoma | Female | <65 | III/IV | Unknown | Unknown | SD |
| FAM110A | SNV | Missense_Mutation | c.829N>A | p.Val277Met | p.V277M | Q9BQ89 | protein_coding | deleterious(0) | probably_damaging(0.995) | TCGA-D1-A103-01 | Endometrium | uterine corpus endometrioid carcinoma | Female | >=65 | I/II | Unknown | Unknown | SD |
| Page: 1 2 |
Top |
Related drugs of malignant transformation related genes |
| Identification of chemicals and drugs interact with genes involved in malignant transfromation |
| (DGIdb 4.0) |
| Entrez ID | Symbol | Category | Interaction Types | Drug Claim Name | Drug Name | PMIDs |
| Page: 1 |

Copyright 2023-Present -The University of Texas Health Science Center at Houston |